Title
Create new category
Edit page index title
Edit category
Edit link
Manage Clusters
A cluster is a group of nodes that work together to run large-scale parallel computation tasks. These tasks are common in data science, data engineering, and data analytics.
Pulse captures metadata from these tasks to help you monitor, manage, and optimize cluster operations.
This enables you to:
- Check cluster activity in one place, viewing all clusters and their key metrics.
- Monitor cluster health by tracking service status and resources to identify issues early.
- Track CPU and memory usage to prevent performance bottlenecks.
- Respond to critical and high-priority incidents in real time.
Select a Cluster
Pulse supports monitoring multiple clusters in a single instance, enabling you to view metrics for all clusters in one place.
Steps:
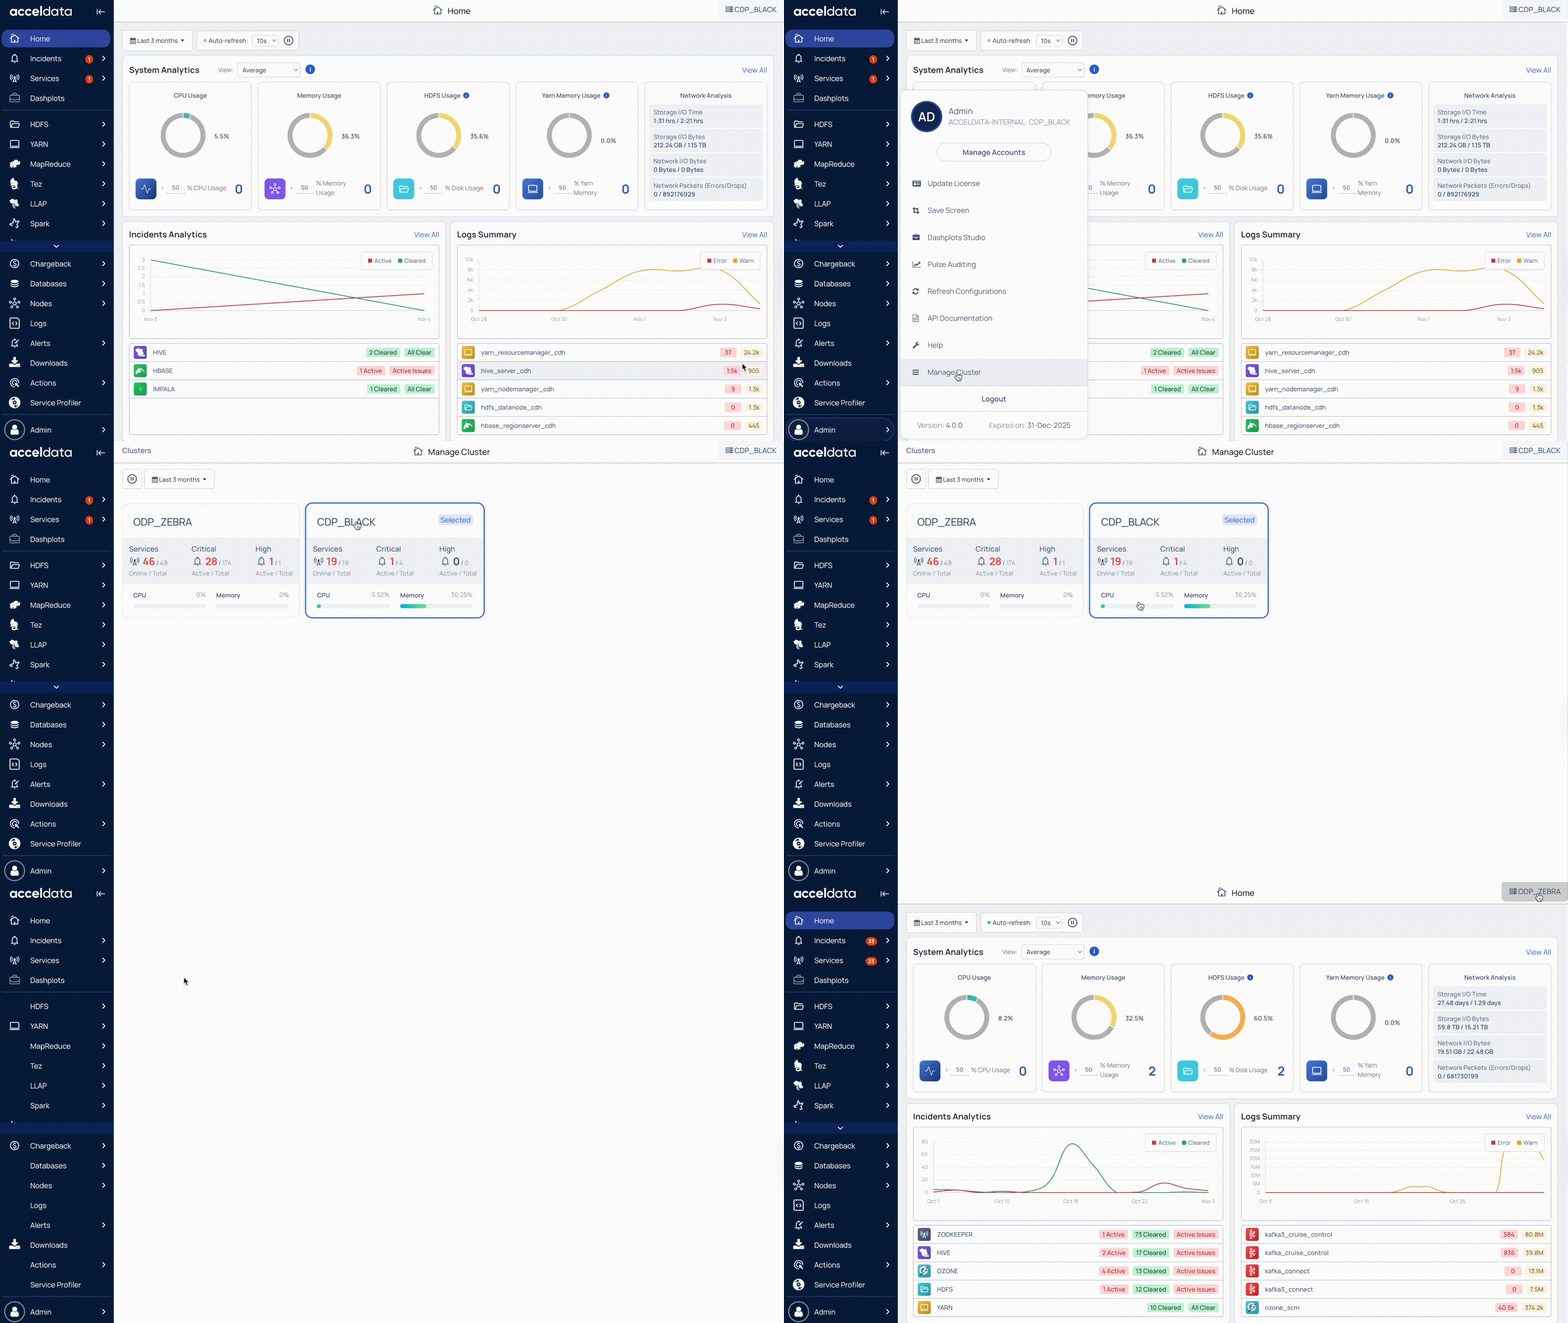
In the Pulse UI, go to Admin (bottom left).
On the Admin page, select Manage Cluster.
The available clusters appear on the screen.
- Select a cluster to view detailed metrics across all Pulse UI pages.
- Alternatively, check overall cluster performance across all clusters in one place.

Set Time Range and Refresh Interval
Set time range and refresh intervals to focus on relevant data. This ensures you view timely and meaningful information.
- Refresh status: Use the Play (⏵) button to refresh the cluster status every 10 seconds. Use the Pause (⏸) button to stop refreshing.
- Timestamp: Select a time range (for example, Today, Last 12 hours, Last 3 months) or choose a custom period, then click Apply.
Monitor Cluster Metrics
You can monitor cluster metrics to assess service health, identify active incidents, and track resource usage. These insights help you identify risks early and maintain smooth operations.
The available metrics include:
- Services: See how many services are running (online) compared to the total number of services running on nodes connected to the cluster.
- Critical incidents: Track active incidents that require immediate resolution.
- High-priority incidents: Monitor raised incidents marked as high priority.
- CPU usage: Check CPU utilization (%) to identify resource strain.
- Memory usage: Check memory utilization (%) to detect potential overload.
Next Steps
After reviewing all cluster metrics in a single view, you can select a cluster to explore its detailed health overview in Monitor Cluster Health (Overview).
For additional help, contact www.acceldata.force.com OR call our service desk +1 844 9433282
Copyright © 2026