Title
Create new category
Edit page index title
Edit category
Edit link
Monitor Cluster Health (Overview)
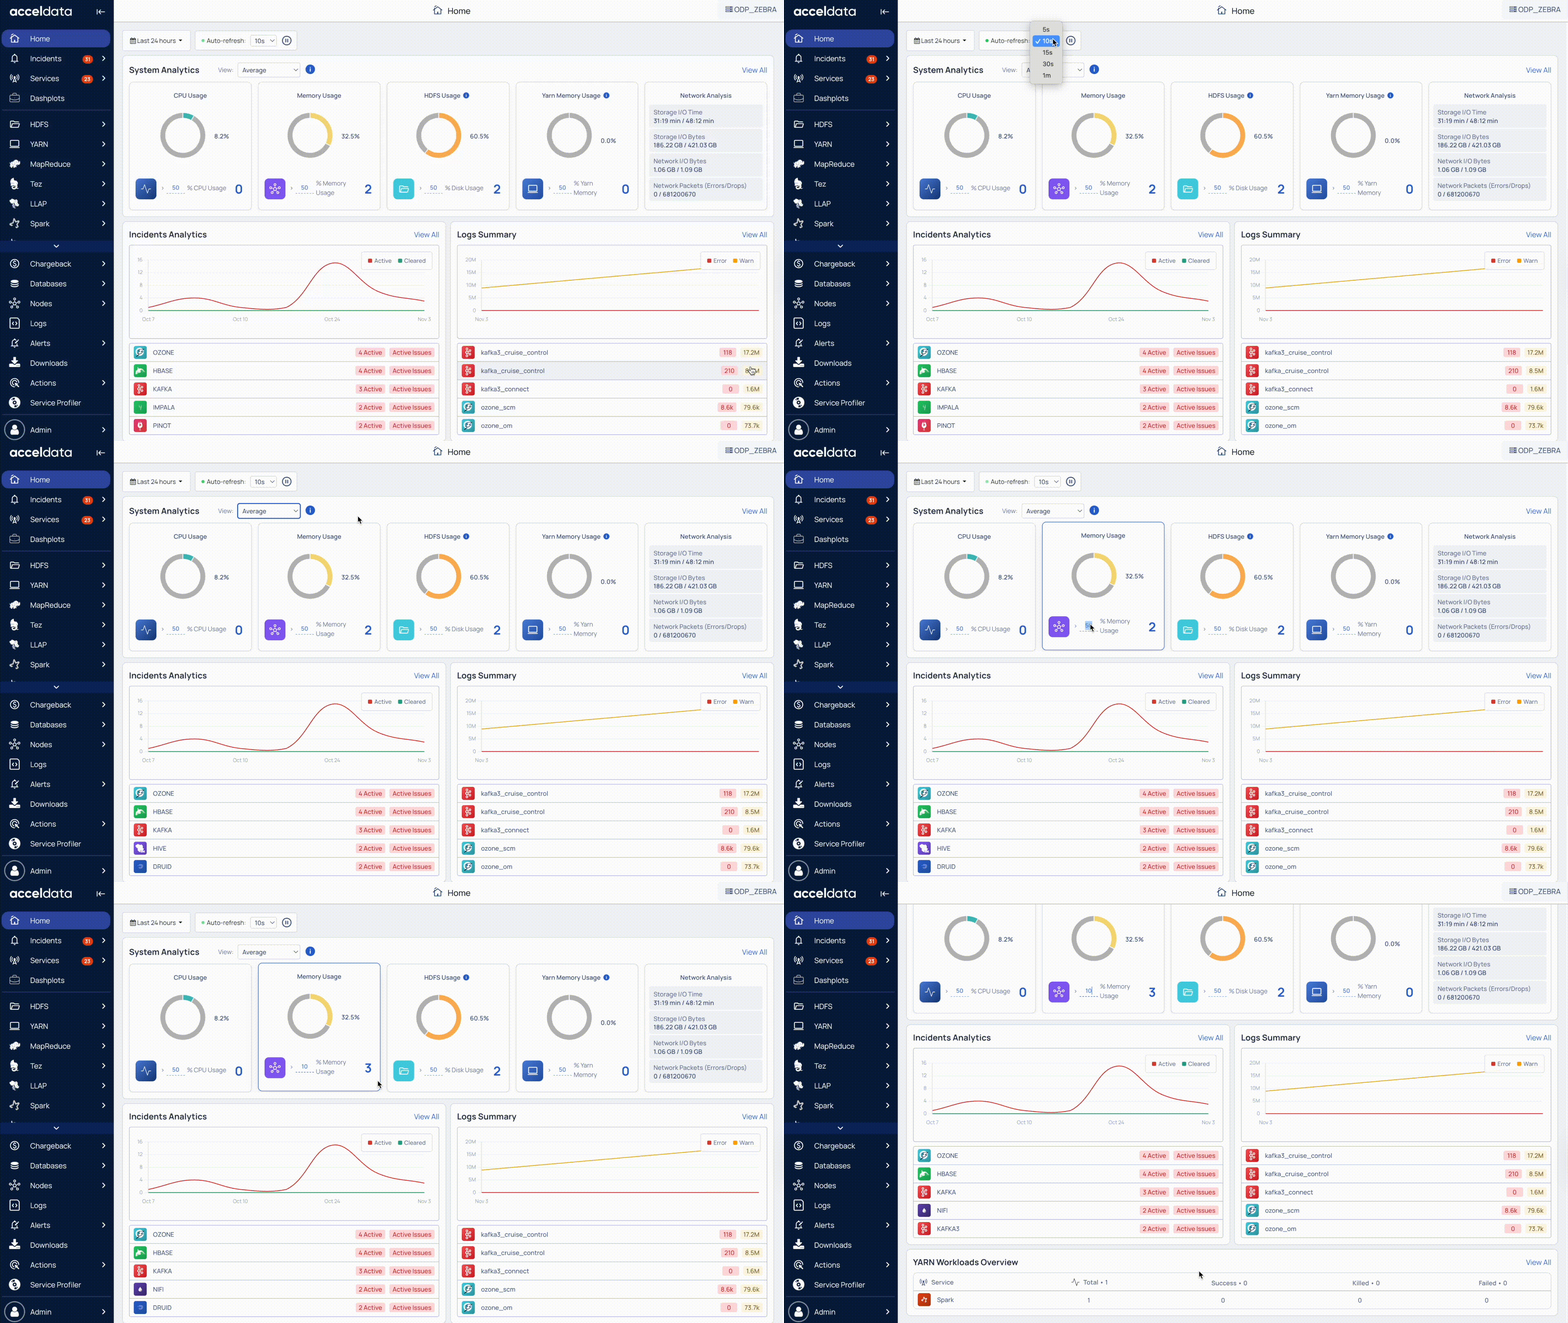
The Pulse Home page provides a unified summary of cluster health, combining key insights from nodes, workloads, incidents, and logs. This high-level view helps you quickly assess overall cluster performance and stability.
The Home page enables you to:
- View summarized node performance metrics, including CPU, memory, disk, and network usage.
- Review incident trends and log summaries to detect and troubleshoot issues quickly.
- Track total, killed, and failed YARN workloads or applications across Hadoop services.
The Home page is ideal for daily monitoring and obtaining a general performance overview across the cluster.
Access Cluster Health Overview
You can access the Cluster Health Overview from the Pulse UI Home page.
To focus on relevant data:
- Set a time range to analyze for the specific period.
- Refresh status to view the latest cluster information.

Timestamp
- Select a time range, such as Today, Last 12 hours, or Last 3 months, or define a custom period, then click Apply.
Refresh Status
- Use the Play (⏵) button to refresh cluster status every 10 seconds by default.
- You can configure the refresh interval to 5, 15, 30 seconds, or 1 minute.
- Use the Pause (⏸) button to stop refreshing.
The Home dashboard provides a quick summary of your cluster’s overall health and activity. It includes:
System Analytics: CPU, memory, HDFS, and YARN memory utilization trends.
- Nodes Summary: Quick insights into node health.
- Network Analysis: I/O and network performance trends.
Incidents Analytics: Overview of active and cleared incidents.
Logs Summary: Error and warning trends across services.
YARN Workloads: Total, killed, and failed jobs or queries across Hadoop services.
System Analytics
The System Analytics section provides real-time visibility into overall resource utilization and network performance.
By default, Pulse displays the average values for CPU, memory, HDFS, and YARN memory usage across all hosts. You can also configure the view to display minimum, maximum, median, 95th percentile, or 99th percentile values.
Resource Usage
- CPU Usage: Percentage of CPU utilization across nodes.
- Memory Usage: Percentage of memory consumption across the cluster.
- HDFS Usage: Percentage of used HDFS storage.
- YARN Memory Usage: Percentage of memory utilization by YARN applications.
Under each usage metric, Pulse provides a Nodes Summary that highlights nodes exceeding threshold values:
- CPU load: Nodes with CPU utilization greater than 50%.
- Memory spikes: Nodes with memory utilization greater than 50%.
- Disk usage: Nodes with disk utilization greater than 50%.
- YARN memory spikes: Nodes with YARN memory utilization greater than 50%.
Pulse calculates the peak usage value (maximum utilization) of CPU, memory, and disk for each node within the selected time range.
You can modify the default 50% threshold to any value of your choice to see how many nodes exceed the specified metric threshold.
Network Analysis
Monitor I/O and network performance across the cluster.
- Disk read/write time: Total time spent on disk operations; shorter times indicate better performance.
- Disk I/O: Volume of data read and written; higher values suggest heavier load.
- Network I/O: Data transmitted and received across nodes.
- Network packets: Track packet drops or errors; zero errors indicate stable connectivity.
For detailed information about nodes, see Analyze Node Health and Performance.
Incidents Summary
The Incidents Analytics section tracks and categorizes issues across your cluster.
- Grouped by service type: HDFS, Ambari, Kudu, etc.
- Status: View incidents marked as Active or Cleared.
- Trends: Identify incident patterns over the last three months.
Details:
- Click View Details to see the total number of incidents raised.
- Click a specific service to open the Incidents page for deeper analysis.
- Click the Incidents icon (bell) in the left navigation bar to view incidents categorized as Critical, High, Medium, or Low severity and prioritize responses.
Logs Summary
The Logs Summary provides an overview of error and warning logs across services.
- Displays error and warning counts for each service.
- Shows log activity trends for the last three months.
- Provides service-wise logs for quick navigation and analysis.
This helps you monitor system stability and troubleshoot proactively.
For detailed information about Logs, see Troubleshoot Using Application Logs.
YARN Workloads Summary
The Overview section displays the total number of YARN workloads or applications, categorized by their status such as total, successful, killed, and failed.
You can click a service to open the Application Explorer and view detailed information such as application name, ID, final status, user, resource usage, and more.
For detailed information about workloads, see Analyze YARN Workloads or Applications.
Next Steps
For deeper analysis, explore nodes, logs, and YARN workloads. For details, see Analyze Cluster Health (In Detail).
For additional help, contact www.acceldata.force.com OR call our service desk +1 844 9433282
Copyright © 2026