Title
Create new category
Edit page index title
Edit category
Edit link
Trino Queries Details
The Trino Query Details page provides a comprehensive view of each executed Trino query, including the SQL statement, execution metrics, resource usage, and the query execution plan.
This helps you analyze query behavior, performance bottlenecks, and system utilization.
Steps
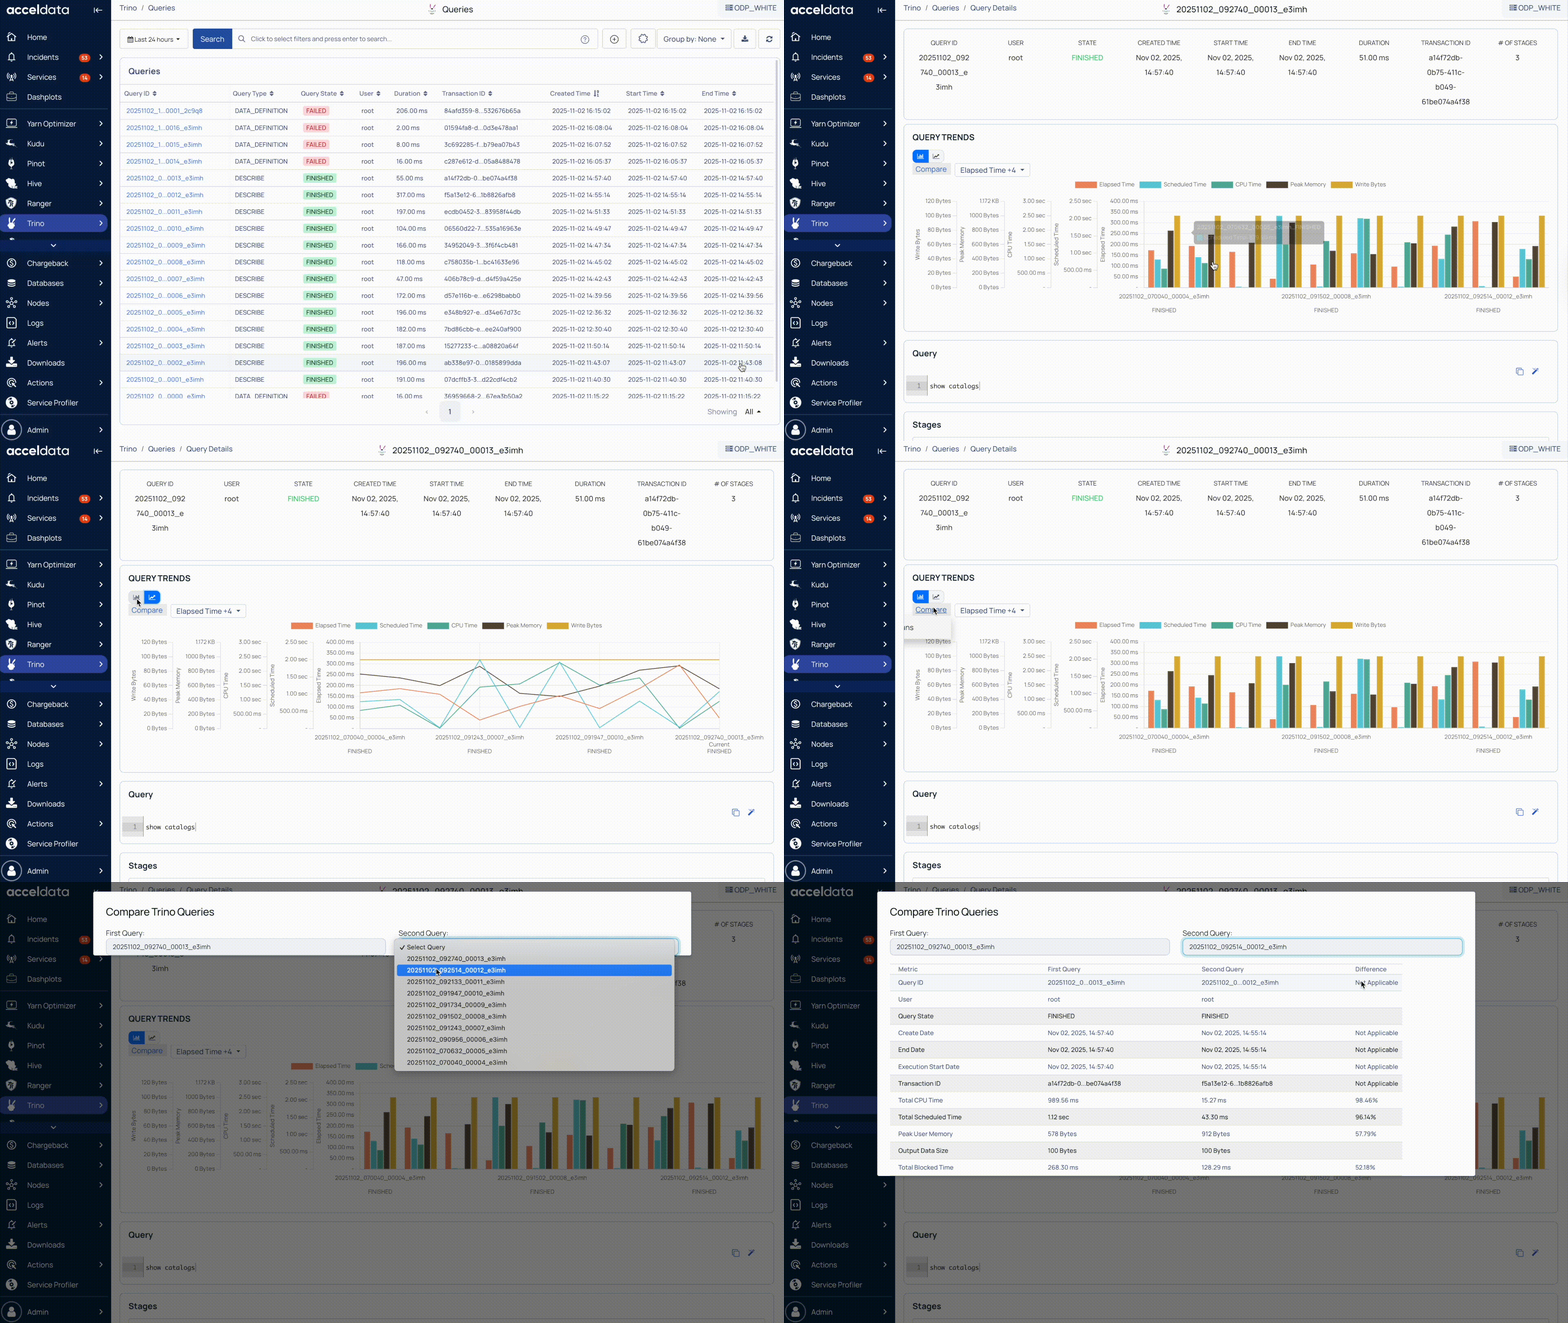
- In the Pulse UI, go to Trino > Queries.
- Set a time range to view all the executed queries.
- On the Queries page, click a Query ID.
You can see the details of the selected query.
Query Overview
In the Summary Panel, you can view high-level details about the query.
In the Summary Panel, you can view high-level details about the query.
Identification
- Query ID: Unique identifier assigned to the query.
- Transaction ID: Unique transaction identifier associated with the query.
- User: The user who submitted the query (for example, root).
Execution Details
- State: The final query state (for example, FINISHED, FAILED, CANCELED).
- # of Stages: Number of execution stages in the query plan.
- Duration: Total time taken to complete the query.
Timestamps
- Created Time: Timestamp when the query was created.
- Start Time: Timestamp when the query started execution.
- End Time: Timestamp when the query finished execution.
Query Trends
The Query Trends chart shows how a Trino query’s performance and resource usage change over multiple executions. Each bar represents one query run, allowing you to compare metrics across time.

Use this chart to:
- Detect performance regressions when execution time or memory usage increases.
- Identify data growth trends across runs.
- Assess resource efficiency (CPU, memory, I/O usage).
- Optimize queries by analyzing historical performance patterns.
Metrics Displayed
Each color on the chart represents a performance or resource metric:
- Elapsed Time: Total time taken to execute the query (in milliseconds). Lower is faster.
- Bytes Read: Total data volume read from storage. Indicates read intensity.
- Memory Usage: Memory consumed during query execution. High values suggest complex operations or large data scans.
- Rows Read: Number of rows scanned or processed to complete the query.
- Rows Written: Number of rows written during the query (for example, INSERT or temporary result storage).
- Bytes Written: Total amount of data written to disk or replicated during query execution.
How to Interpret
- X-Axis: Displays timestamps of query executions. Each bar or line group represents one completed run.
- Y-Axis: Shows metric values (e.g., time in ms, size in KB/MB).
Switch Charts
You can switch between a bar and to line chart.
Filter Metrics
You can filter the metrics of your choice to show on the graph.
Compare Runs
Click Compare Runs to compare side-by-side comparisons of query executions to detect variations in runtime or resource consumption.
Query Text and Catalog Information
This section shows the actual SQL query and the metadata of the involved tables:
- Query: The submitted SQL text.
- Catalog, Schema, Table: Location of referenced tables.
- Authorization: User role used for access.
- Columns: Lists the column(s) involved in the query.
Stage Execution Metrics
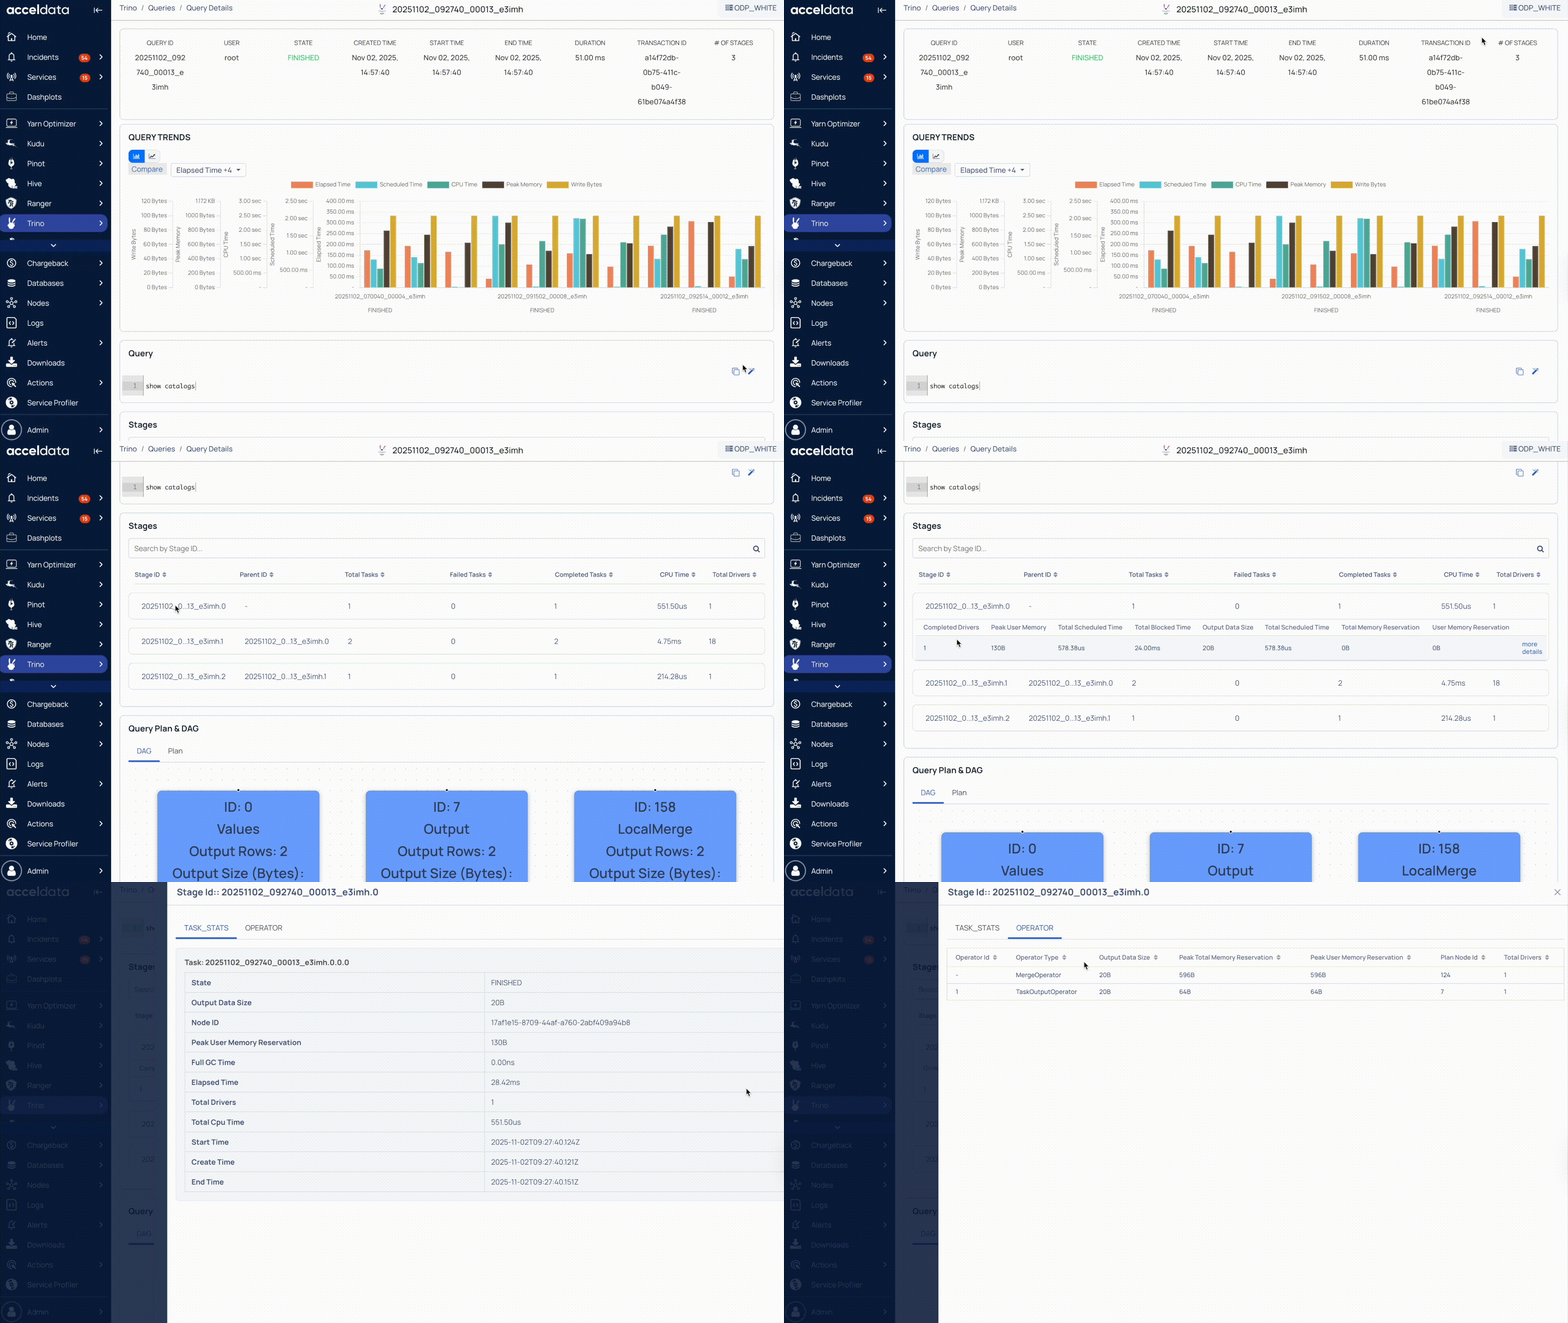
Each query is broken down into stages, which represent different parts of the query execution. Each stage includes the following details.

Stage Overview
- Stage ID: Unique identifier of the stage.
- Parent ID: Indicates the parent stage in the DAG (if any).
- Total Tasks: Number of parallel tasks executed in this stage.
- Failed Tasks: Number of tasks that failed during execution.
- Completed Tasks: Number of tasks that finished successfully.
- CPU Time: Total CPU time consumed by the tasks in this stage.
Detailed Stage Metrics
When you click a stage, the following details are displayed:
- Completed Drivers: Number of drivers (executors) that completed successfully.
- Peak User Memory: Maximum memory used by a driver in this stage.
- Total Scheduled Time: Total time scheduled across all drivers.
- Blocked Time: Time spent waiting (for example, I/O or resource contention).
- Output Data Size: Total amount of data output by the stage.
- User/Memory Reservation: Reserved memory amount per stage or driver.
Task Statistics and Operator Details
You can click More details to expand a stage for detailed tasks and operator-level metrics.
Task Stats Panel (Per Stage)
Displays per-task execution details within a selected stage.
- Task ID: Unique identifier for the task.
- State: Status of the task (for example, FINISHED).
- Output Data Size: Amount of data produced by the task.
- Node ID: Worker node executing the task.
- Peak User Memory Reservation: Peak memory reserved during execution.
- Garbage Collection (GC) Time: Time spent performing Java garbage collection.
- Elapsed Time: Total time taken by the task.
- CPU Time: CPU processing time consumed by the task.
- Start, Create, End Time: Execution timestamps marking task lifecycle events.
Operator Stats (Per Task)
This tab shows the breakdown of operators used within a task.
- Operator ID and Type: Identifies execution units such as ScanFilter or PartitionedOutput.
- Output Data Size: Amount of data emitted by the operator.
- Memory Reservation: Displays peak, total, and user memory used by the operator.
- Plan Node ID: Maps the operator back to its corresponding DAG node.
- Total Drivers: Number of drivers executing that operator.
Query Plan and DAG
The Query Plan and DAG section visualizes how Trino executes the query across its distributed architecture.
DAG (Directed Acyclic Graph) Tab
The DAG tab shows how the query is broken into logical plan nodes, including how data flows between stages and operations. It’s useful for identifying the execution strategy and pinpointing any inefficiencies.
Plan Tab
The Plan tab provides low-level, structured details about the query execution plan as interpreted by Trino. Unlike the DAG view (which is visual), this tab reveals the actual JSON metadata behind each node in the plan.
For additional help, contact www.acceldata.force.com OR call our service desk +1 844 9433282
Copyright © 2026