Pipeline Graph
This guide provides an overview of how to navigate and interpret the Pipeline Graph, focusing on the two main types of nodes: Asset Nodes and Job Nodes. You will learn how to access detailed information about jobs and assets, understand policy execution statuses, and interact with alerts related to your pipeline executions.
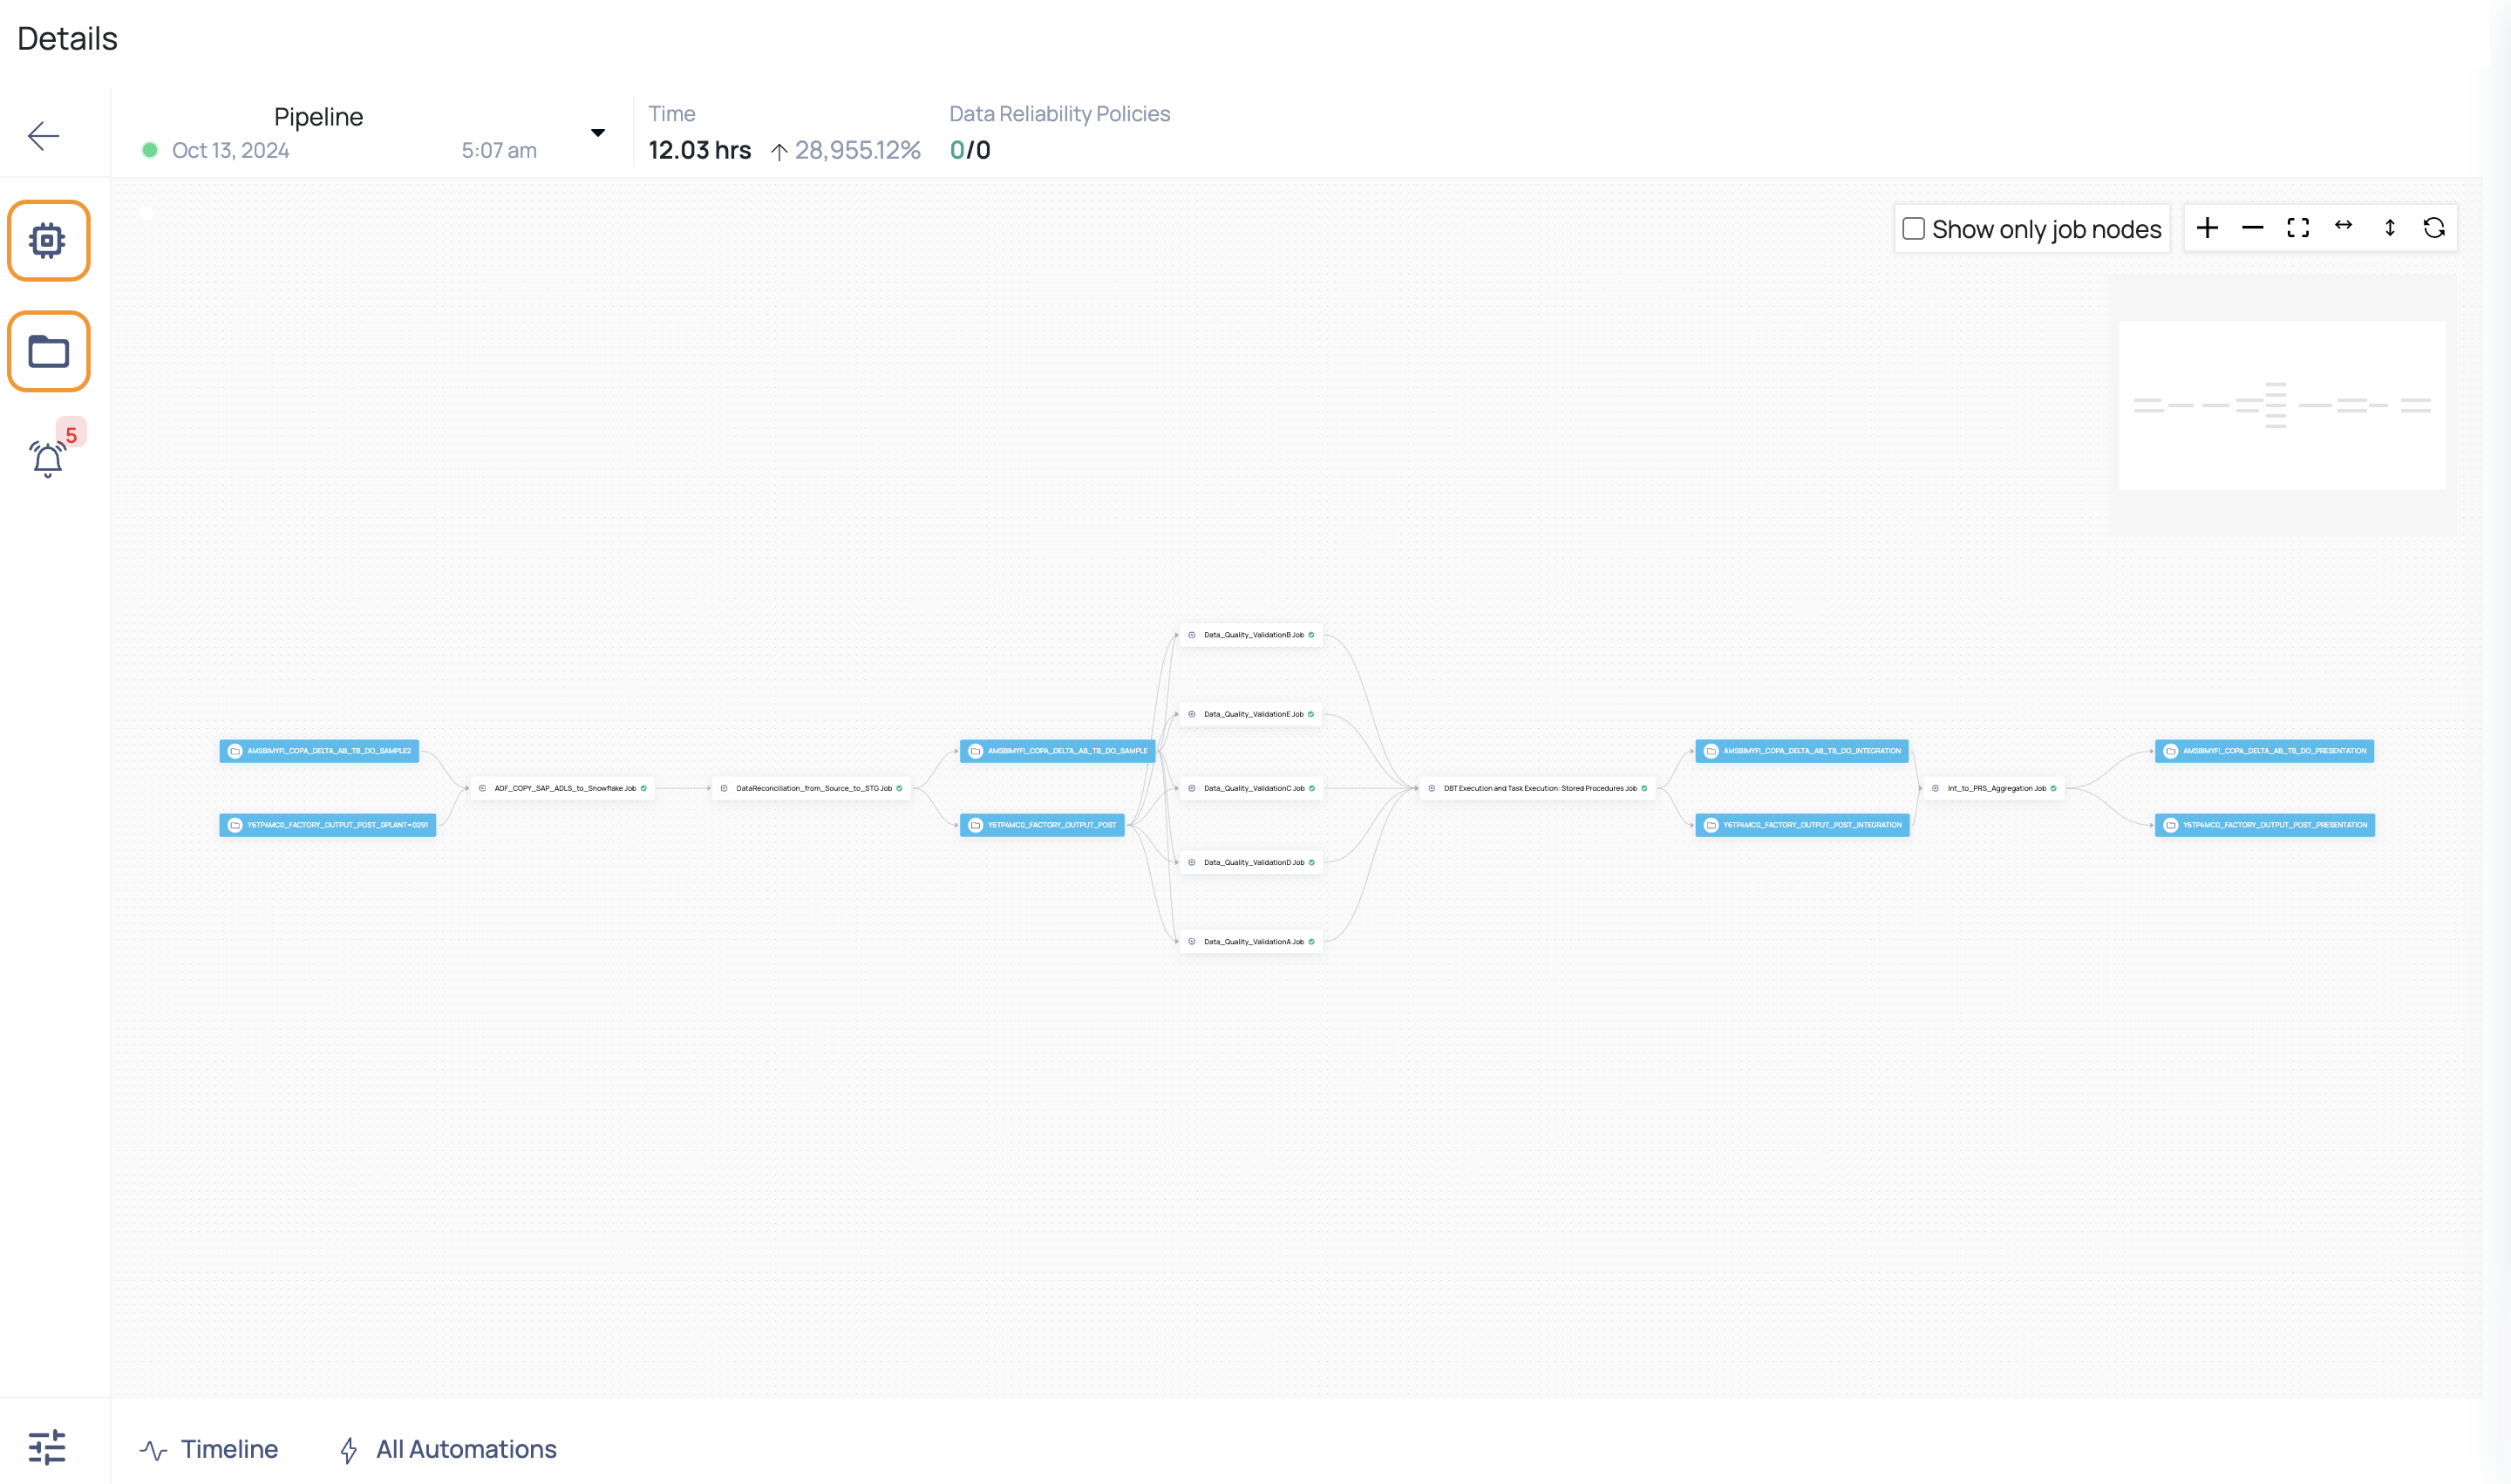
Clicking on any Pipeline Name displays the Pipeline Graph. It displays a graph with various edges and nodes. There are two types of nodes, namely:
| Node | Description |
|---|---|
| Asset Nodes | Asset nodes are Blue in color and they depict an asset. |
| Job Nodes | Job nodes are White in color and depict a function i.e., a process or some tasks. |
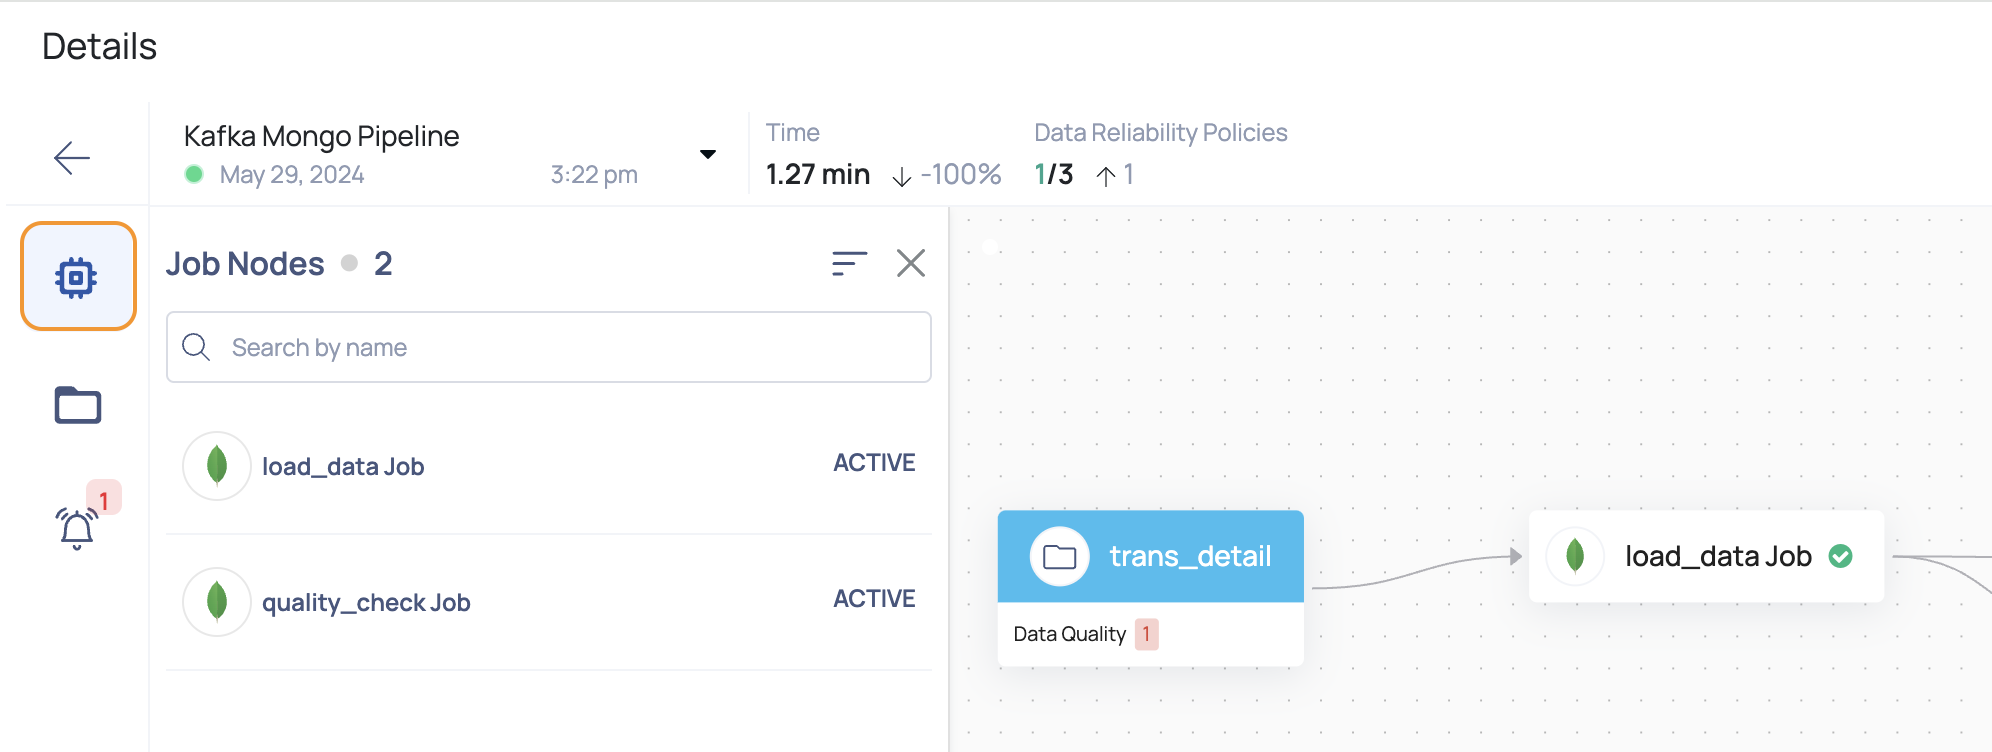
Job Node
The Job node icon can be found in the left pane. This node gives information about all of the jobs in the Pipeline. You can see whether or not a job was successfully done. The execution time can also be viewed.
The jobs can be sorted by Name, Time, or Status. You can also use the search bar to look for a specific job. The data source is represented by the icon before the task node name (Mongo in the following image).
Each job node in the detail view additionally indicates the comparative time spent to run the work. If the most recent execution took longer than its predecessor, a red arrow pointing downwards is displayed.
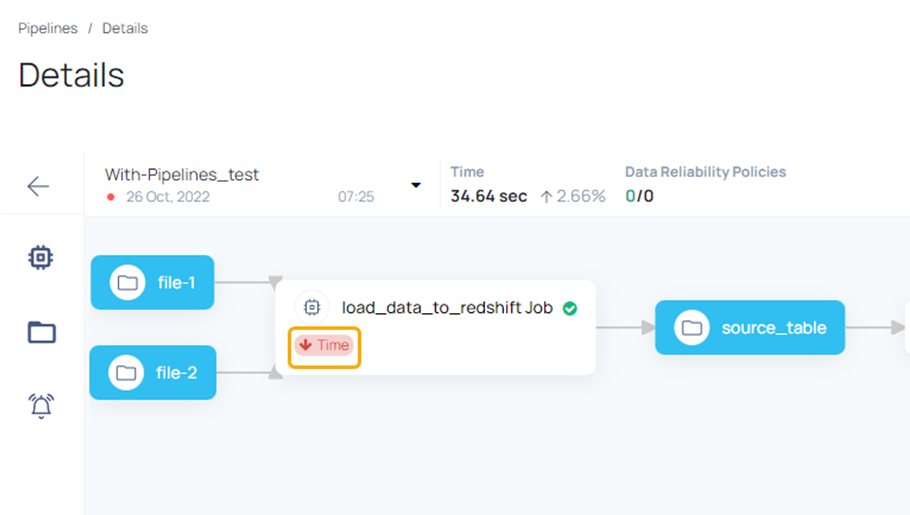
If the current execution takes less time than the previous execution, a green arrow pointing upwards is displayed.
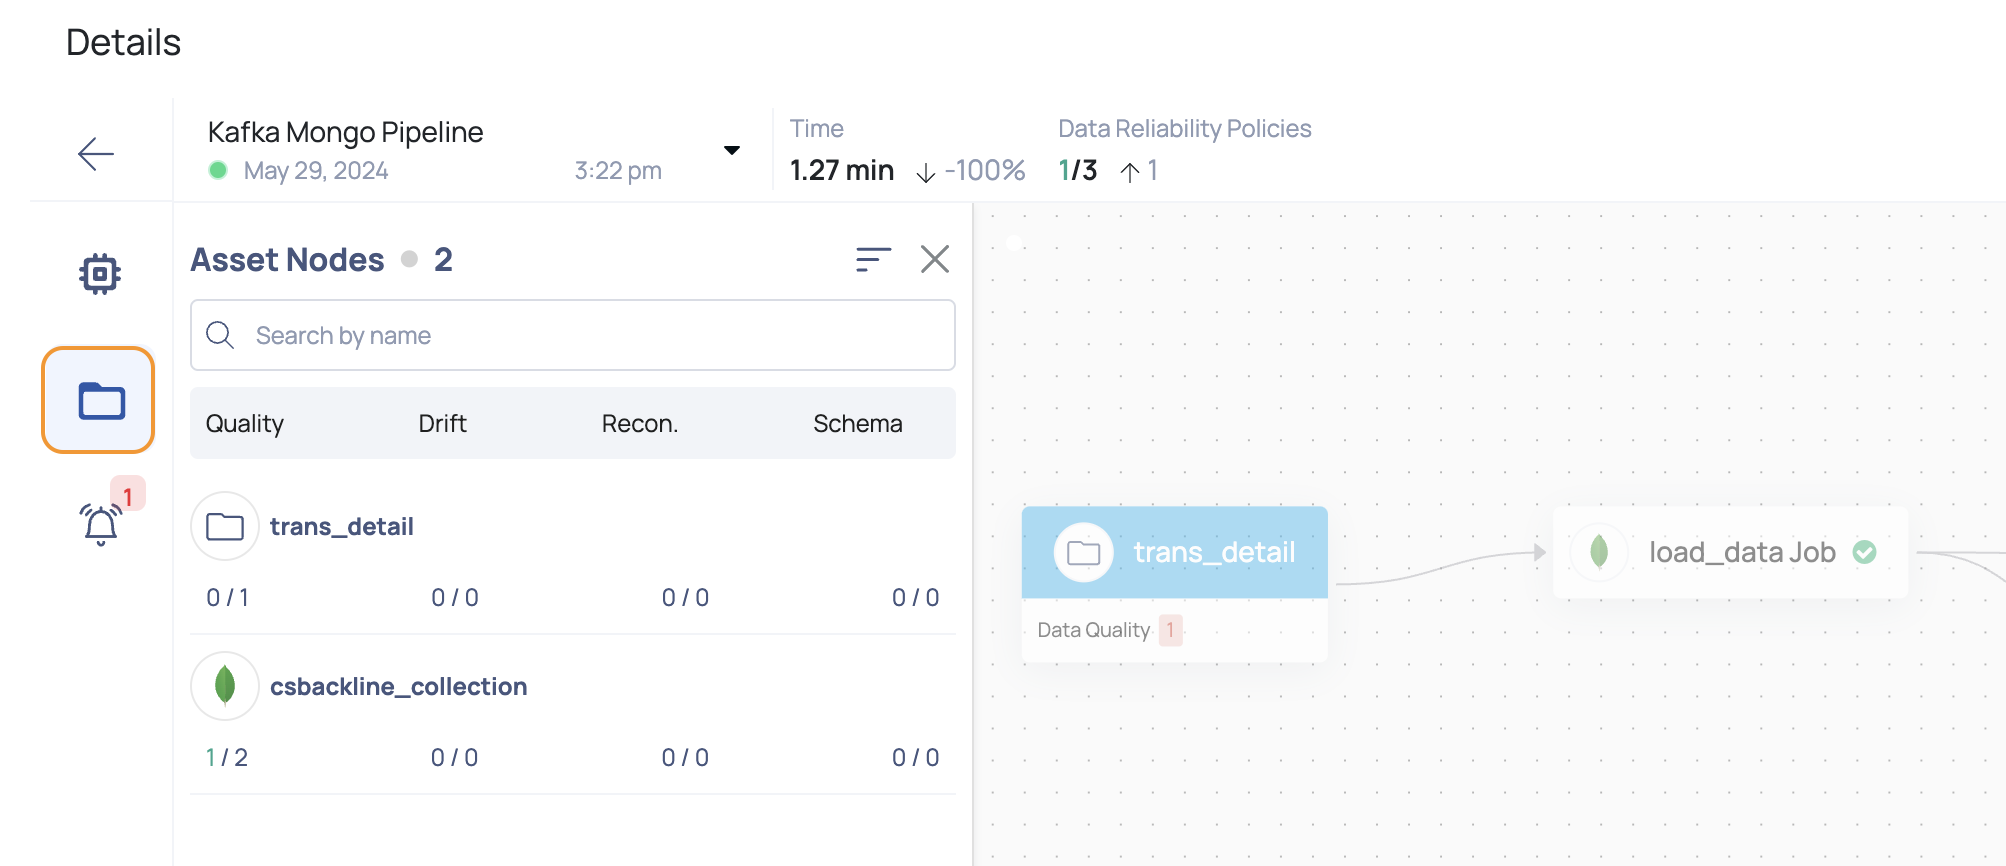
Asset Nodes
The Asset node icon displays the list of all the assets in the Pipeline and the number of policies on each asset.
You can view the number of policies and the number of failed policies for an asset. If you view 0/4 for asset under the data quality tab, it implies that the asset has four data quality policies and none of the four policies executed successfully in their latest run. A score of 1/4 implies that one policy executed successfully out of the four policies.
This is applicable to other types of data policies as well. The icon before the job node name represents data source Example: Snowflake in the following image.
Executed
Data Reliability policies that have been immediately executed within the pipeline. Learn more about instrumenting pipeline code using Data Reliability rules by clicking here.
Related
Data Reliability policies that are related to pipeline assets but are not immediately executed by the pipeline. Policies linked with numerous pipeline runs may execute on a separate timetable than the pipeline. Learn more about how policies are linked to pipelines by clicking here.

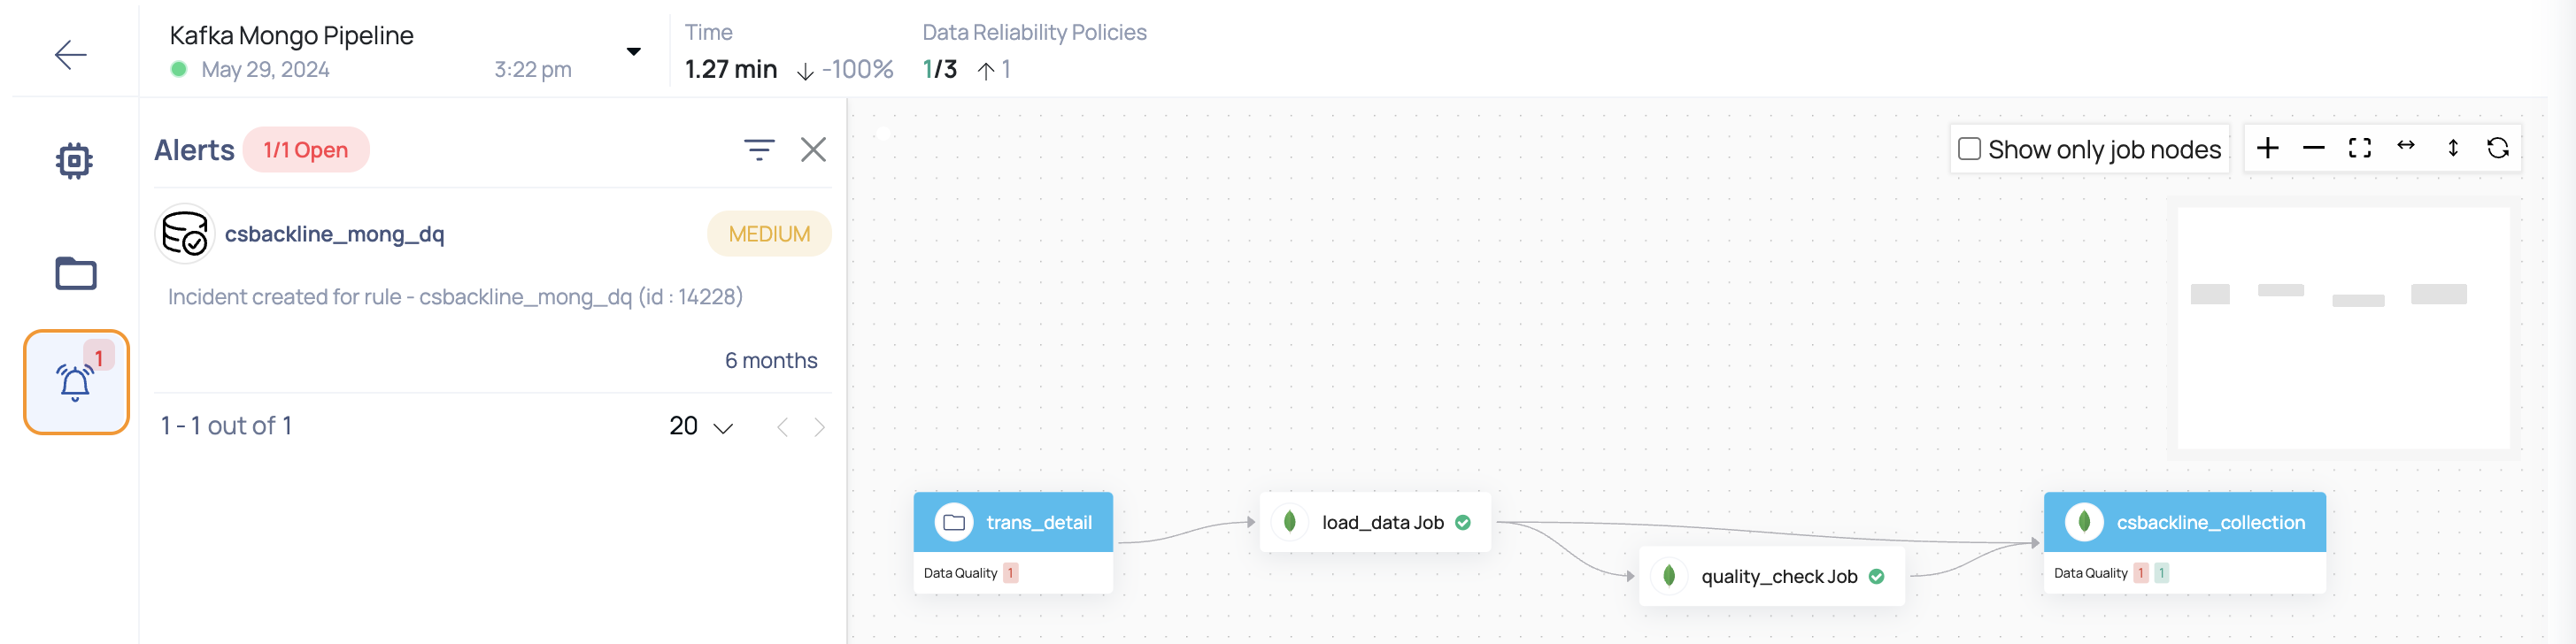
Alerts
This section presents a list of alerts raised on Pipeline, Job, Span, and Event based entities.
It is mandatory for you to configure an alert in order to receive notifications.
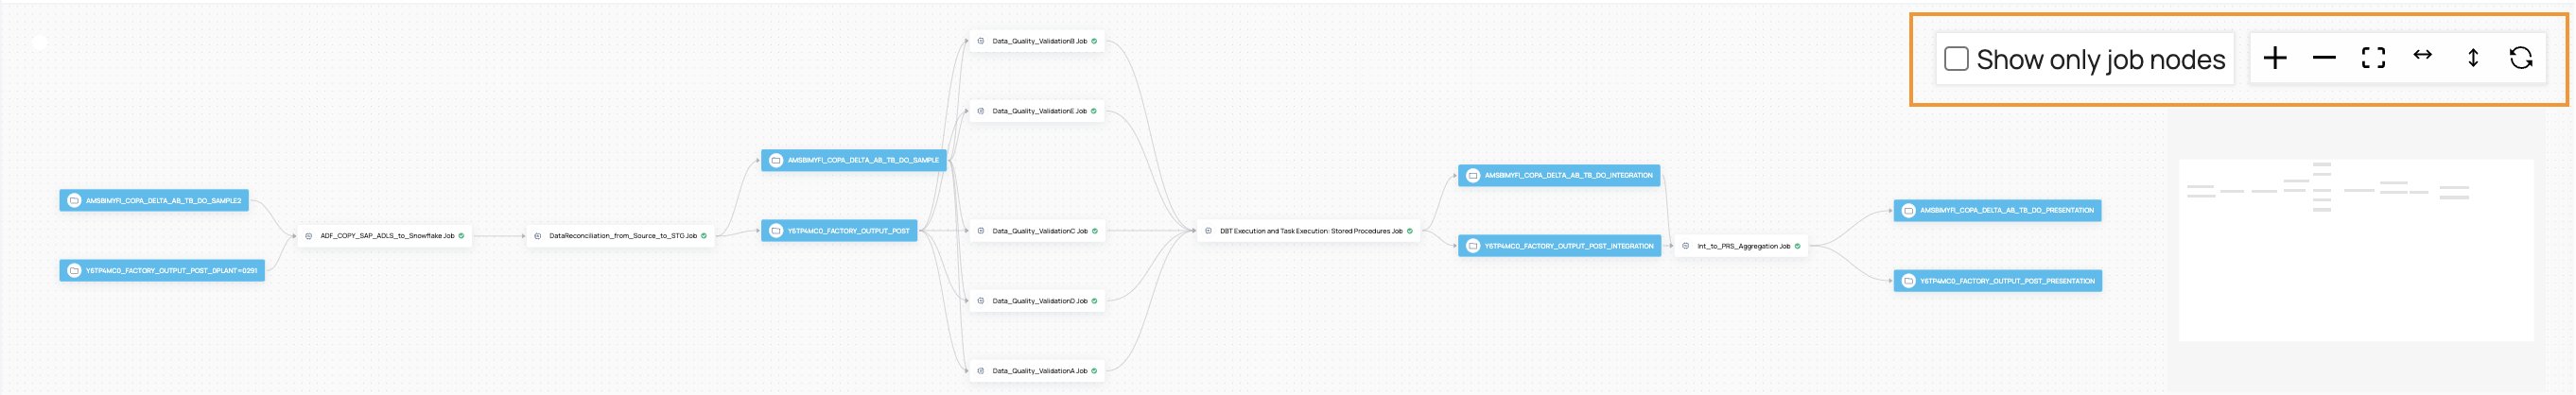
Graph Interactions
The following interactions can be performed on the pipeline graph:
| Interaction | Description |
|---|---|
| Click the checkbox to view only job nodes. | |
| Zoom in to the pipeline graph | |
| Zoom out of the pipeline graph | |
| View the pipeline graph horizontally | |
| View the pipeline graph vertically | |
| Refresh the pipeline graph details page only. |
In summary, the Pipeline Graph is a powerful tool for visualizing and managing your pipeline's components and their execution statuses. By familiarizing yourself with Asset Nodes and Job Nodes, and understanding how policies and alerts function within the graph, you can effectively monitor and optimize your data processes. Leverage the graph interactions to dive deeper into each element, ensuring your pipeline operates smoothly and efficiently.