Dashboard
The Dashboards page allows you to create, customize, and manage your own dashboards to suit your specific needs. You can add and arrange widgets to display relevant information, set personalized dashboards as the default view and create multiple dashboards for different purposes such as Cost Summary or Data Quality. With an intuitive framework for building and managing widgets, you can efficiently tailor your dashboard experience and easily access critical insights.
Create a Dashboard
To create a dashboard, perform the following:
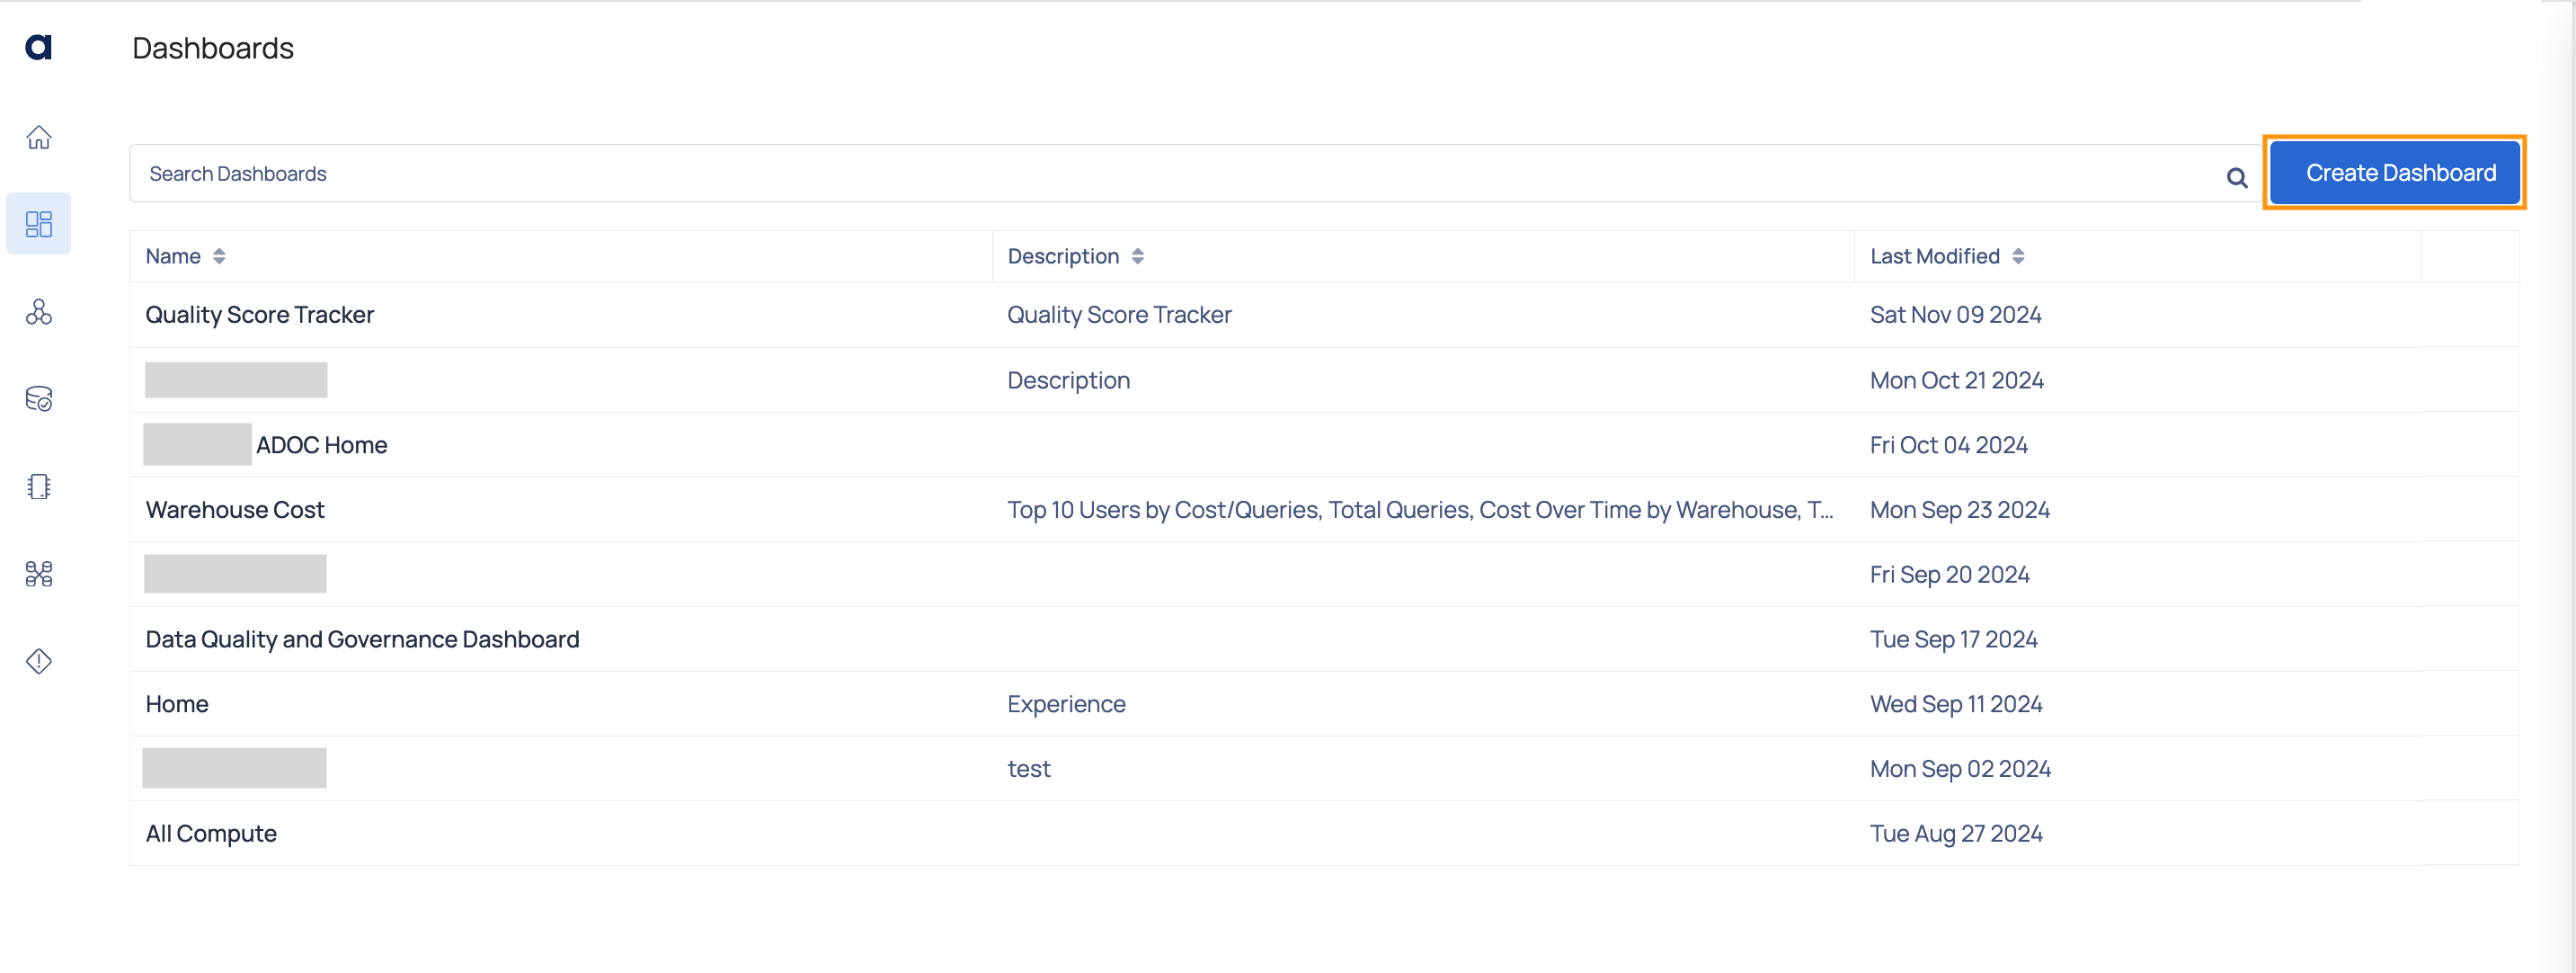
- Navigate to the dashboards page from the left menu.

- Click the Create Dashboard button.
- Add Widgets
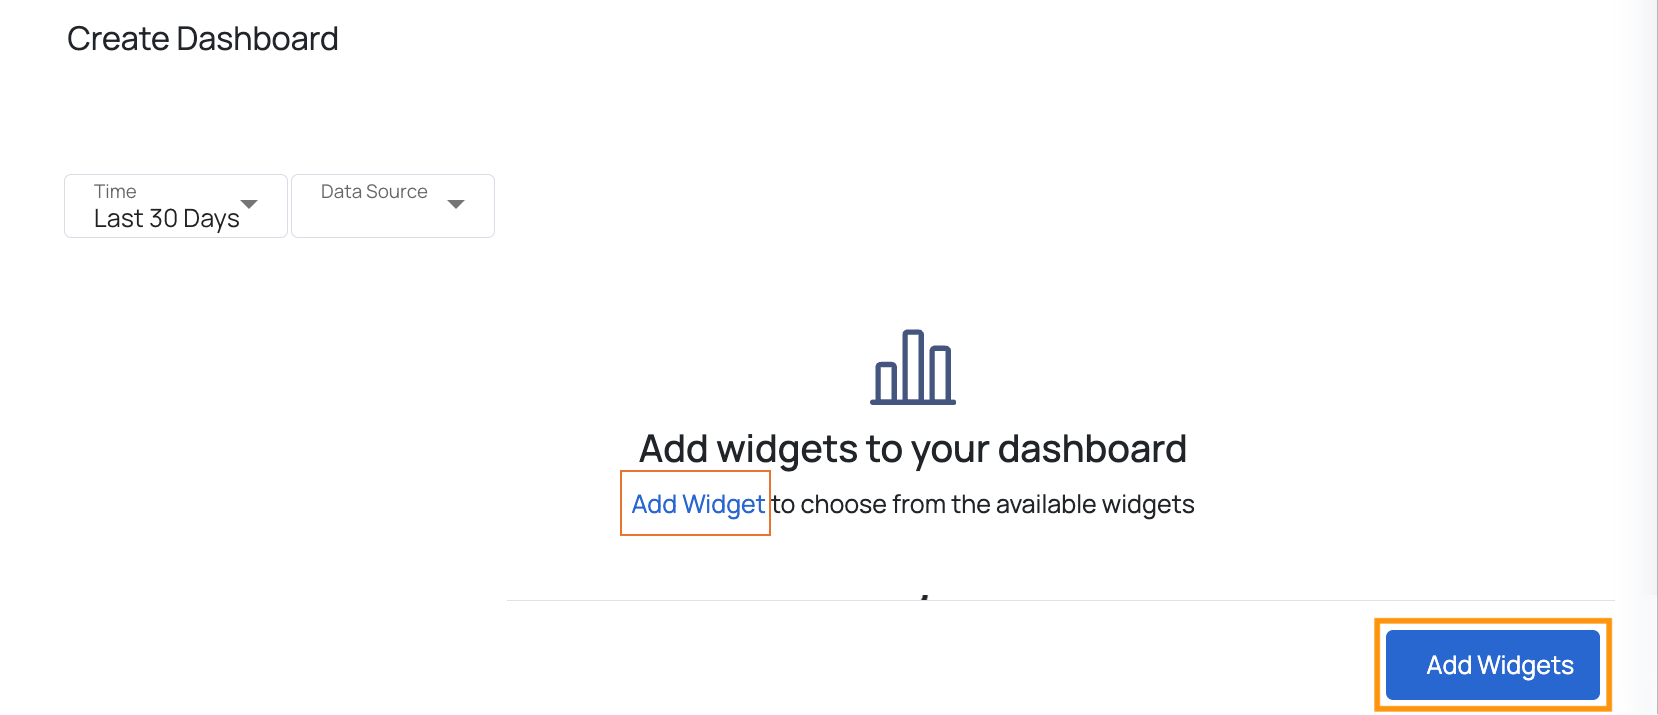
- On the Create Dashboard page, click the Add Widgets button. A pop-up window will appear with widget options
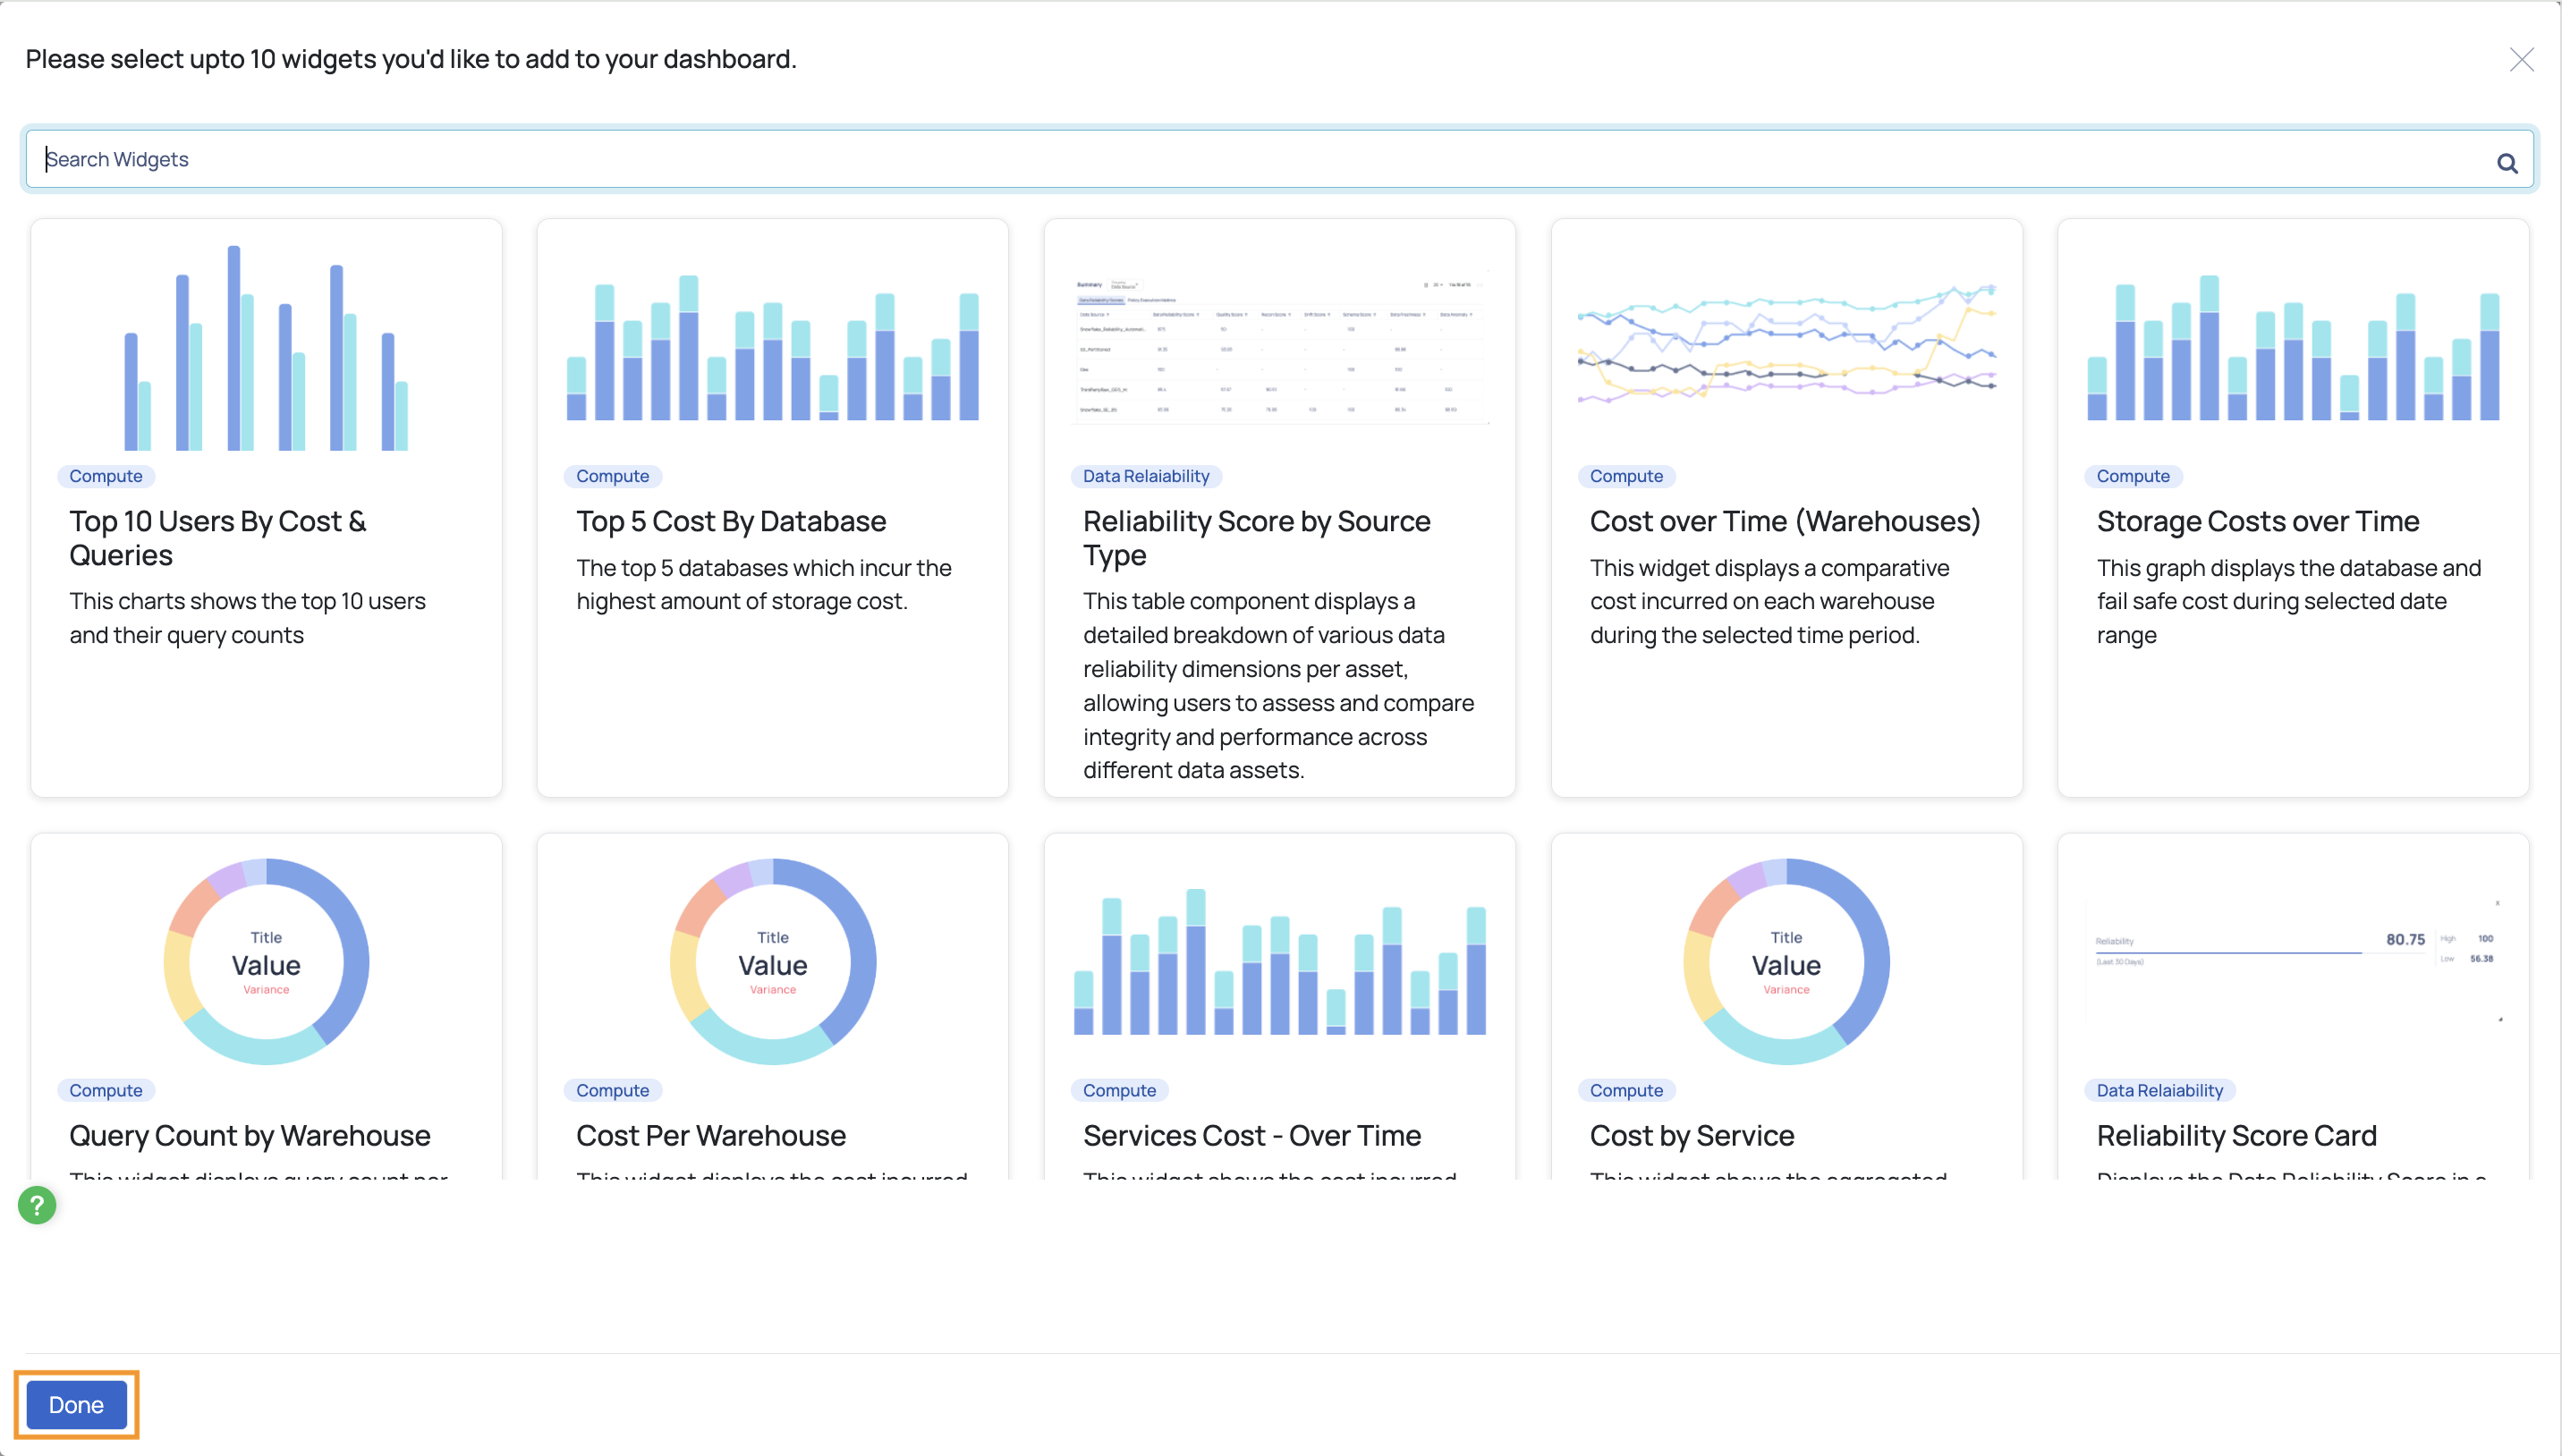
b. Select up to 10 widgets for a specific data source.
c. After selecting the widgets, click Done at the bottom of the pop-up window.
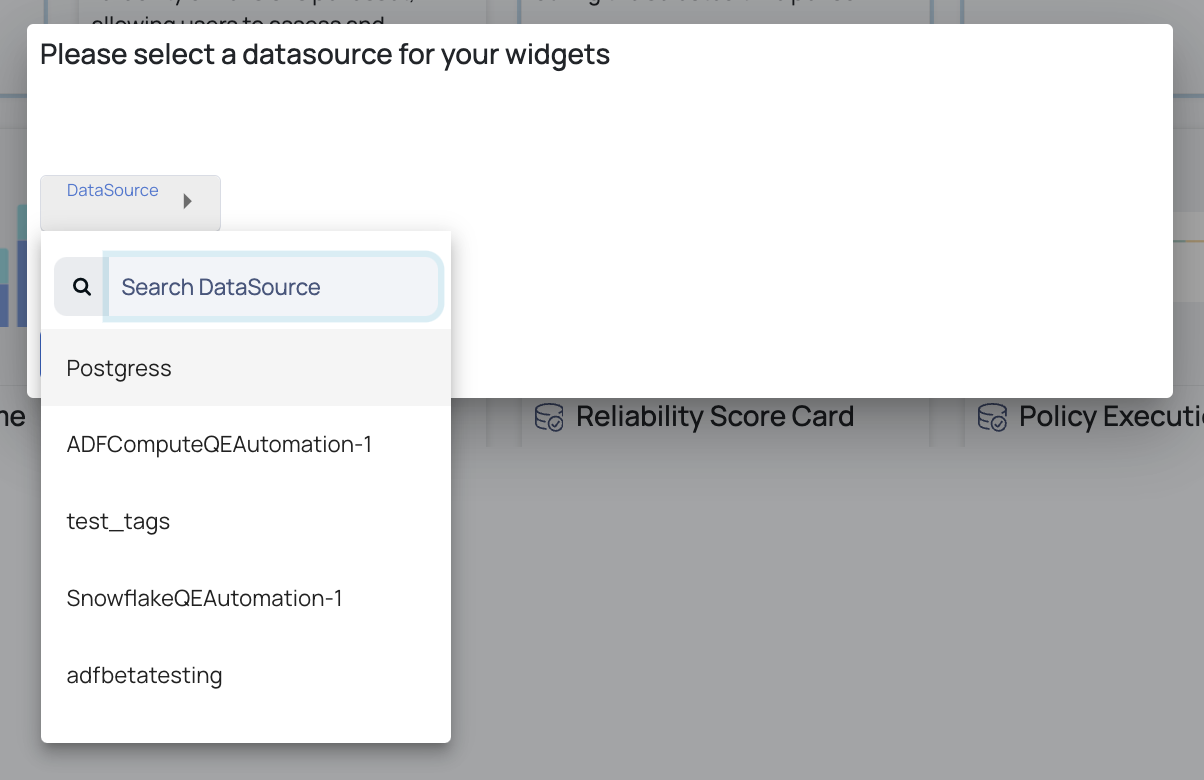
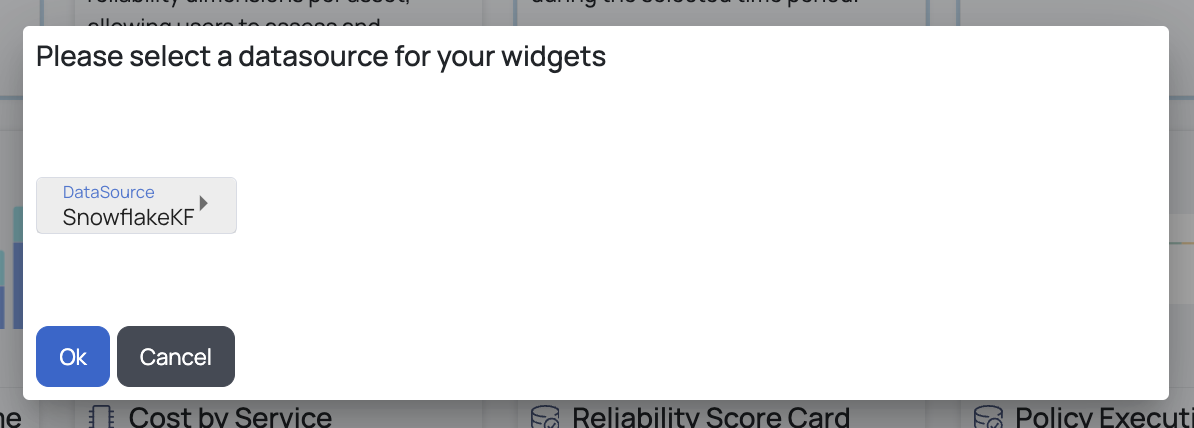
Select Data Source
- Choose a data source for which you want to create the dashboard and add widgets.
- Click OK to confirm.
Customize Your Dashboard
Add More Widgets: Click the Add Widgets button anytime to include additional widgets.
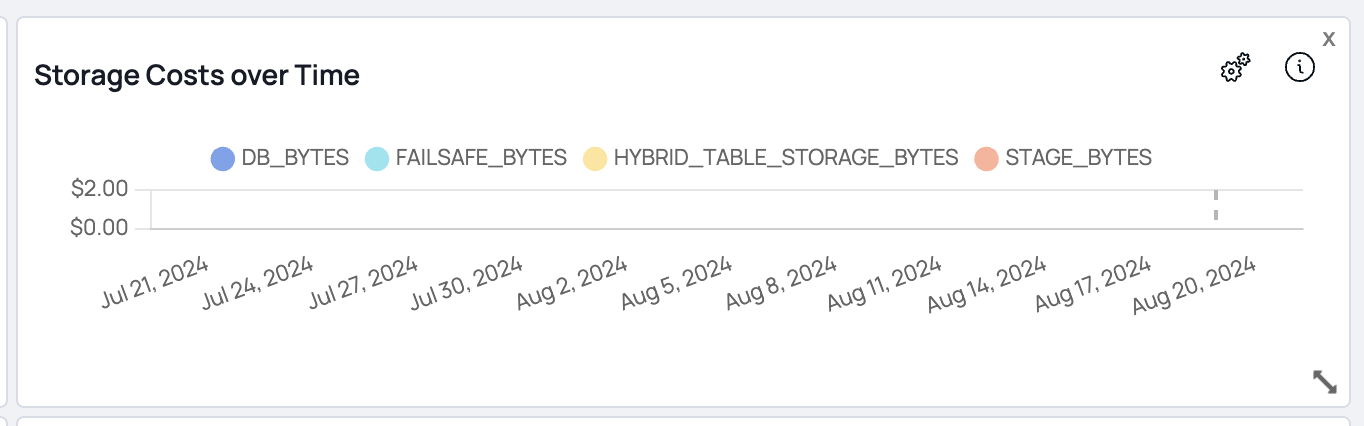
Delete Widgets: Remove a widget by clicking the X icon on it.
Resize Widgets: Adjust the size by dragging the resize icon at the bottom right corner of a widget.
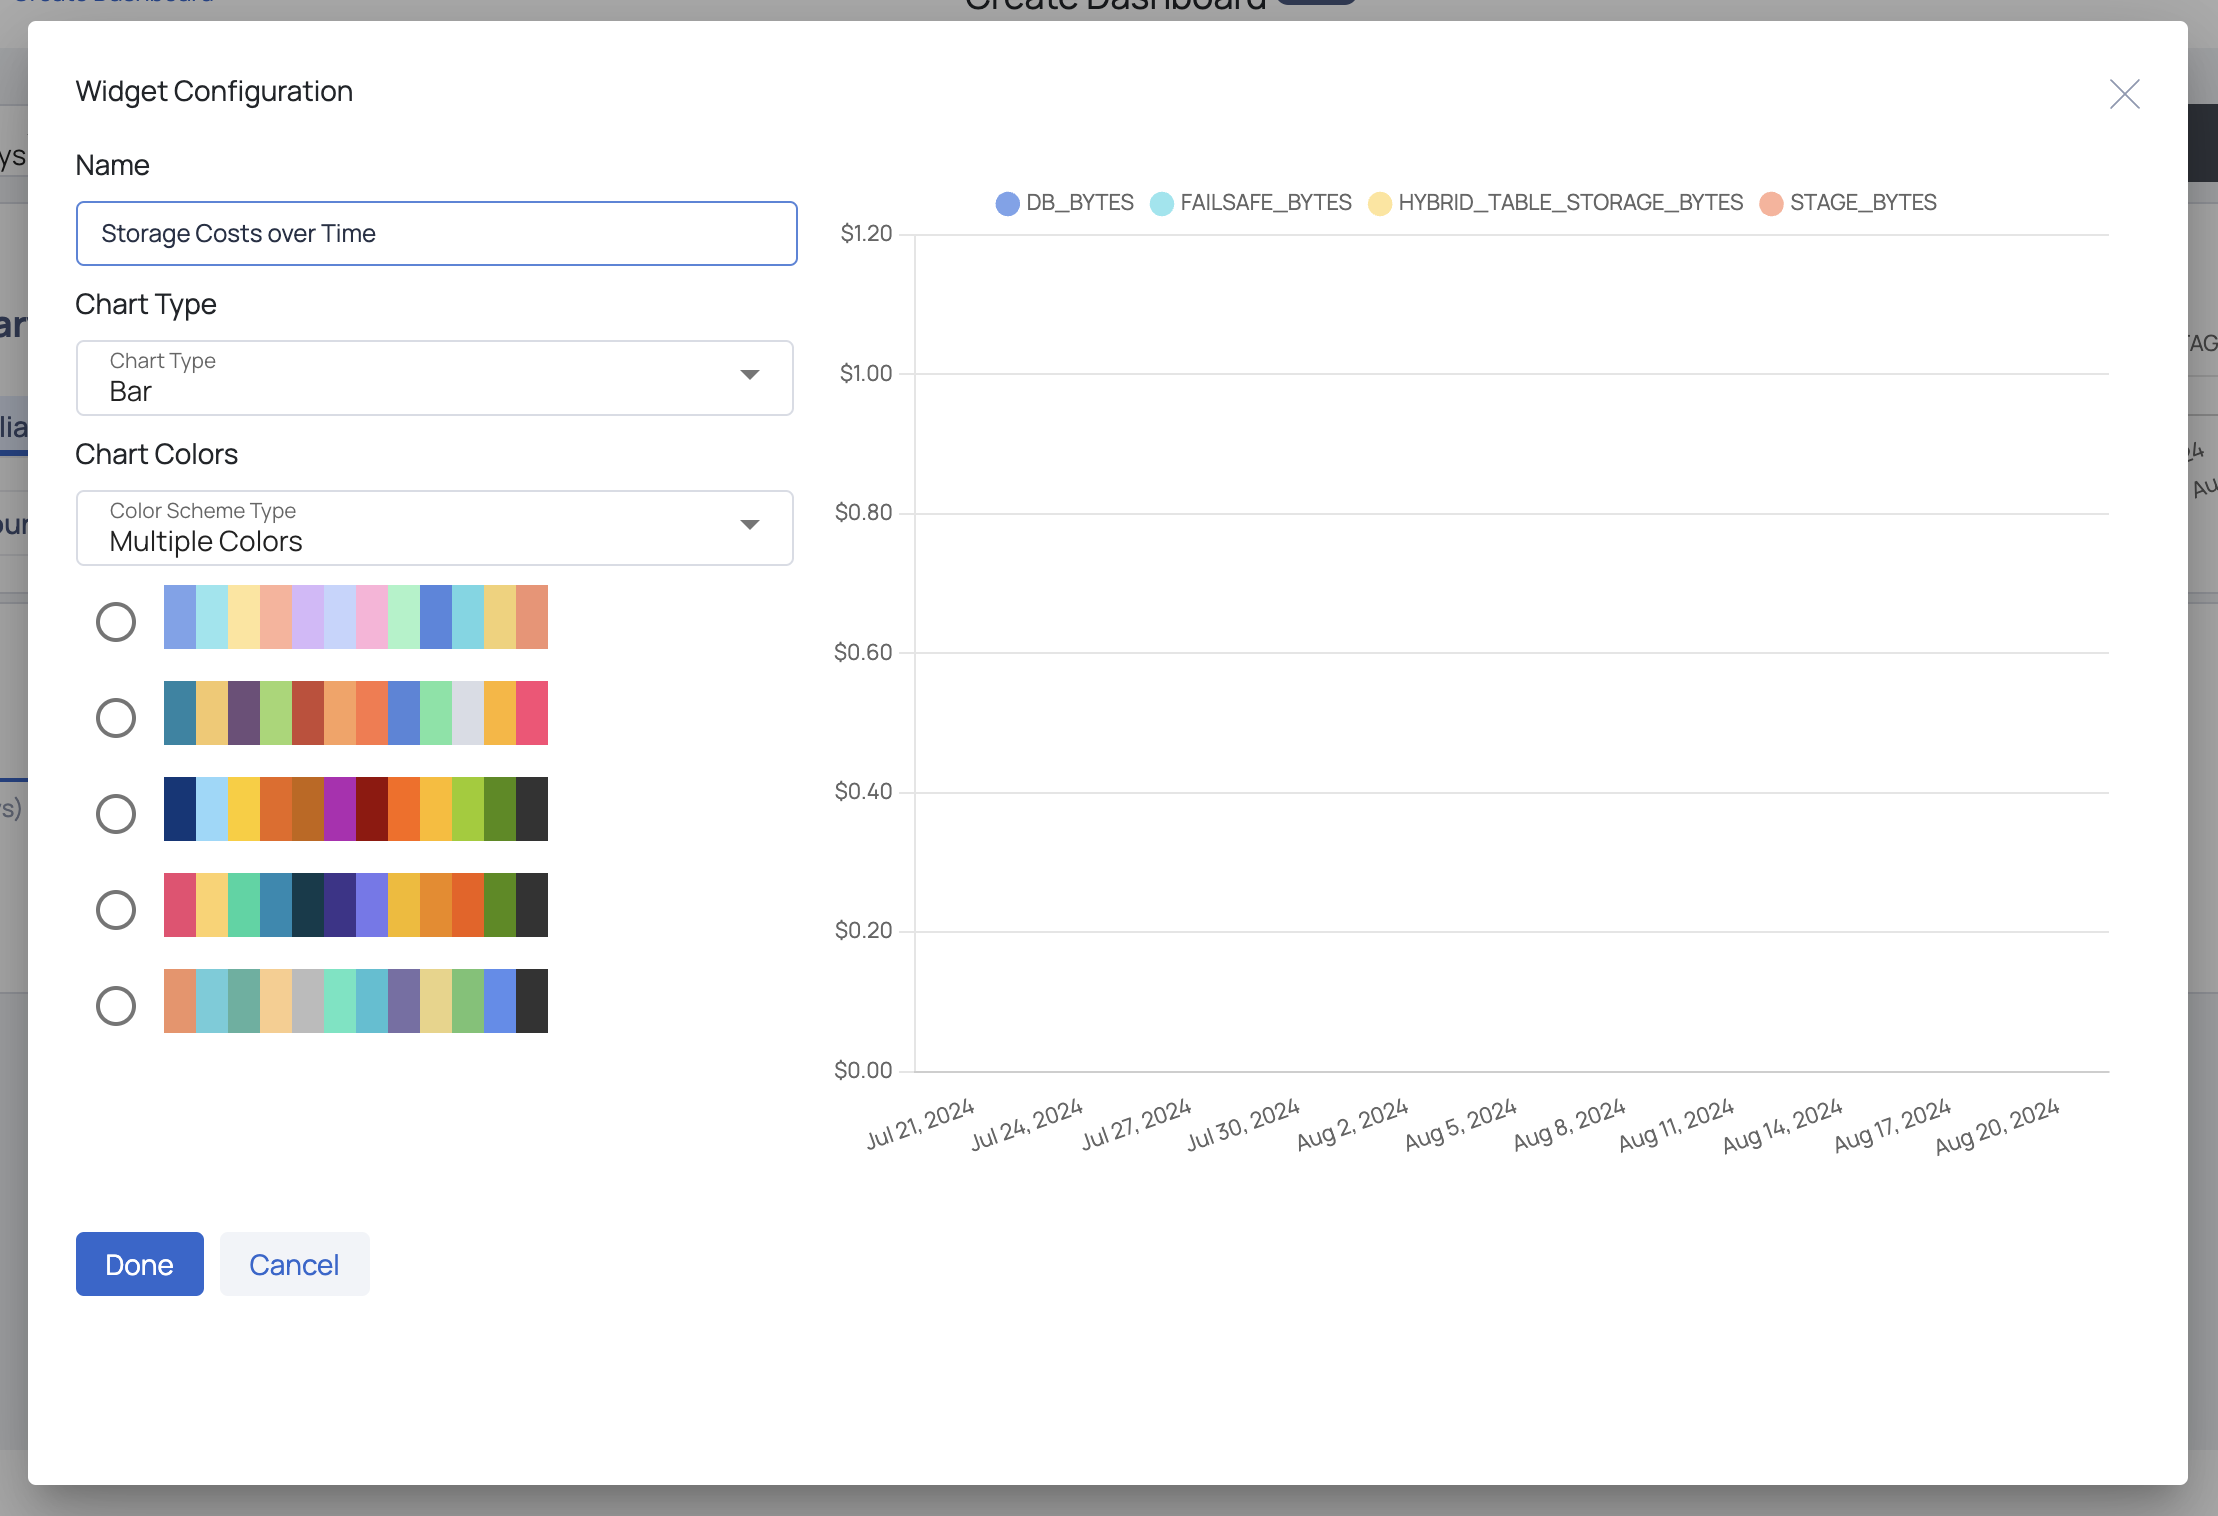
Edit Widget Configuration:
- Click the Settings icon on a widget.
- In the pop-up window, modify the name, c hart type, and c hart colors.
- Preview your changes on the right before clicking Done.
Add Filters: Add and apply filters, such as tag, policy type, and last result status, to Data Reliability widgets when creating a new dashboard.

.
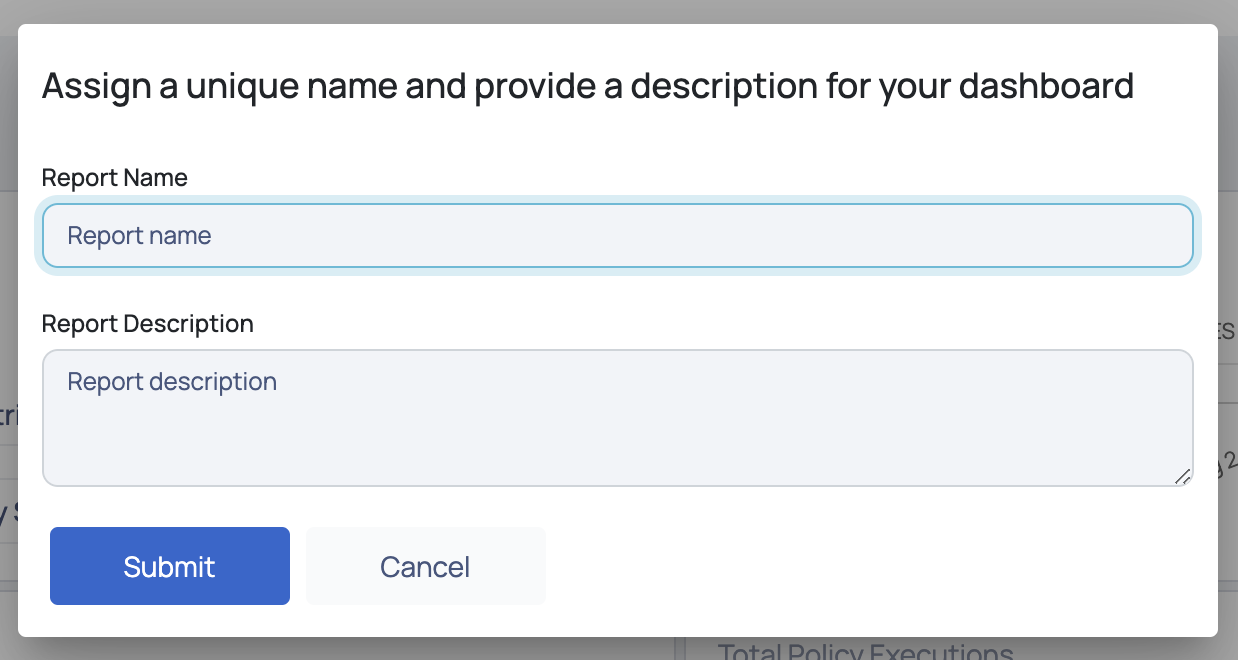
- Save Your Dashboard
- Click the Save button.
- In the pop-up window, enter a unique Report Name and a brief Report Description.
- Click Submit to save your dashboard.
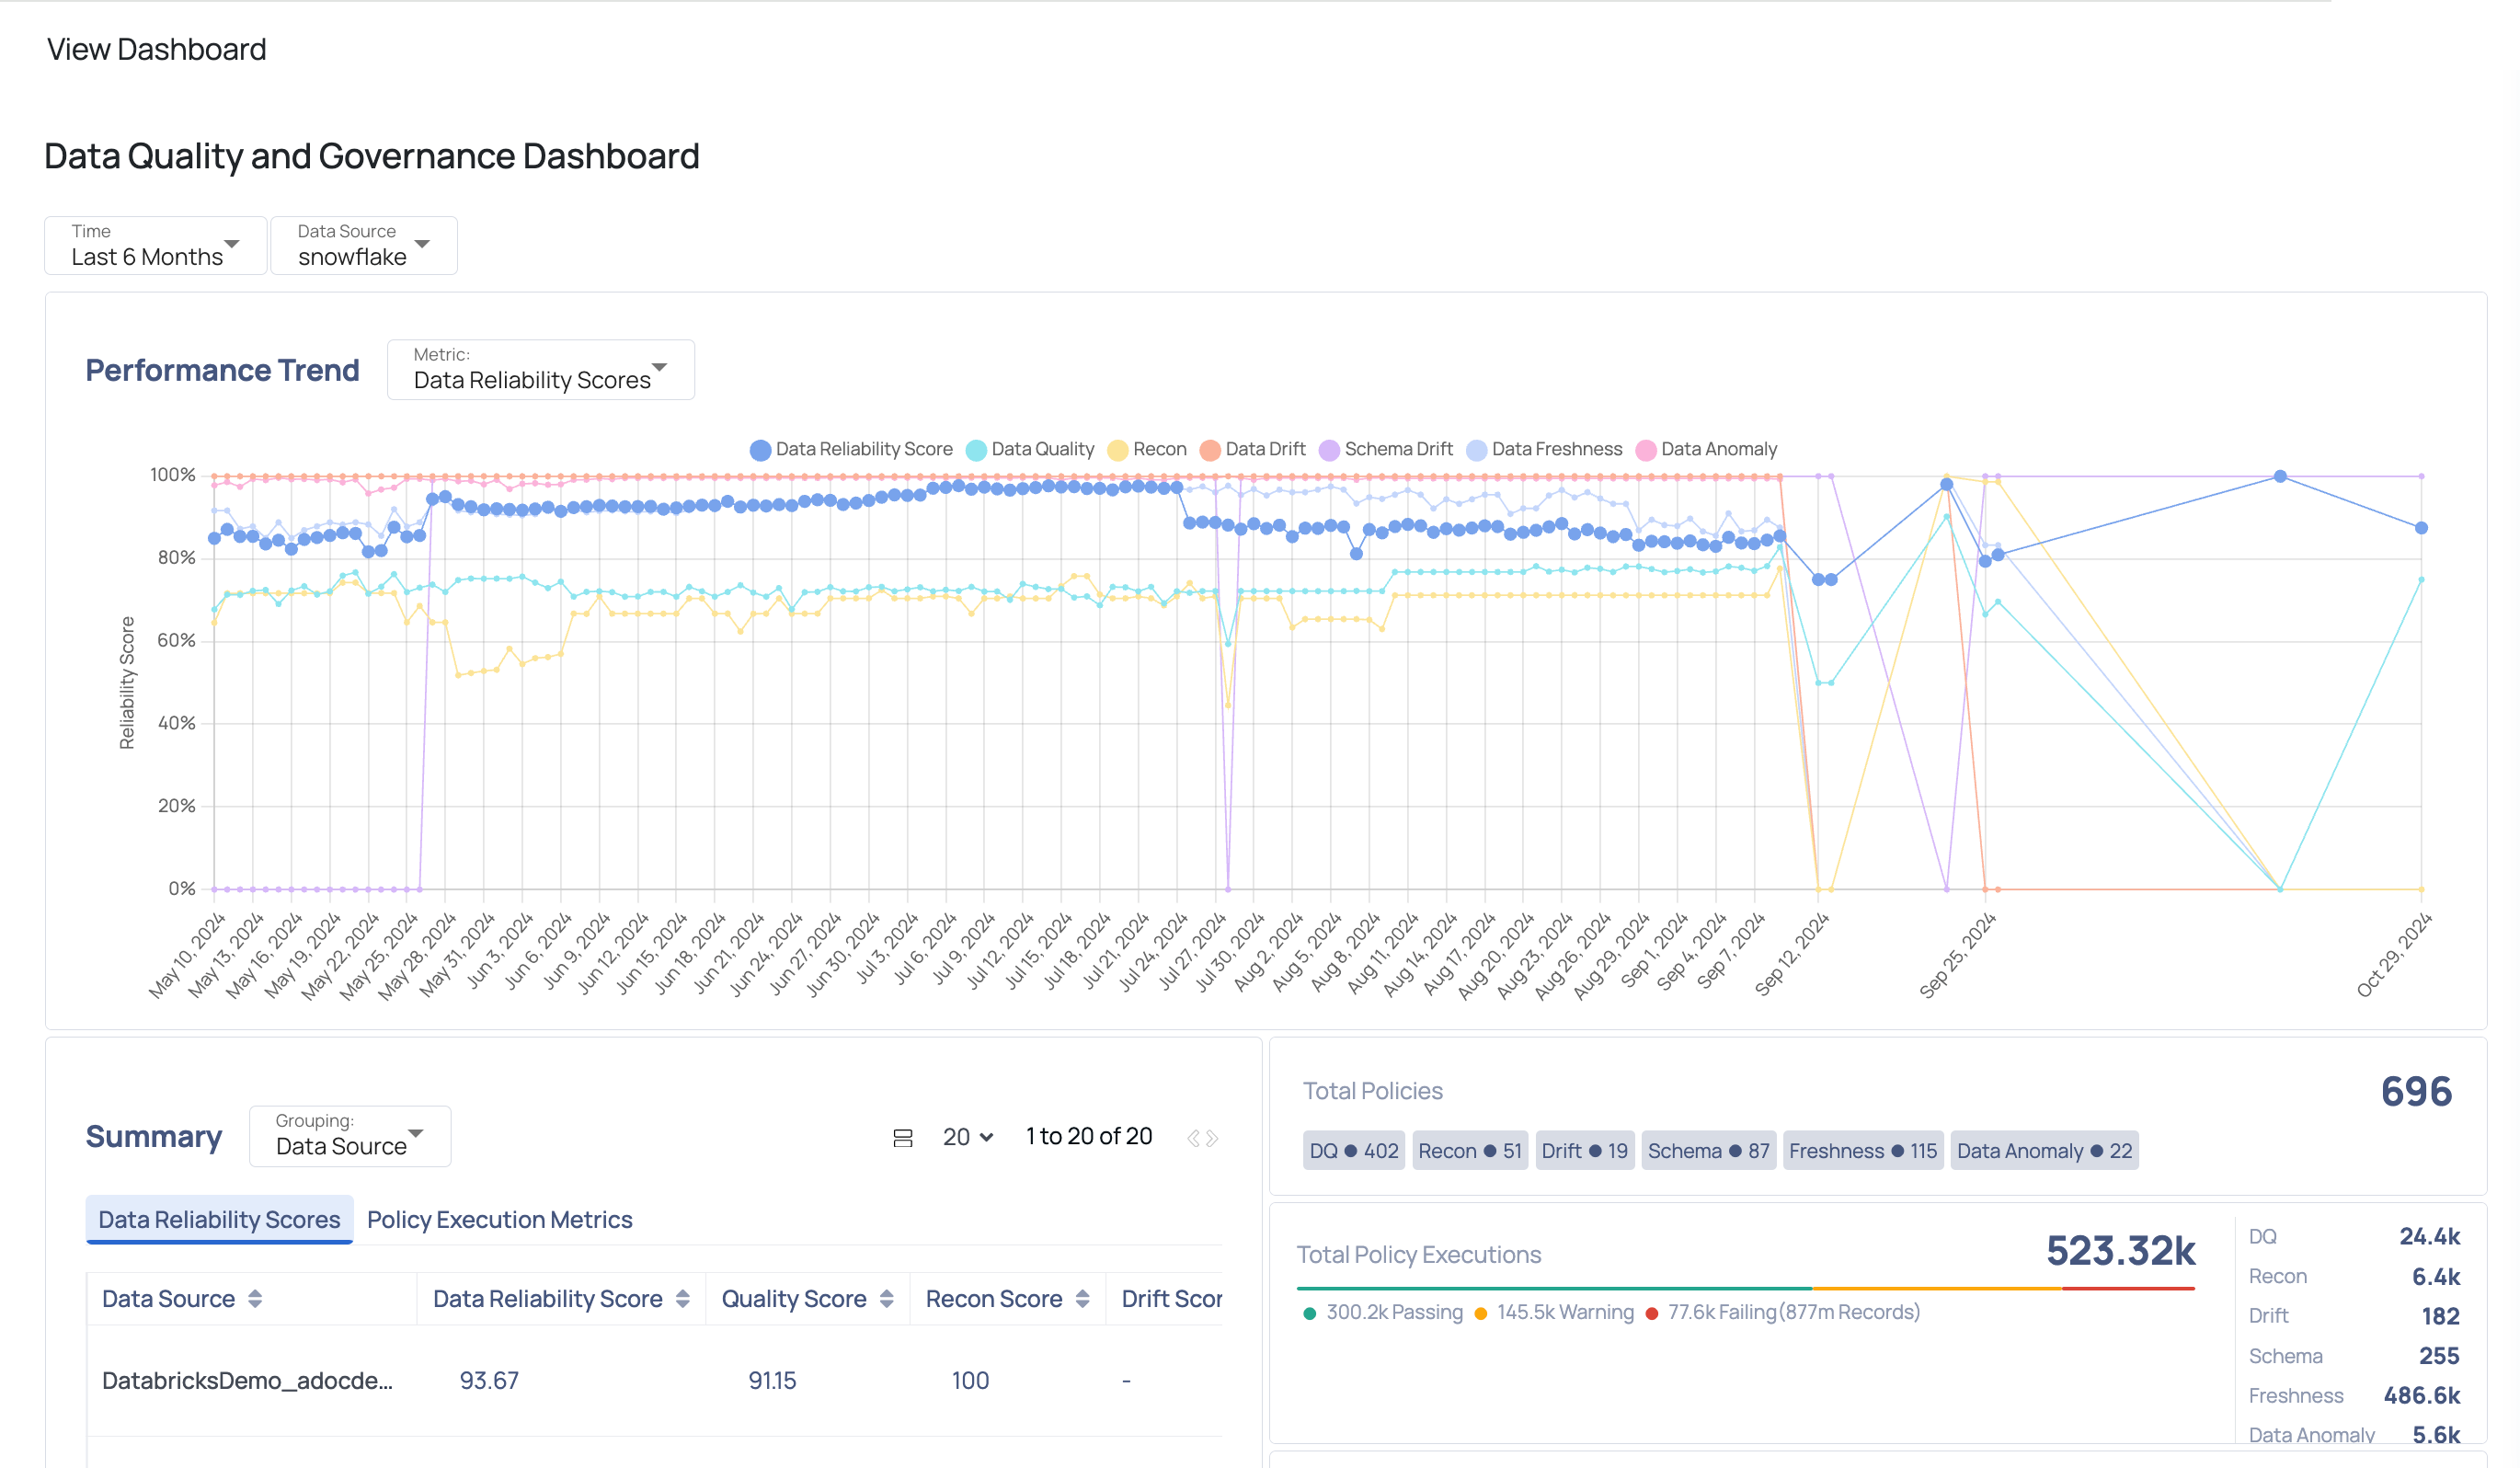
View Dashboard
After saving a report, it will appear on the Dashboards page. Here, you can view all your custom dashboards and use the search bar to find a specific one. Dashboards are listed by name, with their descriptions and the date of the last modification provided.
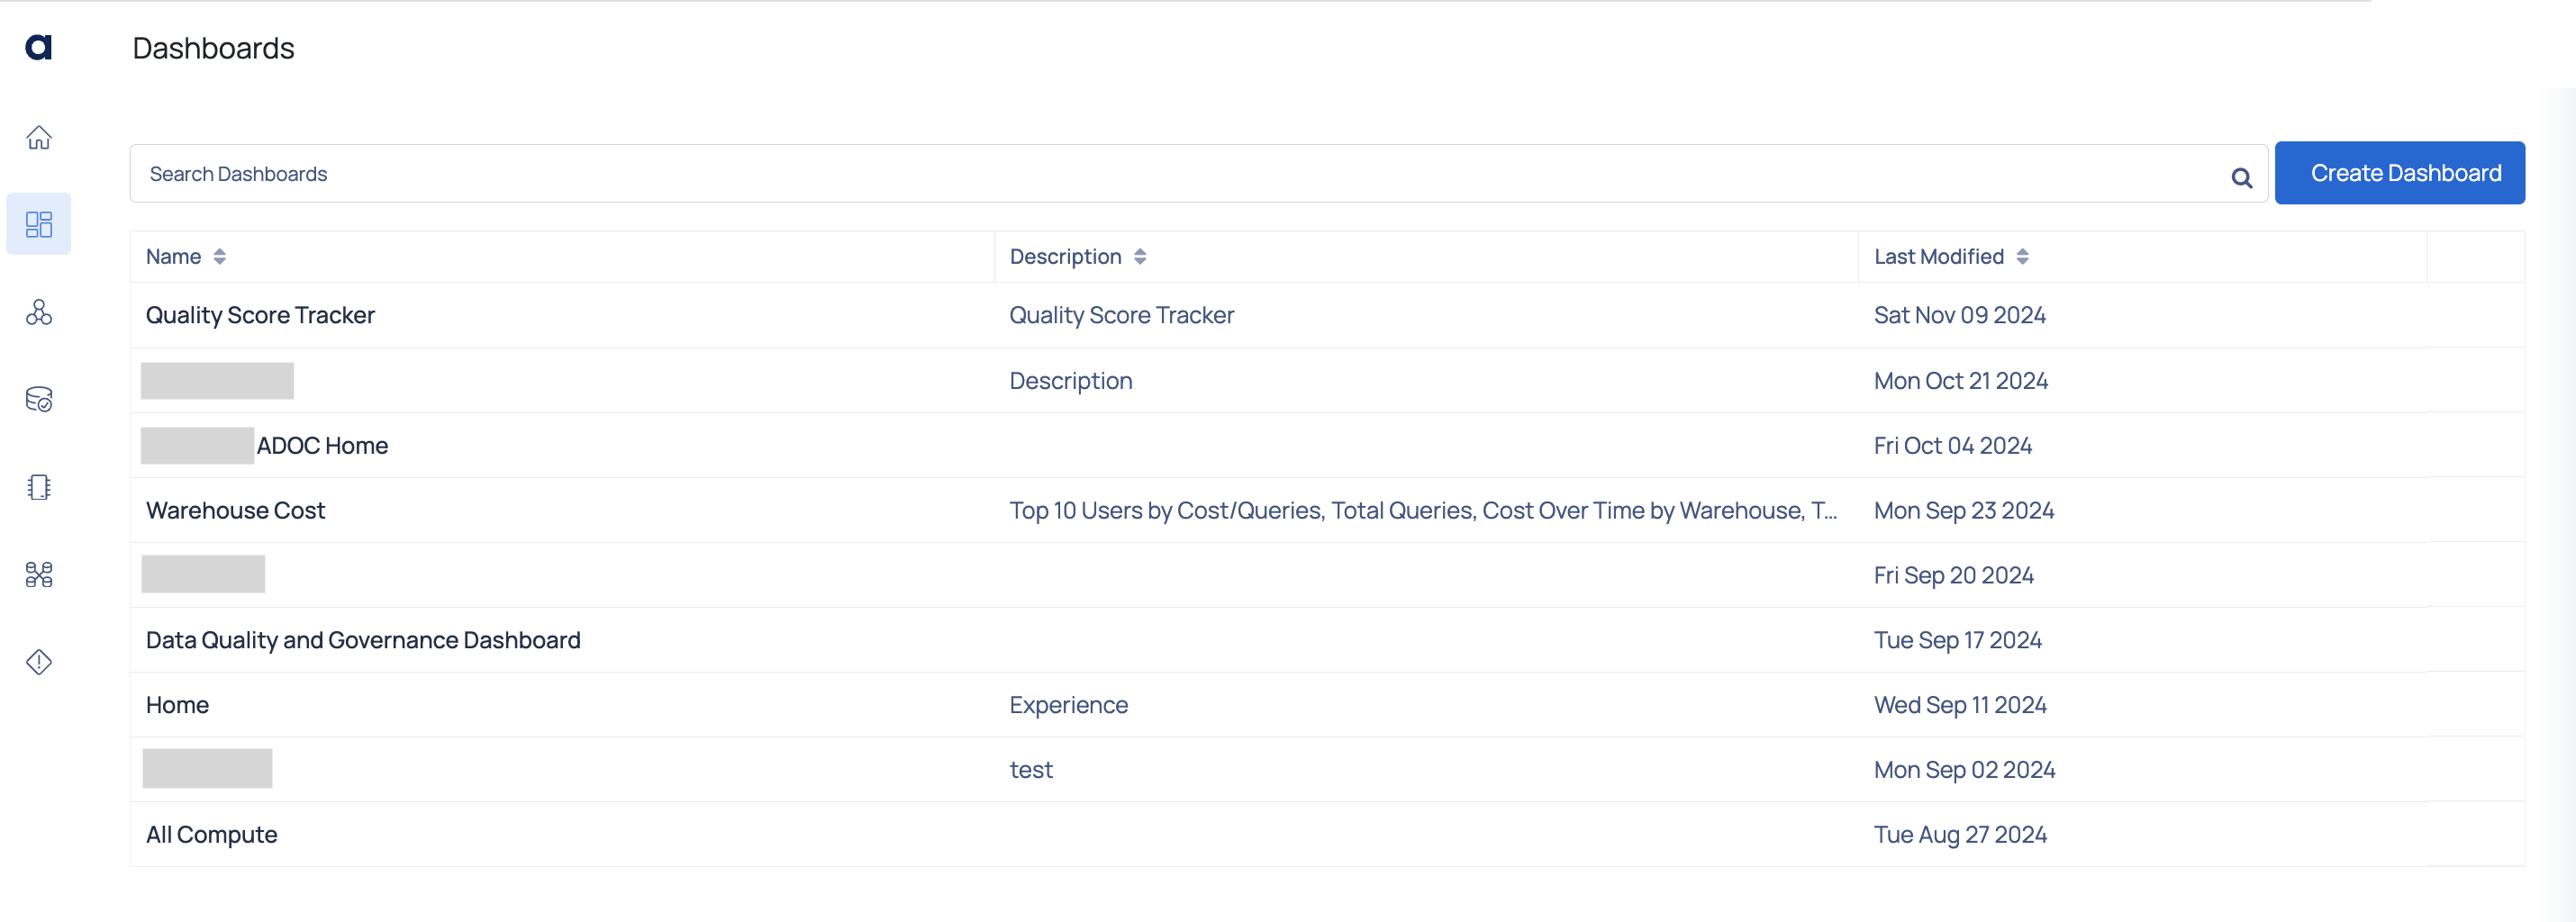
You can access a dashboard by clicking its name, which will take you to the View Dashboard page. Here, you can see all the widgets for that dashboard and filter widget information by Time and Data Source.
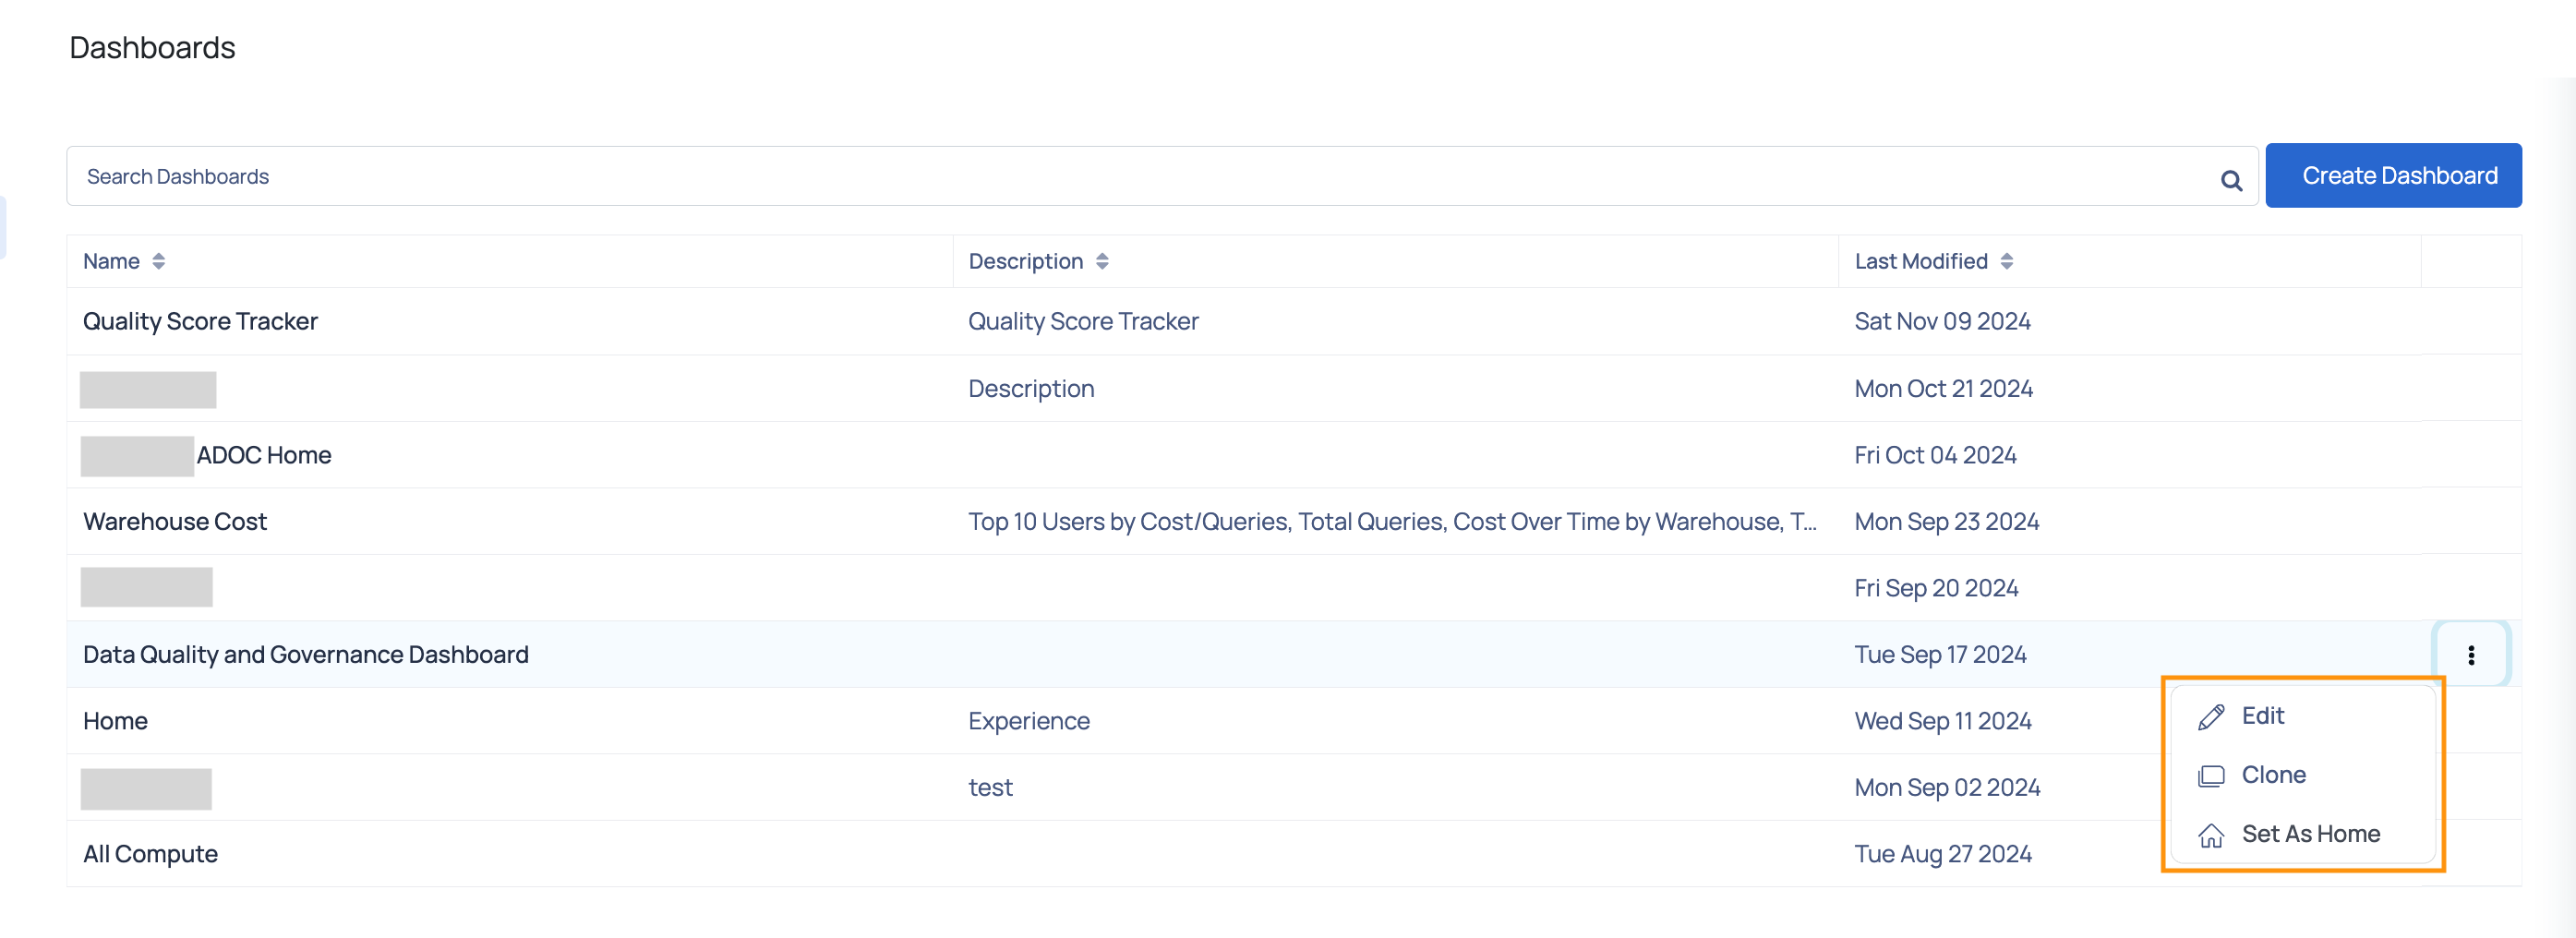
Managing Dashboards
On the Dashboards page, you have several options for managing your dashboards. You can:
- Edit: Modify the dashboard’s widgets, layout, and settings to suit your needs.
- Clone: Create a duplicate of the dashboard. Useful for creating similar views with slight modifications.
- Delete: Remove the dashboard from your list, permanently eliminating it.
- Set As Home: Designate a dashboard as your default view. Provides quick access to your most important data.
Using the Dashboards page customizable capabilities, you may construct bespoke views that are tailored to your individual data monitoring needs. Whether you are looking at cost summaries, data quality, or other essential indicators, the ability to add, arrange, and modify widgets allows you to easily obtain critical insights.
Manage your dashboards with ease—edit, clone, or make them your default view—to ensure you always have the most relevant information at your fingertips. Maximize the value of your data by customizing your dashboard experience to help you make informed decisions quickly and efficiently.