Manage Policies
Policies in Acceldata Data Observability Cloud (ADOC) are used to create rules that ensure data quality and evaluate the health of data sources. Each policy can include multiple rules, and the policy passes if all rules are met. Policies can be executed manually or at scheduled intervals, with the system tracking execution results to monitor success.
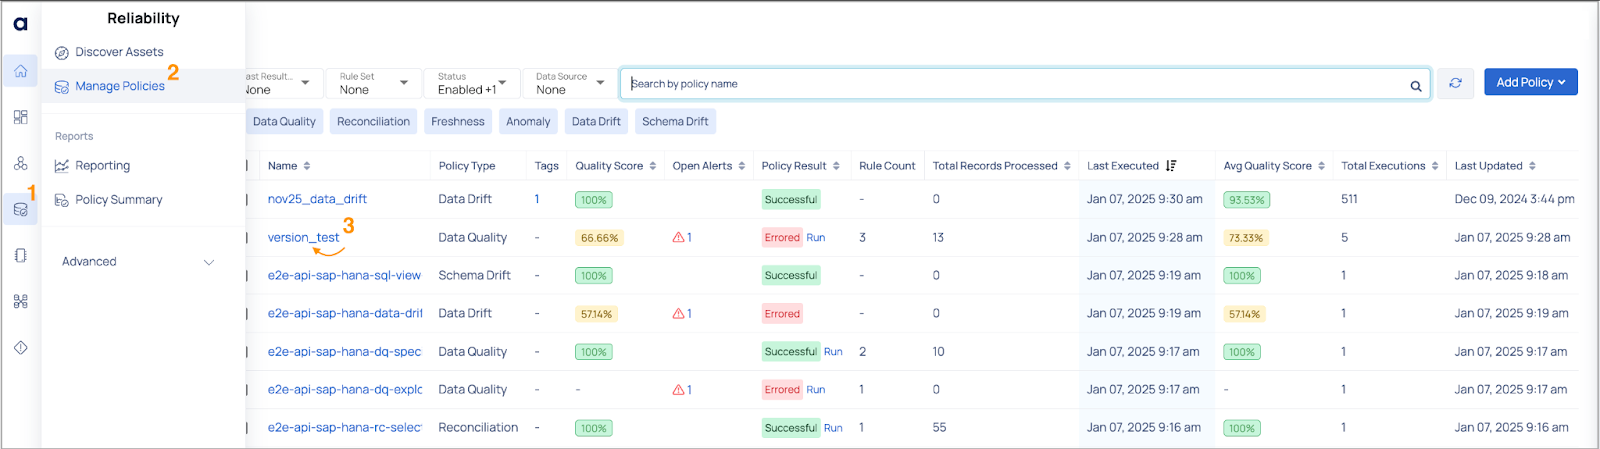
To access the Manage Policies page, navigate to Reliability in the left menu and select Manage Policies. From this page, you can manage policies and perform various actions, including:
- Policies: Viewing and editing policies
- Rules/RuleSets: Managing rules and rule sets
- User Defined Templates: Define user-defined templates.
- Data Policy Templates: Define Data Policy Templates.
- Import Policies: Importing policies
- Policy Groups: Creating policy groups
- Recommendations: Viewing recommendations
Policies
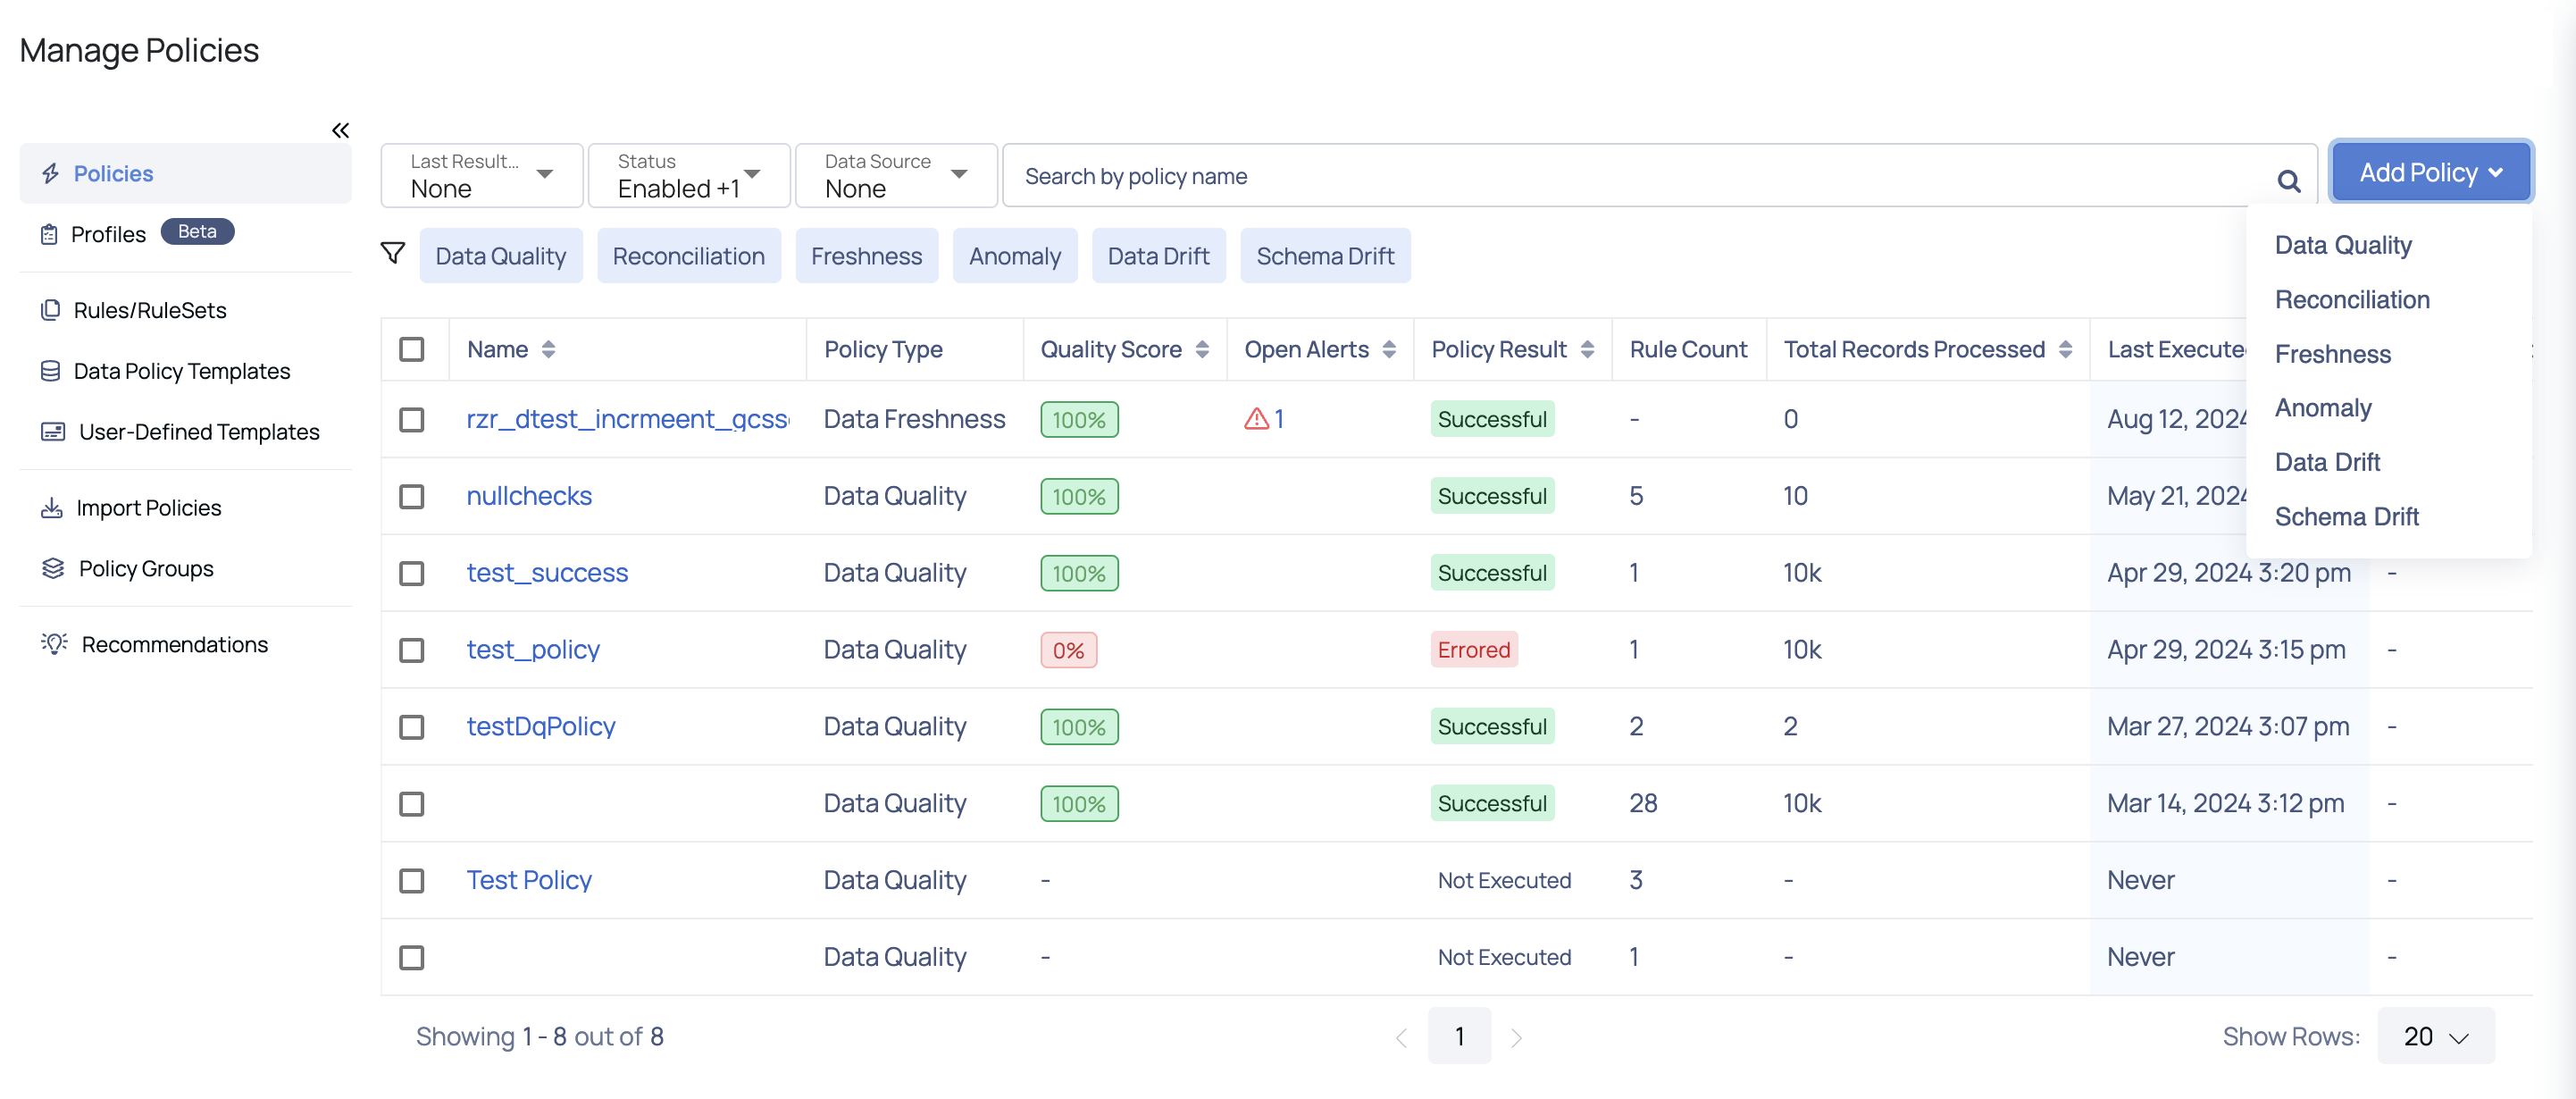
The default view displays a table listing all created policies, along with relevant details.
| Column Name | Description |
|---|---|
| Name | Displays the name assigned to the policy. Clicking on the policy name redirects you to the policy execution details page. |
| Policy Type | Displays the the policy type such as Data Quality, Reconciliation, Data Freshness, Anomaly, Data Drift, and Schema Drift. |
| Quality Score | Represents the percentage of data quality checks that passed successfully for a given policy, providing a quick view of data health and reliability. |
| Open Alerts | Displays the count of open alerts for a policy. Clicking the count redirects you to the Alerts page for detailed information. |
| Policy Result | Shows the execution status of a policy, such as Successful, Errored, or Not Executed. Click the Run link beside it to select the type of execution (All Your Data, Incremental, or Selective) and click the Execute button to execute the policy. |
| Rule Count | Displays the count of rules included in a policy. |
| Total Records Processed | Displays the total number of records processed during the policy's execution. |
| Last Executed | Displays the date and time when the policy was most recently run. |
| Average Quality Score | Displays the average quality score of the policy based on all executions of that policy. |
| Total Executions | Displays the total number of times a policy was executed. |
| Last Updated | Displays the date and time when the policy was most recently edited. |
| Sub Policies | Displays names of policies attached to a policy group. |
The policies table can be filtered using the following options:
- Last Result Status: Filter policies based on execution outcomes like Success, Error, Running, Aborted, or Warning.
- Status: Filter by policy states such as Enabled, Disabled, Active, or Archived.
- Data Source: Select specific data sources to view policies applied to them in the table.
- Search Policy: Search for a policy by its name.
- Policy Type: Filter policies by clicking on types displayed near the
filter icon, such as Data Quality, Reconciliation, Freshness, Anomaly, Data Drift, or Schema Drift.
ADOC supports the following types of Data Reliability policies to maintain data quality and schema stability. The Actions button allows you to create these policies:
Data Quality Policy
Data quality measures data source health from consumer or business perspectives. ADOC's quality policy ensures data quality for single assets by checking properties like Null Values, Asset Data Type, and Regex Match.
Create Data Quality Policy
To create a Data Quality policy, click the Actions button and select Data Quality. From the modal, select the asset to which you want to apply the policy to and click Next. The Create Data Quality Policy page is displayed. Complete the following steps on the Create Data Quality Policy Page:
- Navigate to Reliability > Manage Policies page.
- Click the Add Policy drop-down button and select Data Quality.
- Select an asset to apply the policy to and click Next. The Create Data Quality Policy page is displayed.
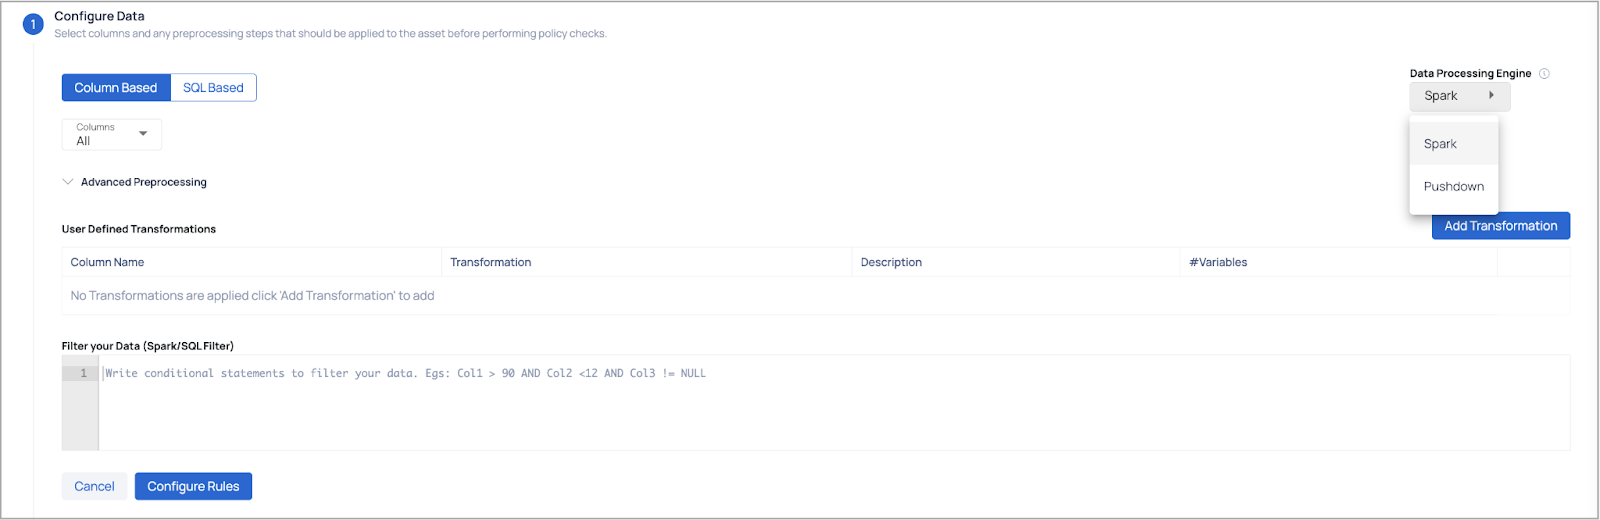
- Configure Data: Users can select data using two methods. Users can choose either Spark or Pushdown as the data processing engine; however, by default, the engine configured during the data source integration is selected. On selecting Pushdown engine, the Persistence of Records and Spark Job Resource Configurations are disabled.
- Column Based (Option 1): Select specific columns for processing or transformation.
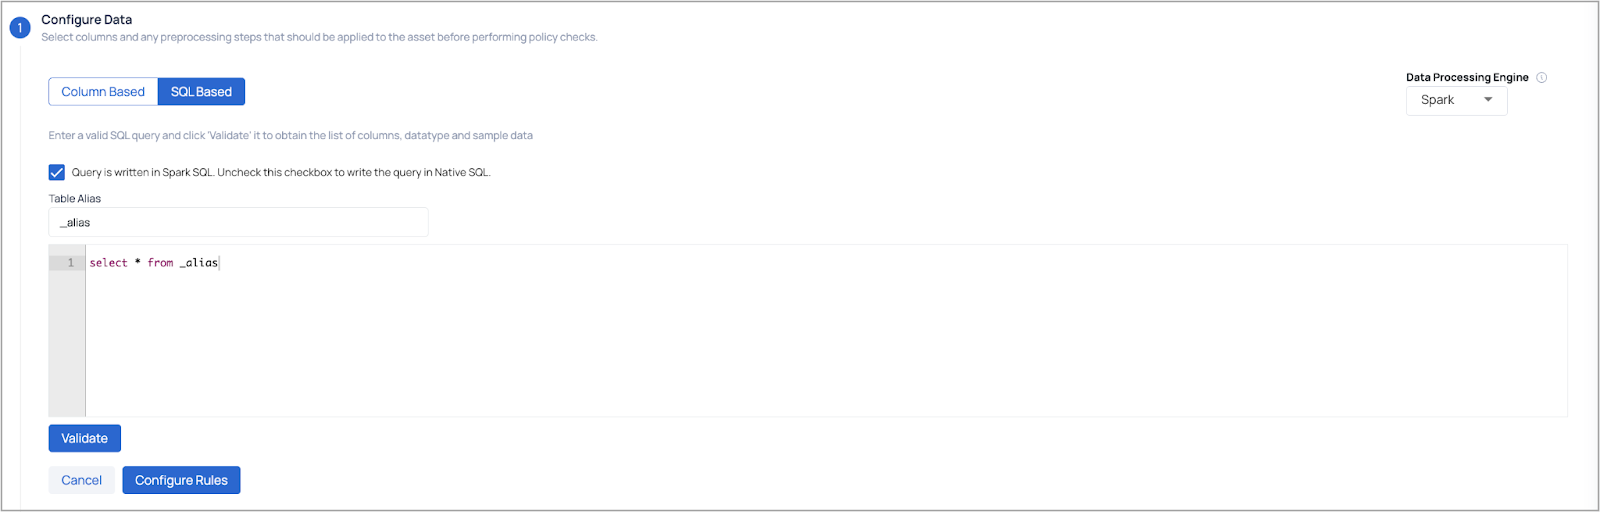
- SQL Based (Option 2): Write custom SQL queries for column selection and ensure to validate the SQL query and then select the columns and required segments on which you want to apply the policy to.
Segments are displayed as an option primarily when the Pushdown data processing engine is used. However, in Spark, if segments have already been defined at the asset level, they will still appear, allowing users to select the predefined segments. By default, the ADOC platform supports up to 20 Spark segments and up to 1500 Pushdown segments. For additional segment support, you can contact customer support; however, this may result in performance bottlenecks.
- Configure Rules:
- Configure required rules for the policy:
| Rules | Description |
|---|---|
| Null Values | Checks if the selected column contains any null values i.e., checks for completeness. If you enable the Include Empty Values in good records? toggle switch, rows with empty values are also considered as good records. |
| Schema Match | Checks column datatype against the selected column and datatype. Validates the consistency in data. Include Empty Values in good records: If you enable it, the toggle switch, rows with empty values are also considered as good records. Include Null Values in good records: Similarly, if you enable the toggle switch, rows with Null values are considered as good records. |
| Pattern Match | Checks if the column values adhere to the given regex (regular expression). (string type). |
| Enumerations | Verifies if the selected column values are in the list. Include Empty Values in good records: If you enable it, the toggle switch, rows with empty values are also considered as good records. Include Null Values in good records: Similarly, if you enable the toggle switch, rows with Null values are considered as good records. |
| Tags Match | Checks if the selected column values are present in the Tag provided. |
| Range Match | Check if a value falls within the selected range. |
| Duplicate Row Check | Check Distinct values i.e., if all the values in the selected column are unique. Toggle the |
| Row Check | Check the number of rows. |
| Data Policy Templates | Matches a set of rules that are configured. Select a policy template from the drop-down list. |
| SQL Rule | Create a custom condition involving one or more columns. For example, C1+C2>C3. The expressions must be in the form of a Spark SQL statement. |
| User Defined | User defined rules allow you to write custom code and create templates. |
| Lookup | Lookup rules allow you create a condition to validate the selected column’s values against a reference data asset. For more information, see Lookup Data Quality Policy. |
| Metric Check | Create a condition to validate the selected column’s metric such as SUM, AVG, MIN or MAX against a threshold. |
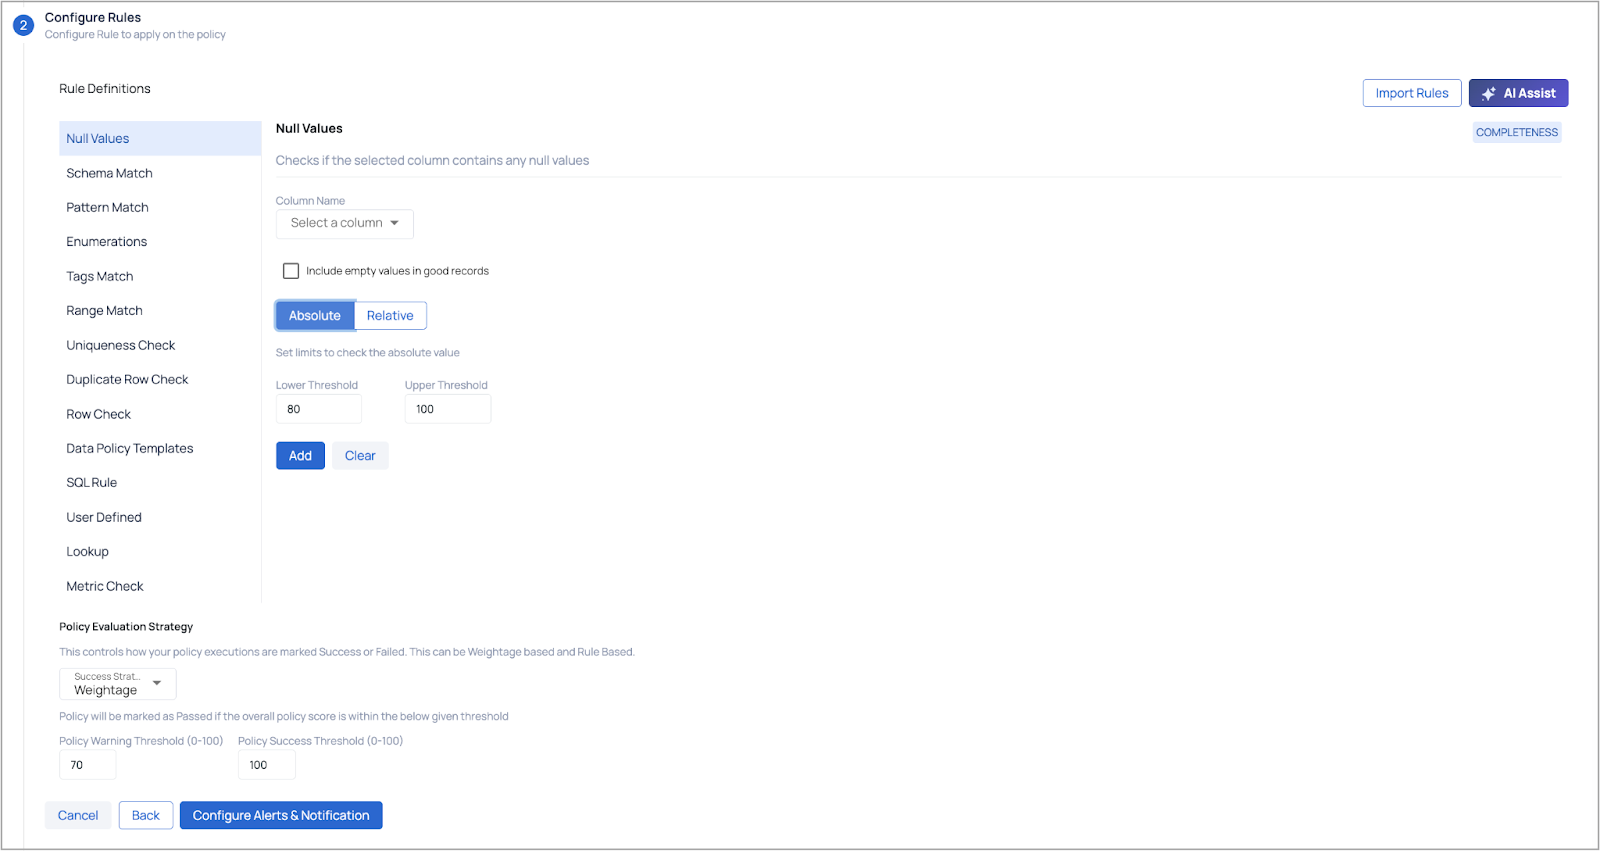
For each rule you can either set limits (lower and upper threshold values) to check the absolute value or select an appropriate comparison operator and look back window.
b. Policy Evaluation Strategy: This determines how your policy executions are classified as either Success or Failure. The classification can be based on Weightage or Rules. In a Rule-Based evaluation strategy, the policy is considered successful only if all the rules within the policy are passed. Even if a single rule fails, the policy execution will be marked as a failure, triggering an alert.
c. Provide Success Threshold values (0-100) and Warning Threshold values (0-100) and click Configure Alerts & Notifications button to proceed.
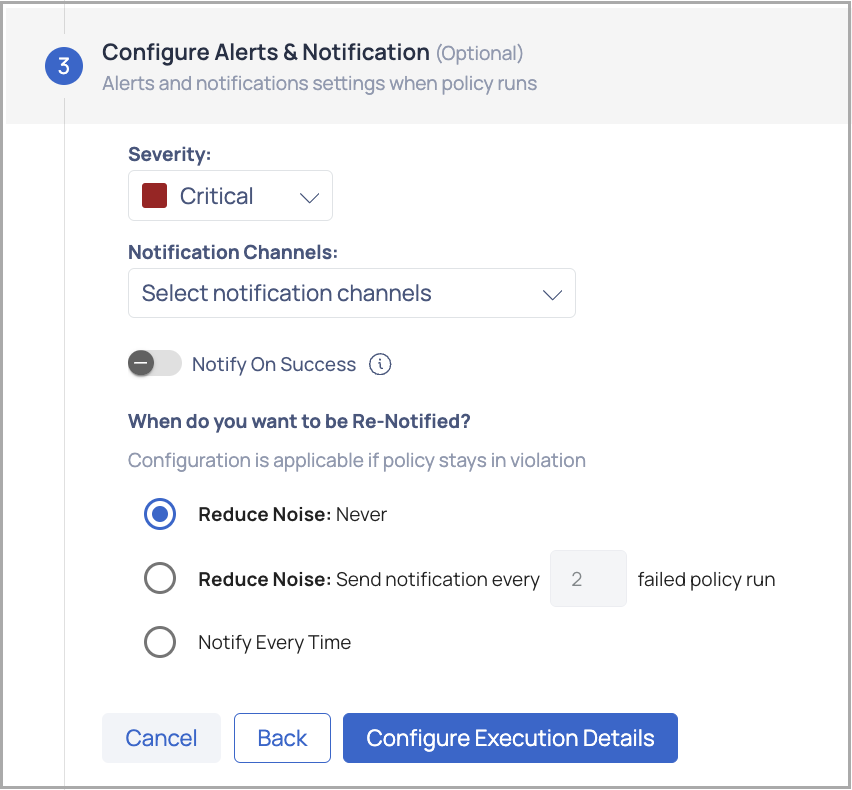
- (Optional) Configure Alerts & Notifications: To configure alerts and notifications for the policy when run, perform the following:
- Select the severity of the alert such as Critical, High, Medium, or Low.
- Select the notification channels you want to be notified on.
- Enable the Notify on Success toggle button if desired else by default you are notified of a failed policy execution.
- Select one of the following options for when you want to be re-notified:
- Reduce Noise: Never notified
- Reduce Noise: Provide value to send notifications after n number of failed policy runs
- Notify Every Time
(Optional) Configure Execution Details: Configure execution schedule, incremental checks if any, job timeouts, job resources and the data persistence path.
Incremental Strategy and Scheduling: Incremental profile uses a monotonically increasing value of a column to determine the bounds for selecting data from the data source. If specified, backing asset's incremental strategy is taken as the default value.
- Incremental Check: To incrementally check the conditions select one of the following incremental strategies such as id, datetime, or partitions.
- Auto Increment Column: Select a column from the drop-down list.
- Initial Offset: If a value is specified, then the starting marker for the first incremental profile is set to this value. If left blank, the first incremental profile will start from the beginning.
- Schedule: To schedule, select any tag like minute, hour, day, week, month, or year and select the relevant time zone.
Schedule Policy Execution: Enable this toggle to configure the frequency for policy execution by choosing intervals such as day, hour, week, month, or year. Additionally, specify the desired timezone.
(Optional) Advanced Execution Settings: Configure Good/Bad records persistence, Spark configuration, and Spark timeouts.
- Resource Strategy: Select one of the following types of resource strategies: Small, Medium, Large, Global, or Custom User Defined configuration. Apart from Custom for all other resource strategies must be configured using key & value pairs.
- Bad Records: These records that have quality issues or processing mistakes. Persistence configuration permits discarding or storing them elsewhere.
- Good Records: The records that survive quality tests and processing, but by selecting the persistence configuration you get to decide their fate.
- Persistence Folder Prefix categorizes persistence folders by data source, pipeline, or processing step. This is only applicable when the data processing engine selected is Spark.
- Job TimeOuts:
- Run timeout in minutes: Specify the maximum allowed runtime for the job.
- Total timeout in minutes: Specify the total allowed time for the job, including retries.
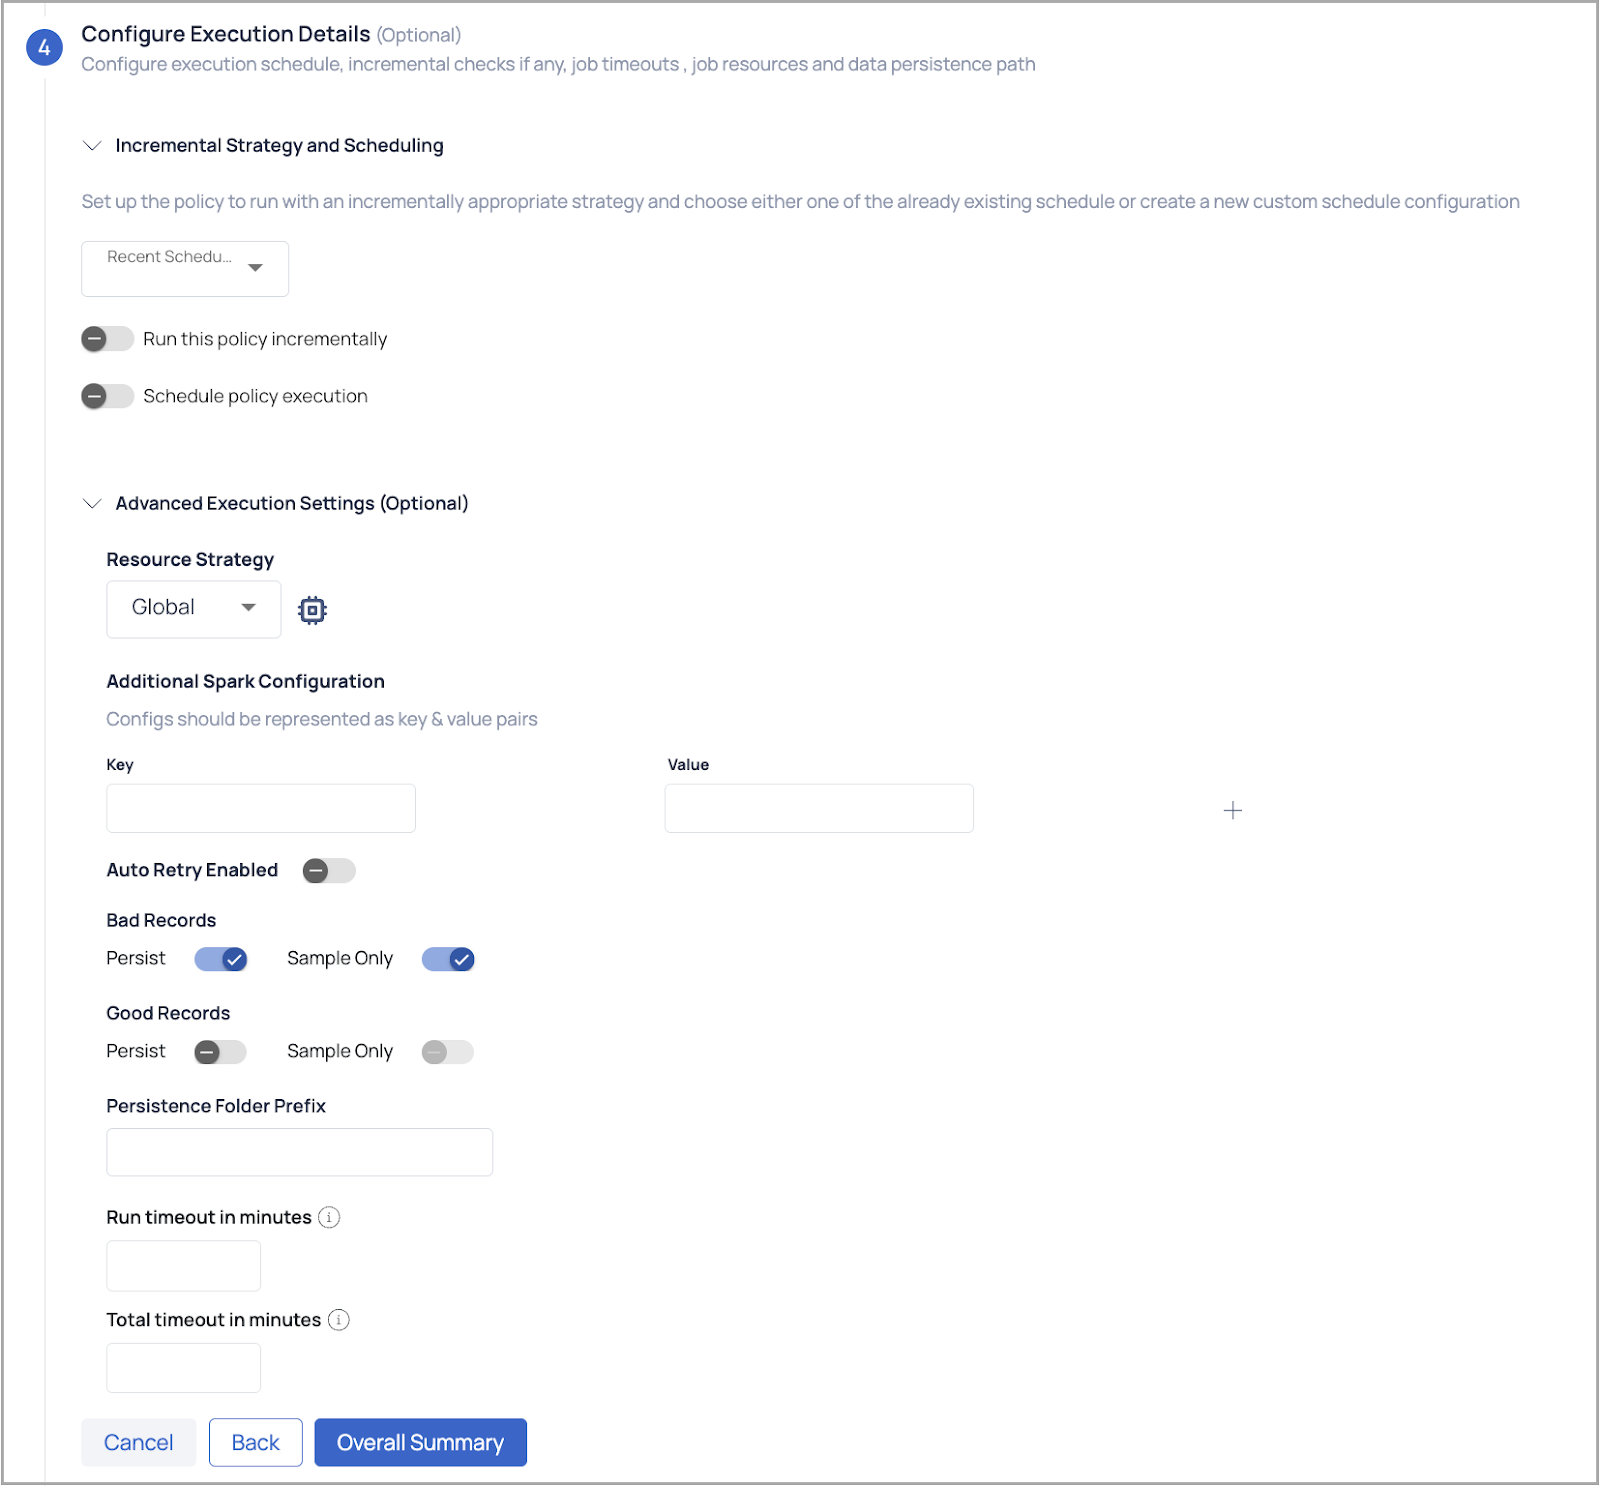
Click the Overall Summary button to proceed to the configuration summary section.
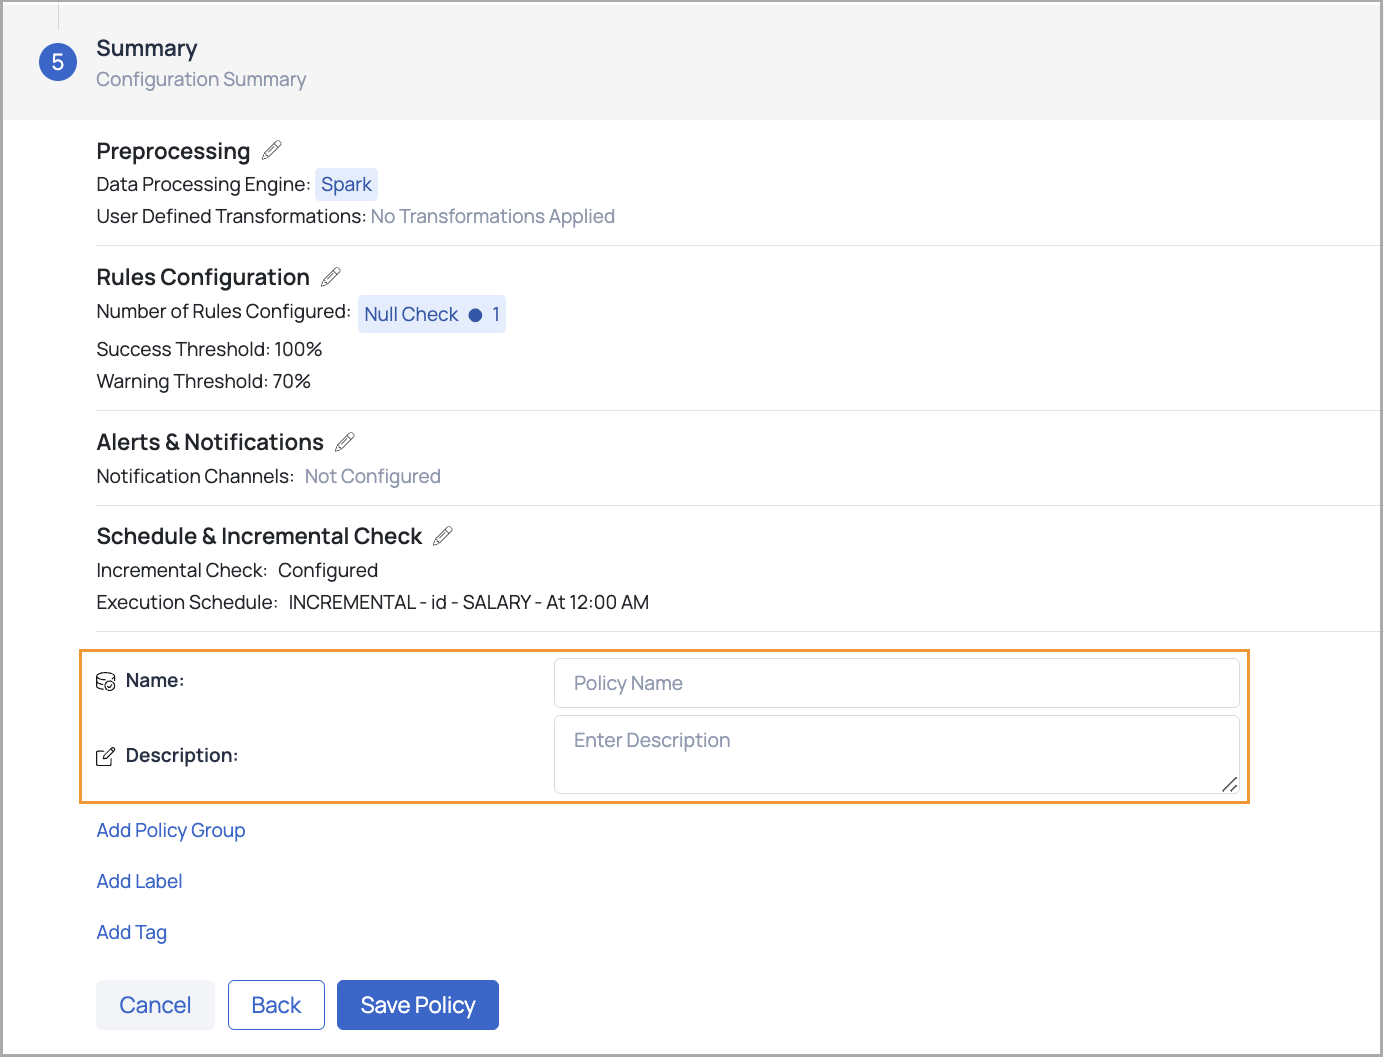
Review all the configurations entered in the previous steps.
If any changes are needed, click the Edit icon next to a specific configuration to navigate back to that step and update the details.
Enter a relevant Policy Name and Description—these are mandatory fields required to save the policy.
Optionally, you can:
- Add Policy Groups to categorize the policy.
- Assign Labels for easier identification.
- Include Tags for additional metadata.
Once all necessary information is provided, save the policy.
Notifications can be configured via Email, Slack, Chat, Webhook, Teams, and ServiceNow notification channels. Multiple executions provide insight into data quality, and failure locations help identify system issues.
Execute Policies
After creating a policy, you must execute it to identify data inconsistencies. Policy execution runs all the defined rules, and the results are displayed for each rule.
Steps to Execute a Policy:
- Navigate to Data Reliability.
- In the left pane, click Manage Policies.
- Search for your policy by name in the policy list table. Policy Result field and click Execute.
- Choose a policy execution option:
- All your data: Executes the policy on all data for the asset.
- Incremental: Runs the policy based on the incremental strategy defined in the policy.
- Selective: Executes the policy on a subset of data, filtered by an ID-based or date-based column.
For selective execution, user input fields will automatically be populated based on the parameters of the last successful selective execution, except for Initial Timestamp and Final Timestamp fields.
If no selective execution has been previously conducted, the system will default to the established incremental strategy of the concerned policy. If that is also not available, it will default to the incremental strategy selected at the asset level.
- Click the Execute button.
When the execution is complete, a result window appears, displaying the execution status, data quality status, and a description. View the policy execution result by clicking the See execution details button or by clicking the name of the policy in the policies table.
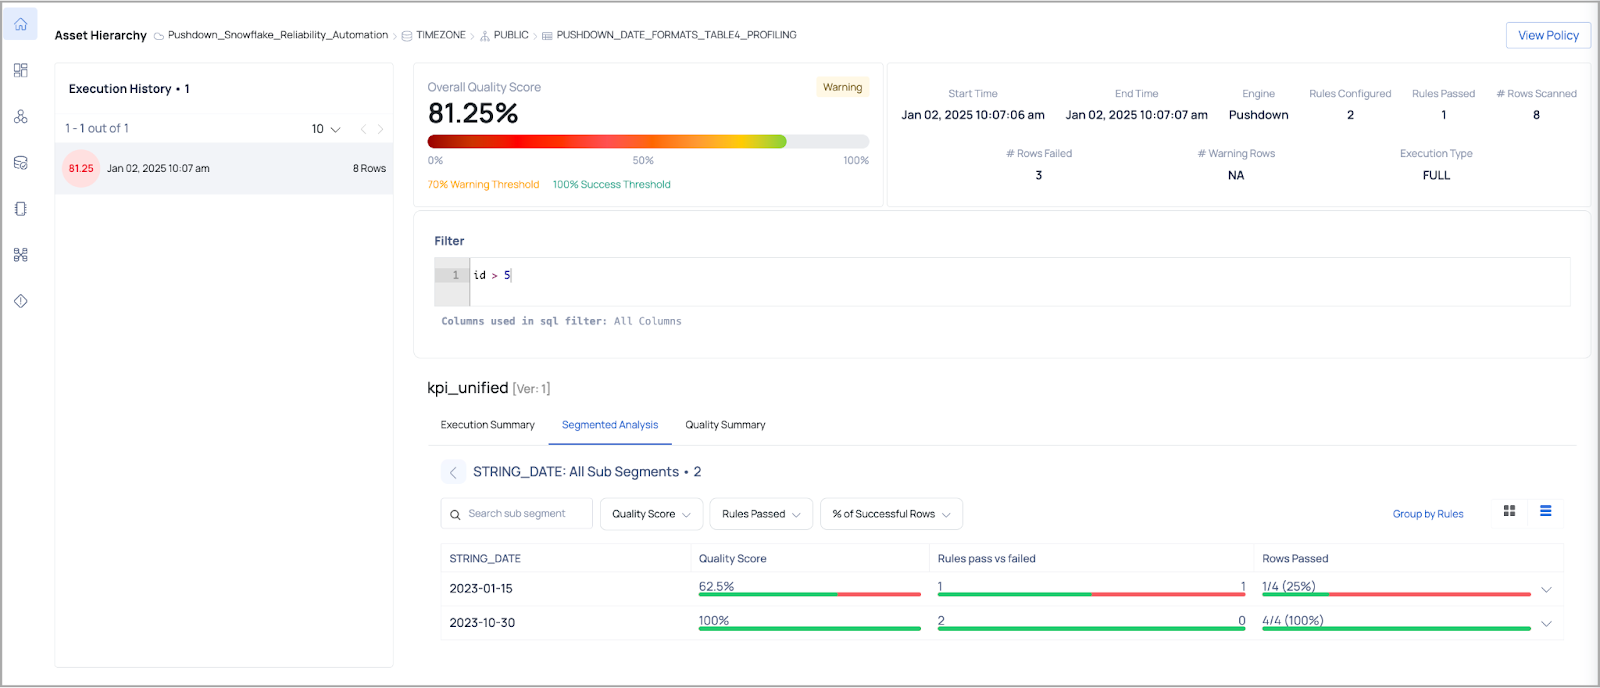
Data Quality Policy Execution Details
The Data Quality Policy Execution page provides insights into the execution of data quality rules and their results.
To access the Policy Execution page for a specific policy, follow these steps:
- Navigate to Data Reliability from the left main menu.
- Select Manage Policies to open the Manage Policies page, which lists all created policies.
- Use the filters above the table to view only data quality policies or search for your policy directly by name using the search bar.
- Once you locate your policy, click its name to open the Policy Execution page.
The following table describes the panels and tabs that are displayed in the execution results page:
| Panel | Description |
|---|---|
| Execution History | When the user clicks on a specific execution, the execution details for that execution are displayed on the right. |
| Overall Quality Score | Displays the overall quality score of the execution based on the rules and data processing. |
| Panel with Execution Details | Displays key execution details such as: Start Time, End Time, Data Processing Engine used (Spark, Pushdown), No. of Rules configured, No. of Rules passed, No. of Rows scanned etc. |
| Filter Panel | Displays the SQL filter query used for that particular execution. |
| Execution Summary Tab | Displays the rules applied in the policy along with the status such as failed or success. Also displays the success rate, weightage, and threshold type selected (absolute or relative). |
| Segmented Analysis Tab | Displays the segments on which the policy was applied for that asset. Users can drill down to see the number of rules passed vs. failed and rows passed for each rule. |
| Quality Summary Tab | Displays the different data quality dimensions and if any rule applied, its execution status, success rate, and weightage. |
Dynamic Column Mapping for SQL Rules and UDFs
Overview
The dynamic column mapping functionality enables you to write flexible SQL Rules and User-Defined Functions (UDFs) that dynamically adjust to changes in column names and structures across many data assets. This capability is especially useful for large-scale data quality management, where rules must be applied consistently without having to manually choose columns for each asset.
Dynamic mapping allows you to configure rules that use column and table tags to dynamically identify and apply the appropriate columns when the rules are executed. This lowers the expense associated with managing numerous rules for assets with similar but different named columns.
Adding a SQL Rule or UDF with Dynamic Mapping
To create a SQL Rule or UDF with dynamic column mapping, follow these steps:
Create or Edit a Data Quality Policy
- Navigate to Data Reliability > Policies and click on Add New or Edit an existing policy.
- Choose SQL Rule or User-Defined Function as the rule type.
Configure the Dynamic SQL Rule or UDF
- In the rule configuration window, write the SQL query or UDF using placeholders for column names, such as
${column}or${table}. - Ensure that the SQL Rule or UDF uses only one input variable for dynamic mapping.
- In the rule configuration window, write the SQL query or UDF using placeholders for column names, such as
Add Column and Table Tags
- In the Column Tags and Table Tags fields, specify the tags that correspond to the columns and tables you want the rule to apply to. When the rule is executed, it will dynamically identify and apply to all columns and tables with the matching tags.
Applying Dynamic Rules to Multiple Assets
When defining a Rule Set of type SQL Rule or UDF, dynamic column mapping allows the application of rules across multiple data assets without manually specifying each column or table name. This is particularly useful for scenarios where column names differ slightly across tables but represent similar data points (e.g., customer_id vs. cust_id).
- Navigate to Data Reliability > Policies.
- Add or edit a data quality policy and configure a rule set.
- Apply the rule set to relevant assets, and the system will automatically map the rule to the appropriate columns and tables based on the specified tags.
Suppose you have multiple tables with columns representing customer_id, but the column names vary across different tables (e.g., cust_id, client_id). Instead of creating separate rules for each table, you can use dynamic mapping:
- Tag each column representing
customer_idwith a tag such ascustomer_id. - Create a SQL Rule with a placeholder like
${column}. - The rule will automatically apply to all columns with the
customer_idtag, ensuring consistent data quality checks across all relevant tables.
GenAI Assisted Metadata Generation
The GenAI Assisted Metadata Generation feature automates the creation of metadata descriptions for tables and columns, enhancing asset discovery and explainability.
Usage:
- The feature is enabled only for tables with more than 2 columns.
- All columns must have either tags or sample data.
- It is applicable only to assets without existing descriptions.
Error Handling:
- The description generation button is active only for valid profile tables or columns.
- Automatic feedback is provided based on user actions: saving, canceling, or editing the generated description.
For more information on GenAI Assisted Metadata Generation, refer to Generate Auto Description#generate-auto-description.
Reconciliation Policy
Data observability requires a reconciliation policy to ensure data quality and consistency across assets. It checks source and sink assets for data integrity, profile match, equality match, discrepancies, trust, consistency, and pipeline issues. Reconciliation policies build data trust and reliability for analysis, decision-making, and business processes. For data-driven activities, a good reconciliation policy ensures accurate and trustworthy data.
A data reconciliation policy can be created in ADOC between two assets of the same type or between assets that can be profiled.
Take a look at this video which explains the process of creating a Reconciliation policy.
Create Reconciliation Policy
To create a Reconciliation policy, go to Manage Policies in the Data Reliability menu on the left pane, click Actions, and select Reconciliation. A modal to select assets will appear. Browse and choose the first asset (source) or table that you want to associate with the policy and click Next, then select the second asset (sink) and click Next again. This will open the Create Reconciliation Policy page, where you can proceed with the required steps to configure the policy.
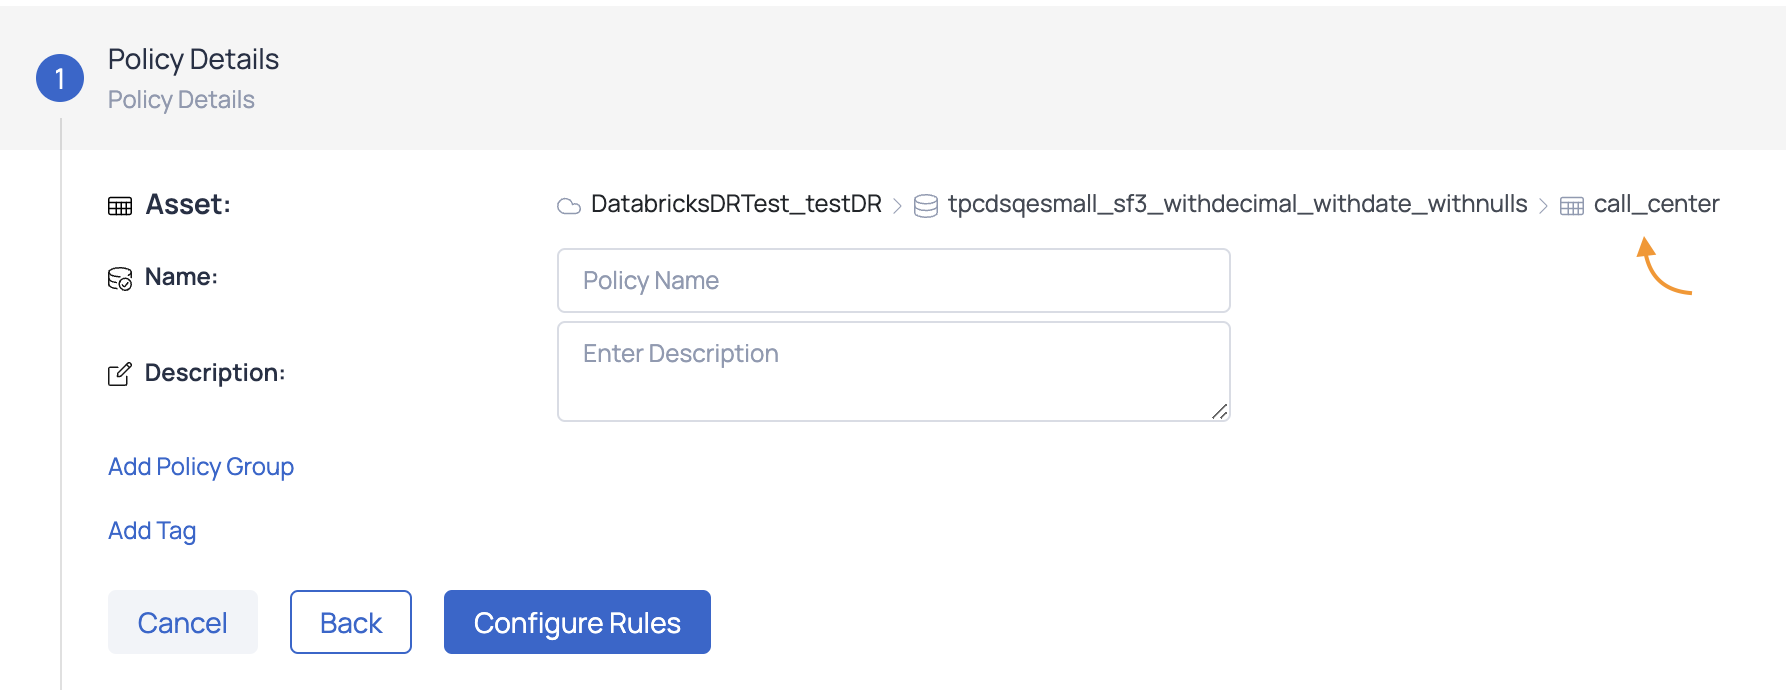
Provide Policy Details:
Provide a unique name for the policy in the Name field.
Optionally, add a description in the Description field to provide additional context about the policy.
To Add Policy Group:
- Click the Add Policy Group button.
- A list of available groups will be displayed.
- Either select a policy group from the list or use the search function to find a specific policy group.
- After making your selection, click Save to add the policy group.
To Add Label:
- Click the Add Label button.
- If you have note created a label before, a message dialog is displayed. In this dialog box, click Add Label to proceed.
- In the Add Label dialog box, enter the Key and value for the Label, then click the Add Label button.
- You can add multiple labels here. To delete a label, click the
icon next to it. - Once you have finished, click the Save button.
To Add Tag:
- Click the Add Tag button.
- In the dialog box, you can either search for and select a tag or choose one from the provided list.
- If you do not find the desired tag during the search, you can add a new one on the same screen. You can add multiple tags to the policy.
- After selecting the desired tags, click the Save button.
Click the Configure Preprocessing button to proceed to the next step.
(Optional) Preprocessing: The preprocessing section allows you to define filters for the source asset and sink asset to refine the data before reconciliation checks.
Source Asset SQL Filter:
- Locate the Source Asset SQL Filter input box.
- Define an SQL filter to narrow down the dataset from the source asset. Example:
ColumnName = 'value'
Sink Asset SQL Filter:
- Locate the Sink Asset SQL Filter input box.
- Define an SQL filter to narrow down the dataset from the sink asset. Example:
ColumnName = 'value'
Use column names that exist in your respective source and sink assets. Filters should adhere to SQL syntax supported by Spark.
- Rules:
| Step | Details | Example |
|---|---|---|
| Reconciliation Match Types | Data Equality: Compare individual column values. Hashed Data Equality: Compare hashed rows. Row Count Match: Compare row counts in source and sink datasets. | Data Equality: Validate Row Count Match: Compare sizes. |
| Define Rule Parameters | For Data Equality & Hashed Data Equality:
For Row Count Match:
| Left Column: Operator: |
| Add or Clear Rules |
|
Example Rule Table
| Match Type | Left Column | Right Column | Operator | Join Column | Ignore Null | Success Threshold | Warning Threshold |
|---|---|---|---|---|---|---|---|
| Data Equality | customer_id | client_id | = | No | Yes | 100 | 90 |
| Hashed Data Equality | order_hash | order_hash | = | Yes | No | 100 | 95 |
| Row Count Match | - | - | - | - | - | 100 | 95 |
(Optional) Schedule & Incremental Check: Configure times to run policy and incremental field to perform checks. Incremental profile uses a monotonically increasing value of a column to determine the bounds for selecting data from the data source. If specified, backing asset's incremental strategy is taken as the default value.
- Incremental Check: To incrementally check the conditions select one of the following incremental strategies such as id, datetime, or partitions.
- Auto Increment Column: Select a column from the drop-down list.
- Initial Offset: If a value is specified, then the starting marker for the first incremental profile is set to this value. If left blank, first incremental profile will start from the beginning.
- Schedule: To schedule, select any tag like minute, hour, day, week, month, or year and select the relevant time zone.
(Optional) Alert & Notification: To configure alerts and notifications for the policy when run, perform the following:
- Select the severity of the alert such as Critical, High, Medium, or Low.
- Select the notification channels you want to be notified on.
- Enable the Notify on Success toggle button if desired else by default you are notified of a failed policy execution.
- When do you want to be Re-Notified?: Select on of the following options:
- Reduce Noise: Never notified
- Reduce Noise: Provide value to send notifications after n number of failed policy runs
- Notify Every Time
(Optional) Advanced Policy Configuration: This step focuses on configuring advanced settings such as job persistence, Spark configurations, and timeouts for the reconciliation policy. This step is optional, but it enhances performance and ensures optimal resource utilization.
Persistence
Job Timeouts:
- Run Timeout in Minutes: Specify the maximum allowed runtime for the job.
- Total Timeout in Minutes: Specify the total allowed time for the job, including retries.
Data Plane:
- Choose the data plane strategy. Options include:
- Pushdown: Select Pushdown for SQL-compliant data sources (e.g., MySQL, PostgreSQL, Oracle).
- Spark: Select Spark for non-SQL-compliant sources (e.g., file systems, object stores).
- Choose the data plane strategy. Options include:
Delay in Minutes: Define a delay (in minutes) before the job is executed.
Spark Settings:
- Choose a Resource Strategy from the following options:
- Small: Predefined configuration for small workloads.
- Medium: Balanced configuration for moderate workloads.
- Large: Optimized for resource-heavy workloads.
- Custom: Allows you to manually define resource allocations. (See details below)
- Choose a Resource Strategy from the following options:
Custom Resource Strategy Configuration
If Custom is selected, additional fields appear to manually define Spark resources:
| Field | Description | Default Value |
|---|---|---|
| Number of CPU cores allocated to the Spark driver process | Defines the CPU cores for the driver process. | 1 |
| Amount of memory allocated for the Spark driver process | Set the memory for the driver process (e.g., 512m, 1g). | 1g |
| Driver Memory Overhead Factor | Additional memory for the driver as a fraction (e.g., 0.2 = 20%). | 0.2 |
| Minimum Number of Executors | Minimum executors to use for Spark jobs. | 1 |
| Maximum Number of Executors | Maximum executors to use for Spark jobs. | 10 |
| Number of CPU cores to use per executor | CPU cores allocated for each executor process. | 1 |
| Amount of memory provided to each executor process | Memory allocated for each executor (e.g., 1g, 2g). | 2g |
| Executor Memory Overhead Factor | Additional memory for executors as a fraction (e.g., 0.2 = 20%). | 0.2 |
| Additional Spark Configuration | Specify any additional Spark configurations as key-value pairs. | - |
| Auto Retry Enabled | Toggle to enable or disable automatic retries for failed jobs. | Disabled |
- Summary: This step displays all the configurations provided in the above steps. On reviewing the summary, click the Save Policy button.
Execute the Policies
After you have created a policy, you must put it into action to check for inconsistencies in your data. When you execute a policy, all of the rules stated in your policy are run, and you can view the results for each rule.
To execute a policy do the following steps:
- Navigate to Data Reliability.
- In the left pane, click Manage Policies.
- Locate the policy and the Policy Result column, which indicates the status (Successful, Warning, Errored, or Not Executed). Then, click the Run link beside it to select the type of execution (All Your Data, Incremental, or Selective) and click the Execute button.
- Choose a policy execution option:
- All your data: Executes the policy on all data for the asset.
- Incremental: Runs the policy based on the incremental strategy defined in the policy.
- Selective: Executes the policy on a subset of data, filtered by an ID-based or date-based column.
If you opted for Selective execution on your policy, input the following information to perform a selective execution:
| Column | Description |
|---|---|
| Column Type | Select either Id or Timestamp from the drop-down list. |
| Date Column | Select a date. |
| Date Format | Enter the format for how you would like the dates to be displayed. For example: dd/mm/yyyy or mm/dd/yy etc. |
| Initial Offset | Select a date from when execution of the policy should begin. |
| Final Offset | Select a date from when the execution of the policy should end. |
For selective execution, user input fields will automatically be populated based on the parameters of the last successful selective execution, except for Initial Timestamp and Final Timestamp fields.
If no selective execution has been previously conducted, the system will default to the established incremental strategy of the concerned policy. If that is also not available, it will default to the incremental strategy selected at the asset level.
- Click the Execute button.
When the execution is complete, a result window appears, displaying the execution status, data quality status, and a description. View the policy execution result by clicking the See execution details button.
If the Data Quality Status of is highlighted in red, the policy has failed.
If the Data Quality Status is highlighted in orange, it is a warning. It indicates that the quality score has risen above the Warning Threshold.
Pushdown Execution for Row Count Reconciliation
The Pushdown Execution for Row Count Reconciliation feature empowers you to perform row count comparisons between source and sink datasets using the native SQL engines of your data sources. By eliminating the dependency on Spark for these operations, this feature optimizes performance and reduces resource overhead, especially in environments with a high volume of reconciliation policies.
This guide provides step-by-step instructions on configuring and utilizing the Pushdown Execution feature within the Reconciliation Policies section of the ADOC platform. For more information, refer to step 6 (Advanced Policy Configuration) provided in the steps to create a Reconciliation policy.
Key Benefits
- Enhanced Performance: Executes reconciliation tasks faster by leveraging native SQL engines.
- Resource Efficiency: Reduces computational overhead by eliminating unnecessary Spark jobs.
- Flexibility: Supports mixed execution engines between source and sink datasets based on compatibility.
- Simplified Monitoring: Offers straightforward tracking and management of reconciliation policies.
The Pushdown Execution feature pushes the row count reconciliation logic directly to the data source's SQL engine. This approach bypasses the need to initiate Spark jobs, resulting in quicker execution and reduced resource consumption.
Monitoring Policy Execution
- Go to the Execution view to monitor your reconciliation policies.
- Policies using the Pushdown engine are displayed alongside Spark-based policies.
- Use the provided monitoring tools to track execution progress and outcomes.
- Pushdown policies typically provide faster feedback due to reduced execution overhead.
Transitioning Existing Policies
To switch an existing policy to Pushdown Execution:
- Open the policy and click Edit.
- Change the Data Processing Engine to Pushdown.
- Save the policy to apply the changes.
All existing configurations, such as filters, scheduling, and notifications, will remain unaffected.
Prefer Pushdown Execution: Use Pushdown whenever possible to enhance performance and reduce resource usage.
Optimize Scheduling: Align reconciliation tasks with your data pipelines to minimize operational overhead.
Apply Filters: Narrow down the data scope to relevant segments for more efficient reconciliation.
Data Drift Policy
A data drift policy is a set of rules and criteria used to detect and track changes in data distribution, properties, or behavior over time. It assists in detecting instances when data deviates significantly from its expected or baseline state. ADOC's Data Drift calculates the percentage change in key measures when the underlying data changes. The user can create data drift rules for each type of metric to validate the data change against a tolerance threshold. You can configure data drift rules to send alerts when the drift reaches a specific level.
- Profile an asset at least once to configure a Data Drift policy.
- An asset can have only one Data Drift policy.
- A Data Drift policy cannot be executed manually. It is automatically executed after every profile that is performed on the asset.
Create Data Drift Policy
The following steps describe how to create a Data Drift Policy:
Policy Details:
Provide a unique name for the policy.
Enter a description to define the purpose of the policy.
(Optional) Click Add Policy Group to assign the policy to a group:
- Click the Add Policy Group button.
- A list of available groups will be displayed.
- Either select a policy group from the list or use the search function to find a specific policy group.
- After making your selection, click Save to add the policy group.
(Optional) Click Add Tag to add metadata tags:
- Click the Add Tag button.
- In the dialog box, you can either search for and select a tag or choose one from the provided list.
- If you do not find the desired tag during the search, you can add a new one on the same screen. You can add multiple tags to the policy.
- After selecting the desired tags, click the Save button.
Click Configure Rules to proceed.
Configure Rules:
Select Columns:
- Choose the columns from the dataset for which drift metrics will be evaluated. Columns can be filtered based on their data type:
- String
- Integral
- Date
- Fractional
- Choose the columns from the dataset for which drift metrics will be evaluated. Columns can be filtered based on their data type:
Select Metrics for Drift Evaluation:
- For each column, define the metrics to measure data drift. Available metrics include:
- % Not Null: % of null values
- Distinct Values: No. of distinct values
- Average Length: Average length of a string
- Maximum Length: Maximum length of a string
- Minimum Length: Minimum length of a string
- Upper Case: No. of uppercase values in string column
- Lower Case: No. of lowercase values in string column
- Mixed Case: No. of mixed case values in string column
- Average: Average value for a integer/fractional column
- Maximum: Maximum value for a integer/fractional column
- Minimum: Minimum value for a integer/fractional column
- Standard Deviation: Amount of variation or dispersion of values
- For each column, define the metrics to measure data drift. Available metrics include:
Click the Add Rules button to add the metric with its % drift threshold values for the selected column.
Set Thresholds and Weights:
- Threshold: Define the acceptable percentage of data drift.
- Weightage: Assign importance (weightage) to each metric.
Set Policy Success Criteria:
- Success Threshold (0-100): Minimum percentage for policy success. Example:
100. - Warning Threshold (0-100): Trigger a warning if the policy passes below this percentage. Example:
70. - Interval (in days): Set the frequency of policy runs. Example:
10.
- Success Threshold (0-100): Minimum percentage for policy success. Example:
Click the Configure Alerts button to proceed to the next step.
(Optional) Configure Alerts:
Define the alerting configuration for policy violations:
- Severity : Choose the severity level (e.g., Critical, High, Medium, or Low).
- Notification Channels: Select one or more notification channels for alerts.
- Toggle Notify on Success to enable/disable success notifications.
Set Re-Notification Preferences:
- Reduce Noise (Never): Send no repeated notifications for continuous violations.
- Send Notification Every [X] Failed Runs: Notify after a defined number of violations.
- Notify Every Time: Send a notification for every policy violation.
Click Show Summary to review the configuration.
Summary:
On the Summary section, review the policy configuration:
- Overview: Verify the policy name and description.
- Rules Configuration: Ensure thresholds and metrics are correctly set.
- Alerts & Notifications: Confirm severity level and notification channels.
Enable Policy: Toggle the Enable Policy option to activate the policy.
Click Save Policy to finalize.
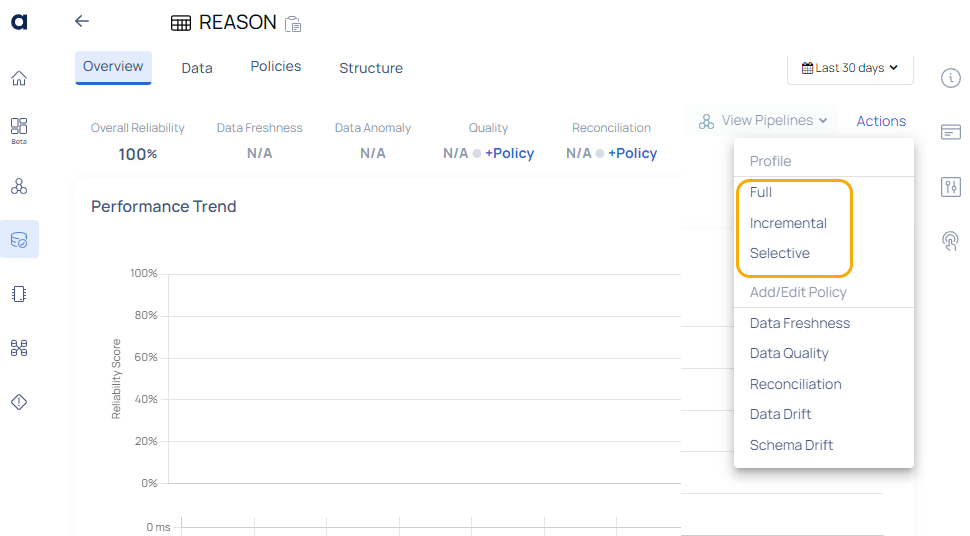
Profile the Asset (Automatic Execution)
- Clicking on the breadcrumb takes you to the Overview page of the asset.
- Select one of the following option for policy execution.
- Full: This option executes the policy on all the data for the asset.
- Incremental: Policy will be executed based on the incremental strategy set inside the policy.
- Selective: Selective execution runs jobs over a subset of data, bounded either by an id-based column or a date-based column.
For selective execution, user input fields will automatically be populated based on the parameters of the last successful selective execution, except for Initial Timestamp and Final Timestamp fields.
If no selective execution has been previously conducted, the system will default to the established incremental strategy of the concerned policy. If that is also not available, it will default to the incremental strategy selected at the asset level.
When the execution is complete, a result window appears, displaying the execution status, data quality status, and a description. View the policy execution result by clicking the See execution details button.
If the Data Quality Status of
If the Data Quality Status
Schema Drift Policy
A schema drift policy helps identify instances where the schema of data sources or data files deviates from the expected or defined structure. In ADOC the Schema Drift policy detects changes to a schema or table between the previously crawled and currently crawled data sources.
Create Schema Drift Policy
The following steps guide you through creating a Schema Drift Policy, which monitors changes in schema and sends alerts based on predefined criteria.
Schema Configuration:
Select Drift Alerts:
Choose the types of schema changes to monitor by enabling the relevant toggles:
- Alert on Column Additions: Get notified when new columns are added to the schema.
- Alert on Column Removals: Get notified when columns are removed from the schema.
- Alert on Column Metadata Changes: Get notified when metadata of existing columns changes.
(Optional) Edit Metadata: Click Edit Metadata to customize the metadata fields to monitor for changes:
- Standard Metadata: Data Type: Monitor changes in the data type of columns.
- Relationships: Monitor changes in relationships (e.g., foreign keys, references).
- Additional Metadata: Enable if custom metadata fields need to be monitored such as Column Default, Is Nullable, Interval Type etc.
Click Done after making the selection.
Click Configure Notifications to proceed.
(Optional) Alerts & Notification:
Define the alerting configuration for policy violations:
- Severity : Choose the severity level (e.g., Critical, High, Medium, or Low).
- Notification Channels: Select one or more notification channels for alerts.
- Toggle Notify on Success to enable/disable success notifications.
Set Re-Notification Preferences:
- Reduce Noise (Never): Send no repeated notifications for continuous violations.
- Send Notification Every [X] Failed Runs: Notify after a defined number of violations.
- Notify Every Time: Send a notification for every policy violation.
Click Show Summary to review the configuration.
(Optional) Summary:
In the Summary section, review the following details:
- Severity: Confirm severity levels
- Notification Channels: Confirm the number of notification channels.
- Notification on Success: Displays Yes or No based on your selection.
Click Save Policy to finalize the schema drift policy.
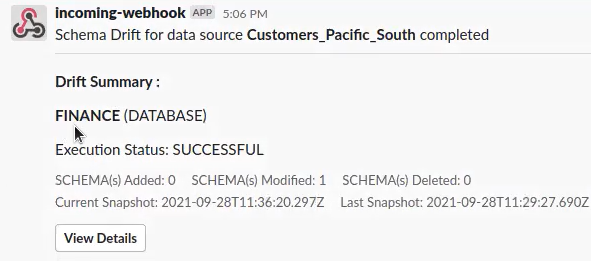
Execute Schema Drift Policies
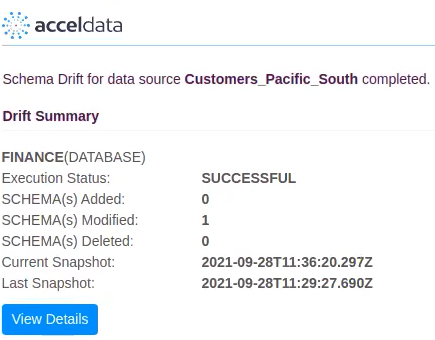
To execute the schema drift policy applied to an asset, it is necessary to crawl the data source where the asset resides. The schema drift policy is triggered each time the crawler runs. A preview of the schema drift policy execution results is sent to the configured notification channels as shown below:
Slack Notification Channel
Email Notification Preview
Data Freshness Policy
This policy ensures that data is current and up to date. Freshness is critical for operating systems, real-time analytics, and other time-sensitive applications.
To create a Data Freshness policy for an asset, you can choose one of two methods:
- From the Asset Details Page: Click the Actions button and select Data Freshness. This opens the settings wizard with the Freshness & Volume Monitoring Settings page, where you can configure the freshness policy for the asset.
Data Freshness from Asset Details page
- From Manage Policies: Navigate to Data Reliability > Manage Policies in the left pane. Click the Actions button and select Freshness. In the displayed modal, select the asset to which you want to apply the freshness policy and click Next. This opens the Create Freshness Policy page, where you can proceed with the configuration.
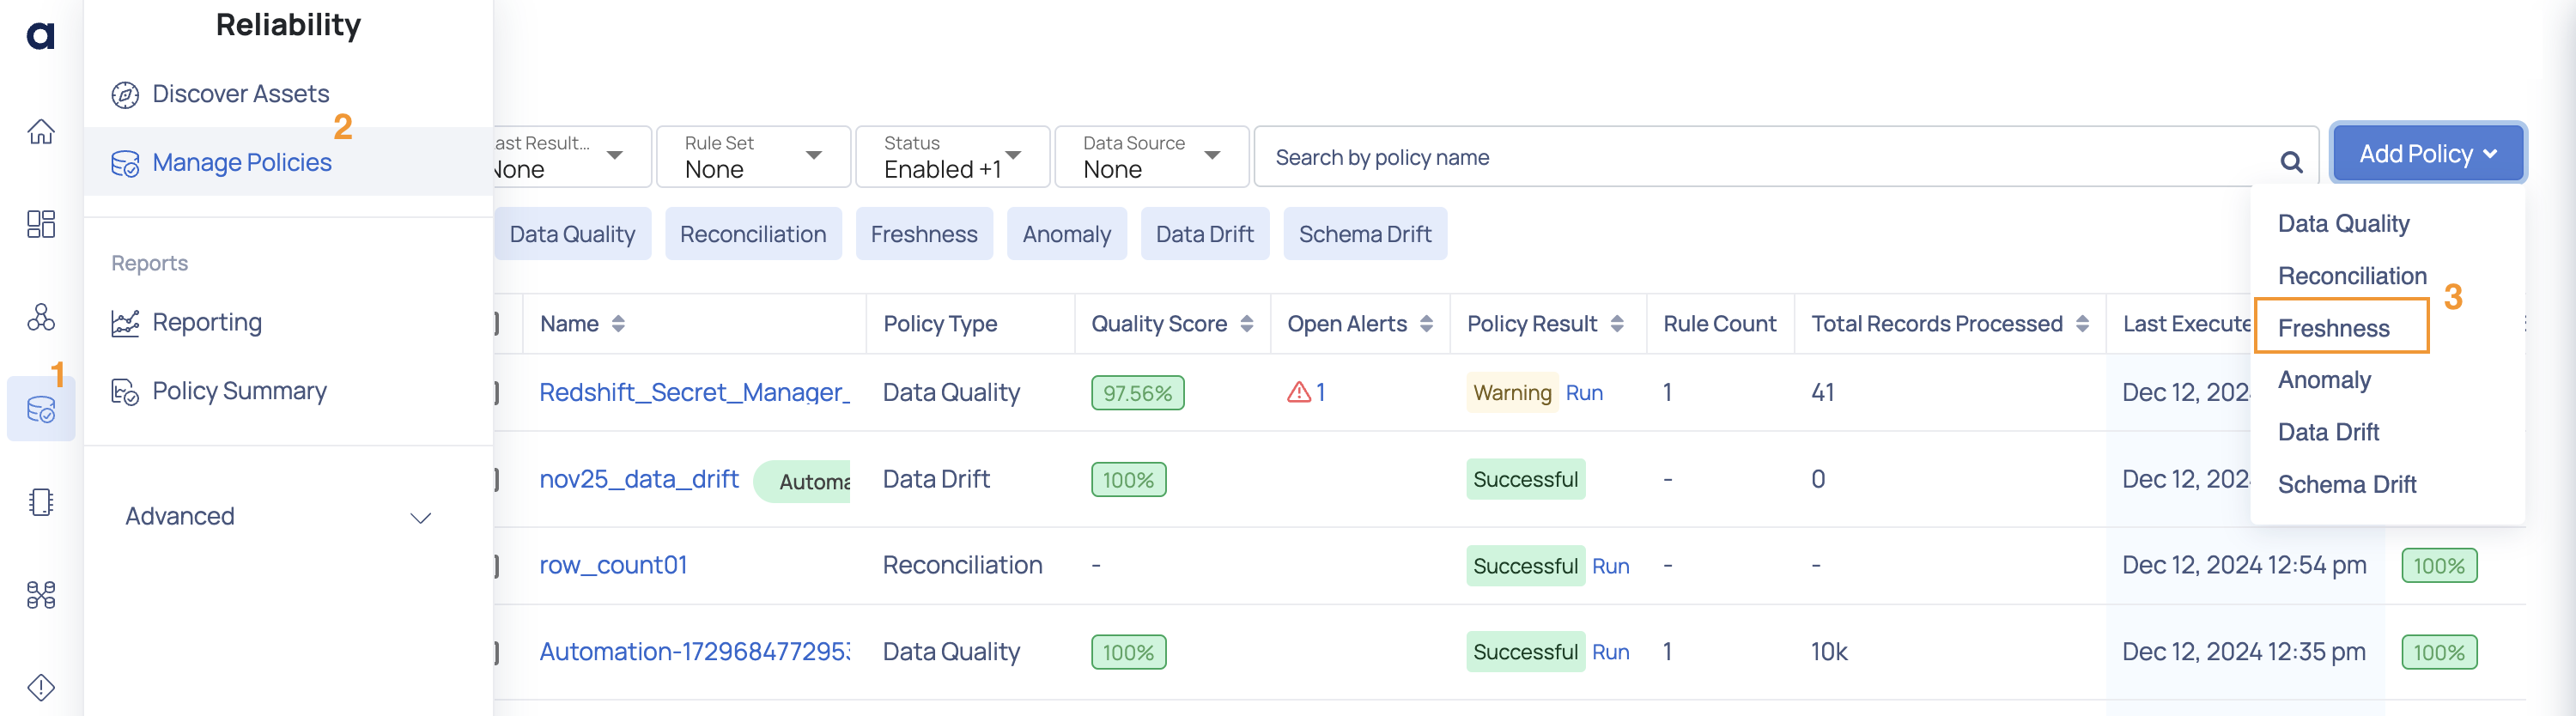
Freshness Policy from Manage Policies page
Create Data Freshness Policy
Follow these steps to create a freshness policy for an asset from the Manage Policies page after selecting an asset on which you want to apply the freshness policy:
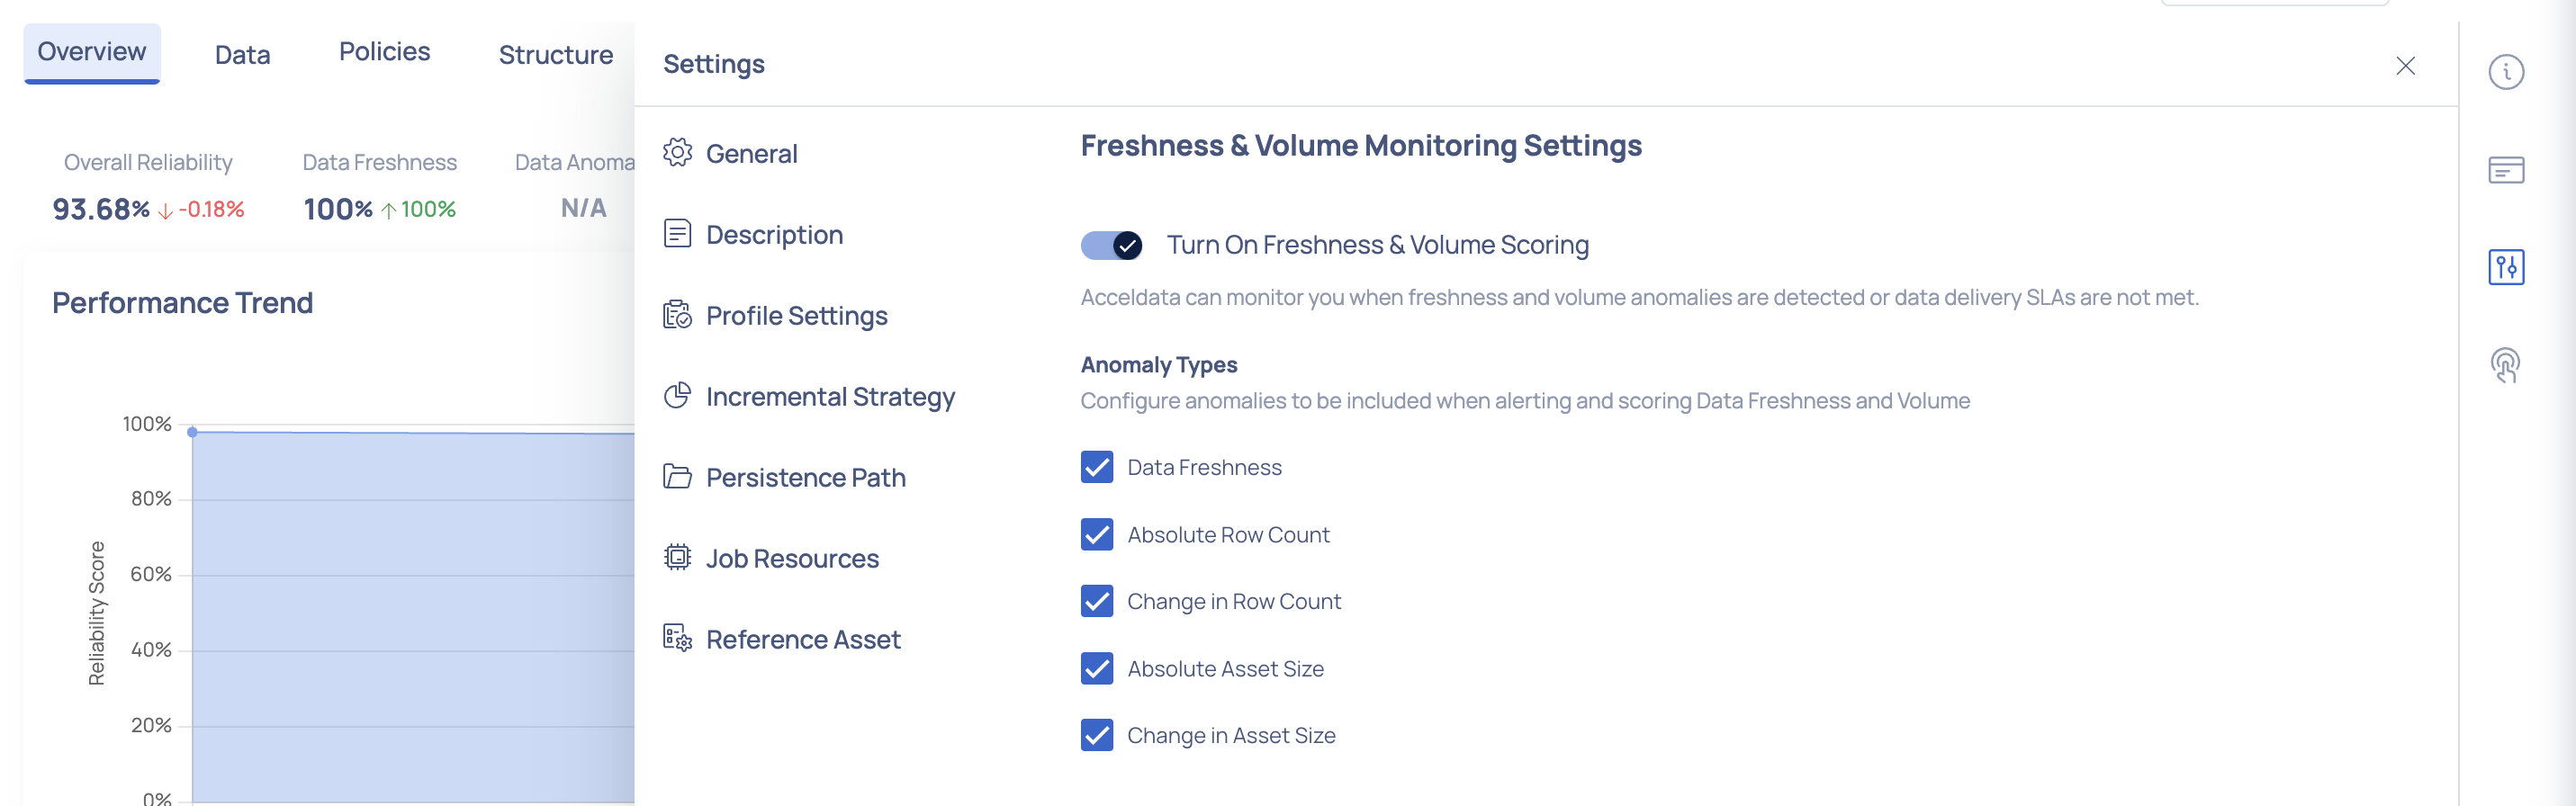
Enable Freshness:
Turn On Freshness & Volume Scoring: To enable monitoring, toggle the Turn On Freshness & Volume Scoring switch to the ON position. This enables ADOC to alert you when anomalies are detected, or if data delivery SLAs are not met.
Anomaly Types: Configure anomalies to be included when alerting and scoring Data Freshness and Volume using the checkboxes to include or exclude each type of anomaly:
- Data Freshness: Track whether data is updated within the expected timeframe.
- Absolute Row Count: Monitor the absolute number of rows.
- Change in Row Count: Track variations in file count.
- Absolute Asset Size: Monitor the absolute size of asset.
- Change in Asset Size: Track variations in asset size.
Click Configure Thresholds button to proceed to the next step.
Thresholds:
- Metric Thresholds: Configure thresholds for when metrics should create an alert.
| Metrics | Configuration Options | Examples |
|---|---|---|
| Data Freshness |
| Alert if no update is detected in the last 24 hours. |
| Absolute Row Count |
| User-Defined: Alert if row count exceeds 10,000.
Relative: Alert if row count increases by 10% over the last 10 hours. |
| Change in Row Count |
| User-Defined: Alert if row count changes to 10,000.
Relative: Alert if row count increases by 10%. |
| Absolute Asset Size |
| User-Defined: Alert if asset size exceeds 1 GB.
Relative: Alert if asset size increases by 10% over the last 24 hours. |
| Change in Asset Size |
|
b. Policy Threshold:
| Configuration | Description | Example |
|---|---|---|
| Success Threshold (0-100) | Minimum score required for the policy to pass. | 30 |
| Warning Threshold (0-100) | Trigger a warning if the policy score falls below this value. | 10 |
| Anomaly Strength Inclusion | Set the minimum anomaly strength to include in scoring (High, MEDIUM, or LOW). | LOW |
c. Click Configure Alerts & Notifications button to proceed to the next step.
(Optional) Alerts & Notification:
Define the alerting configuration for policy violations:
- Severity : Choose the severity level (e.g., Critical, High, Medium, or Low).
- Notification Channels: Select one or more notification channels for alerts.
- Toggle Notify on Success to enable/disable success notifications.
Set Re-Notification Preferences:
- Reduce Noise (Never): Send no repeated notifications for continuous violations.
- Send Notification Every [X] Failed Runs: Notify after a defined number of violations.
- Notify Every Time: Send a notification for every policy violation.
Click Advanced Settings button to configure model settings for freshness.
(Optional) Advanced Freshness Settings: Configure optional model parameters to improve the detection of anomalies in the freshness policy.
| Setting | Description | Example / Options |
|---|---|---|
| Training Window Minimum | Specifies the minimum number of days required for the system to train the anomaly detection model. |
|
| Model Sensitivity | Adjusts the sensitivity of the anomaly detection model. |
|
- (Optional) Summary: Review the configurations added at each step such as the asset selected, Anomaly Types Enabled, Metric Thresholds, Alert Severity, and Notification channels.
- Click Save Policy.
Execute Freshness Policy
Once a policy is created, it must be executed to identify data inconsistencies. During execution, all the defined rules in the policy are applied, and you can review the results for each rule.
Freshness policy executions are triggered every hour.
Anomaly Policy
This policy detects any strange patterns or anomalies in your data that could signal faults or major events.
ADOC includes semi-structured data types in its Data Anomaly Policy management, enhancing anomaly detection and providing more comprehensive data quality monitoring. This integration allows for more detailed and accurate anomaly detection across various data formats, enhancing ADOC's commitment to providing robust and versatile data monitoring tools.
The data types of the columns include:
- Array
- Object
- Variant (Snowflake native datatype)
Create Data Anomaly Policy
Follow these steps to create a data anomaly policy for an asset from the Manage Policies page after selecting an asset on which you want to apply the anomaly policy:
Policy Details: Select either Spark or Pushdown as the data processing engine and click Show Columns button to proceed to the next step.
Data Columns: Select columns to be used for anomaly detection and profiling.
Note By default, Acceldata includes all columns for profiling.- To detect anomaly for a column, select the checkbox under the Data Anomaly column.
- Click Configure Anomaly button to proceed.
Anomaly Configuration:
Policy Scoring:
- Policy Threshold: Define success and warning thresholds for scoring anomalies.
- Anomaly Strength Inclusion: Select the minimum anomaly strength to include in scoring. Options available are HIGH, MEDIUM, LOW. Only include anomalies with strength >= HIGH.
Alerts & Notifications:
Define the alerting configuration for policy violations:
- Severity: Choose the severity level (e.g., Critical, High, Medium, or Low).
- Notification Channels: Select one or more notification channels for alerts.
- Toggle Notify on Success to enable/disable success notifications.
Set Re-Notification Preferences:
- Reduce Noise (Never): Send no repeated notifications for continuous violations.
- Send Notification Every [X] Failed Runs: Notify after a defined number of violations.
- Notify Every Time: Send a notification for every policy violation.
Anomaly Detection Settings:
- Training Window Minimum: Define the minimum number of executions required for training the anomaly detection model. Example: 7 executions.
Note At least 3 executions are required and the minimum training window must be at least 7 days. - Model Sensitivity: It allows fine-tuning to reduce false positives or capture more subtle anomalies. Adjust the sensitivity of the anomaly detection model. Options: High, Medium, Low.
- Training Window Minimum: Define the minimum number of executions required for training the anomaly detection model. Example: 7 executions.
Advance Perform Settings:This step allows you to optimize the processing efficiency for profiling metrics and manage memory consumption during data profiling.
Processing Batch Size:
- Define the batch size for processing data during metric calculations.
- Default:
30. Note Adjusting the batch size is uncommon and is only recommended if explicitly advised by the support team.
Optimize Data Load with Batches:
- Enable this option to load data in smaller batches instead of loading all columns into memory at once.
- Recommended for wide datasets with frequent updates to reduce memory consumption.
Important While batch loading can optimize memory usage, it may introduce inconsistencies in profiling results.
Summary: Review the configurations added at each step and click the Save Policy button.
Execute Data Anomaly Policies
Steps to Trigger a Data Anomaly Policy Execution:
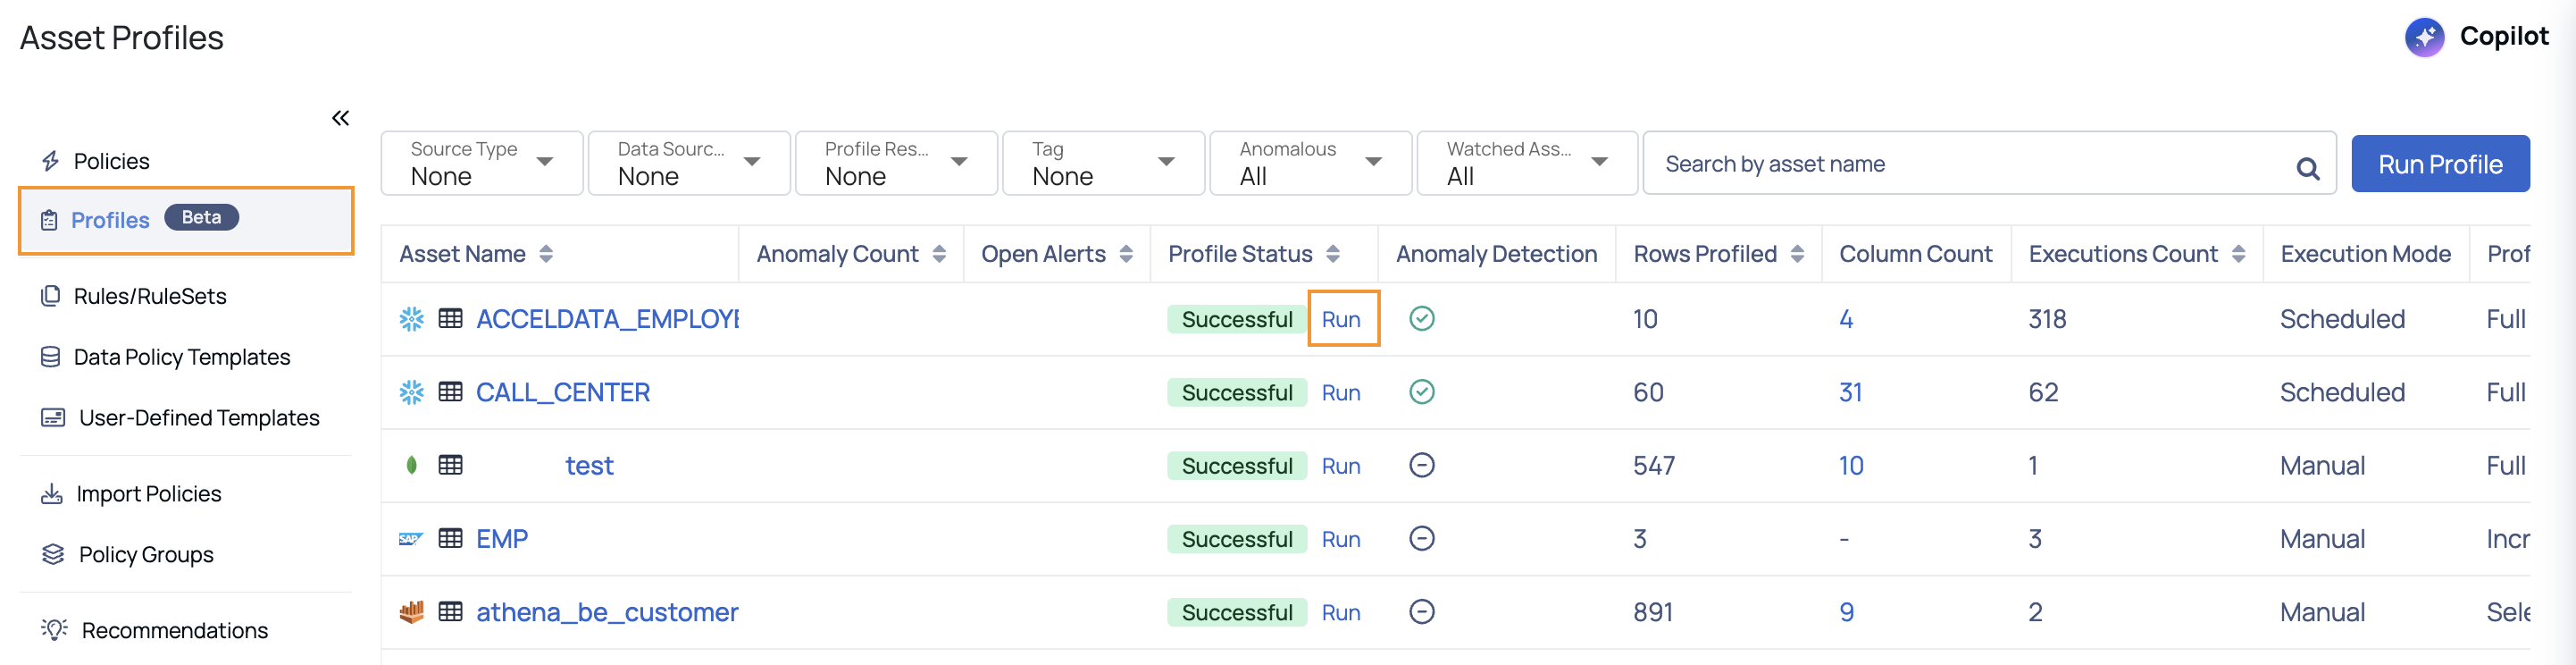
- Navigate to the Profiles (Beta) section on the Manage Policies page. The Asset Profiles page is displayed.
- Search for the asset on which the policy is applied.
- In the Profiles table, locate the asset and click the Run link under the Profile Status column to initiate profiling.
Alternatively:
- Navigate to the asset's details page.
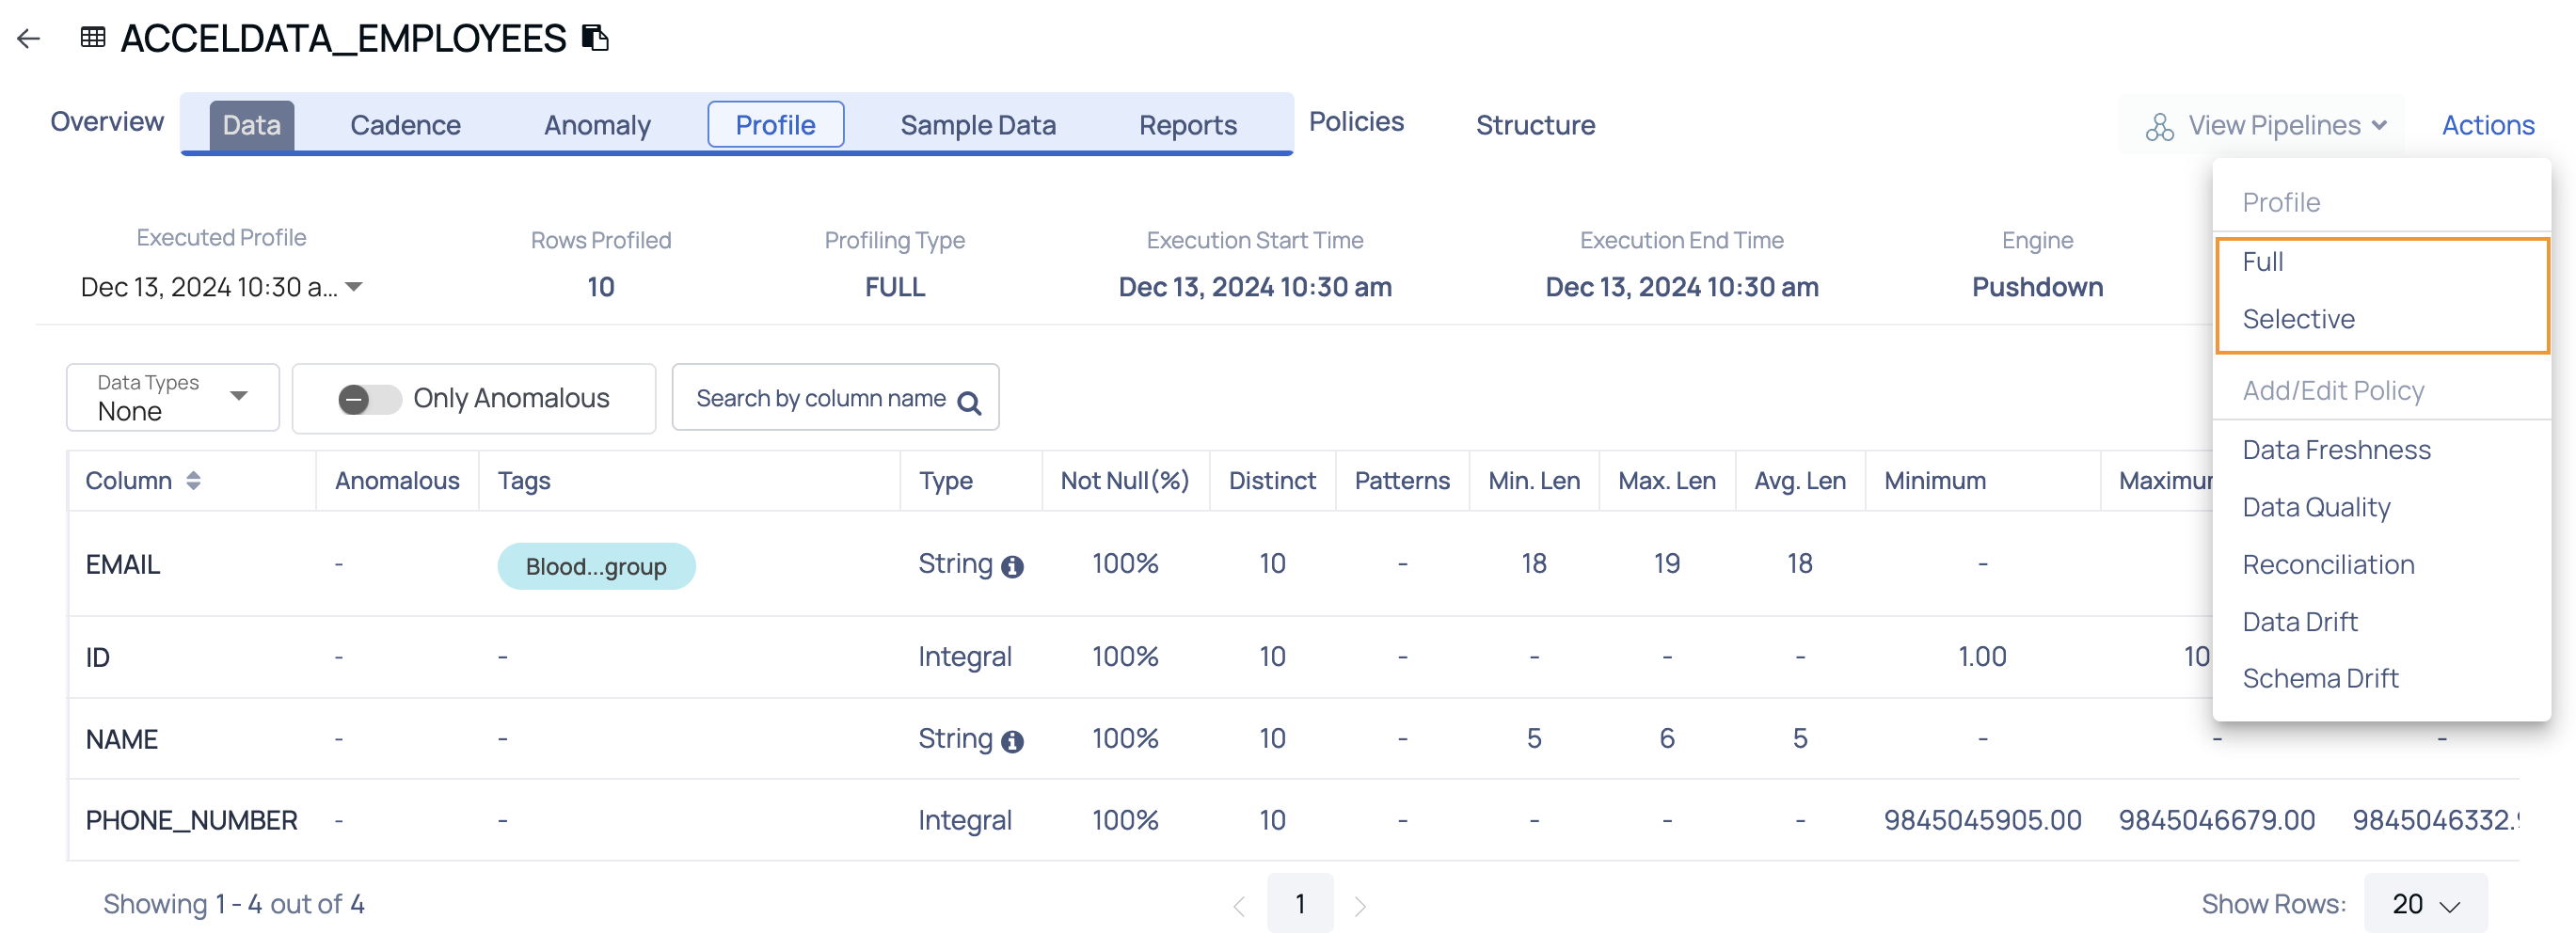
- Click the Actions button.
- Select the desired profiling type (e.g., Full or Selective).
Once the asset is profiled, the Data Anomaly policy execution is triggered automatically.