Managing Data Sources
Once you add the Data Source to ADOC, a new card is added on the Data Sources tab. You can now perform various operations on the Data Sources added to ADOC. This document explains the various actions that you can perform on Data Sources added to ADOC.
Data Source Menu Options
Edit Configuration
The Edit configuration option allows you to edit the details of your Data Source. For the Databricks data source, if you have created multiple Workspaces, you can select the specific Workspace to be edited.
To edit a Data Source:
- Navigate to Data Sources.
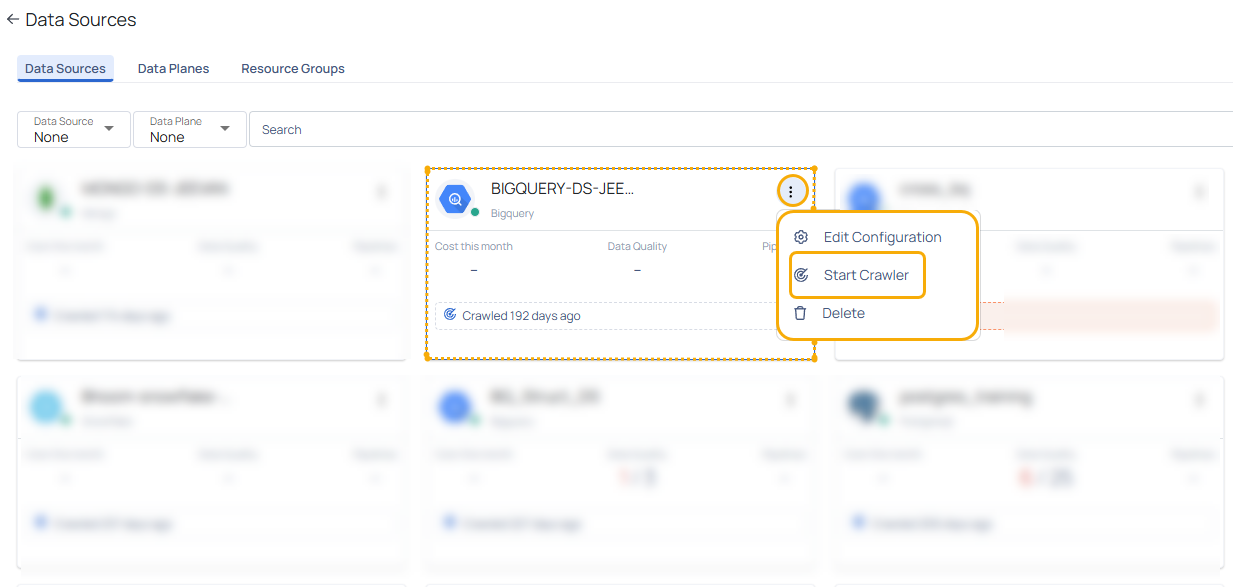
- Click the ellipsis menu icon for the data source to be edited.
- Select the Edit Configuration option. For the Databricks data source, hover on the Edit Configuration button and select the Workspace to be edited.
- Perform the required edits and click Submit.

Start Crawler
The Start Crawler option crawls your Data source to fetch the latest data. Once the data is fetched, you can view the corresponding changes in Data Reliability capability. The crawl process runs in the background. Once the crawling is completed, the data is fetched in to ADOC.
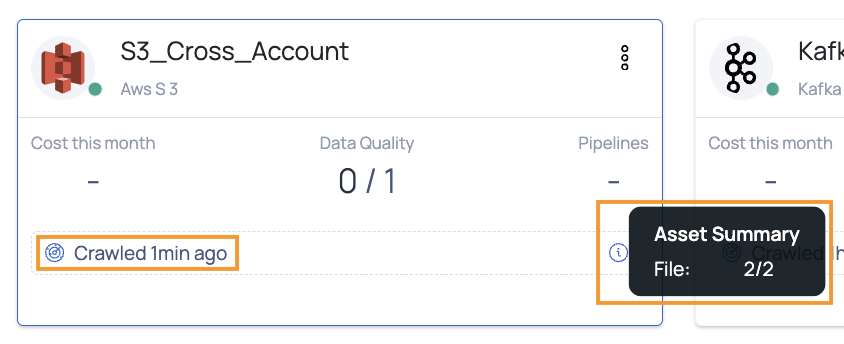
You can click the Data Source card to check the last crawl date. If you are yet to crawl your Data Source after adding it to ADOC, you see a Crawled never message.
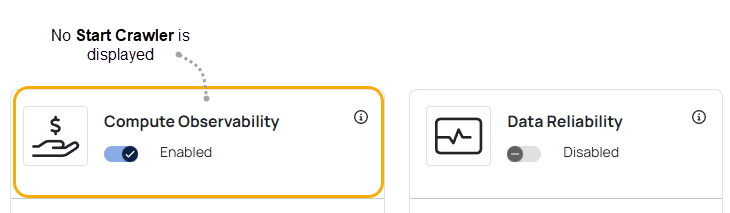
The Start Crawler option is applicable to Snowflake and Databricks data sources only if you have enabled the Data Reliability capability. If you are using Snowflake and Databricks data sources only for Compute Observability capability, the Start Crawler option is not displayed. This is because the crawl feature is applicable only for the Data Reliability capability.
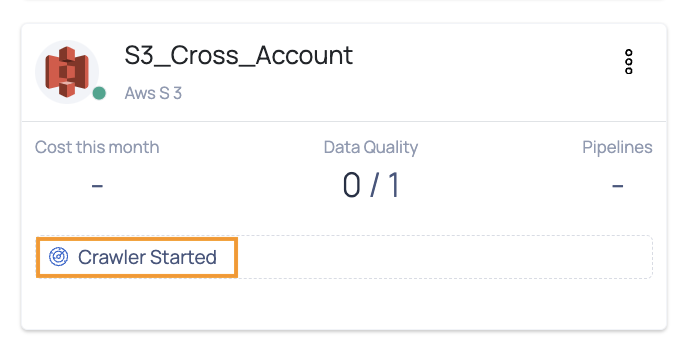
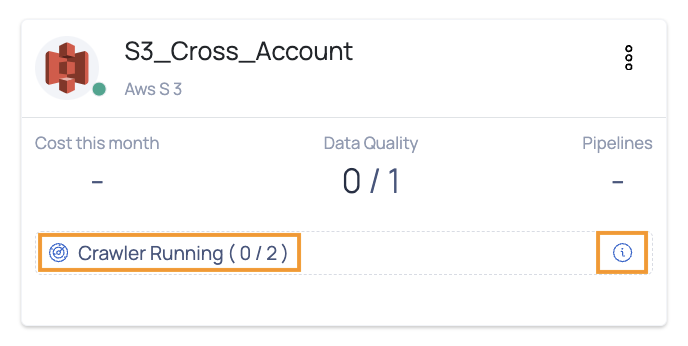
During the crawling process, you can monitor the live status of the crawler at the bottom of the card. Initially, the status will display as Crawler Started. When crawling begins, it will update to Crawler Running, showing both the total number of assets and the number of assets currently crawled.
You can hover over the
Service Monitoring
From V2.7.0 onwards you can see the current logs that are being generated by the analysis service that is operating on the dataplane side. You will also be able to view the running logs on data sources that are generated by the crawlers.
To utilize this, follow these steps:
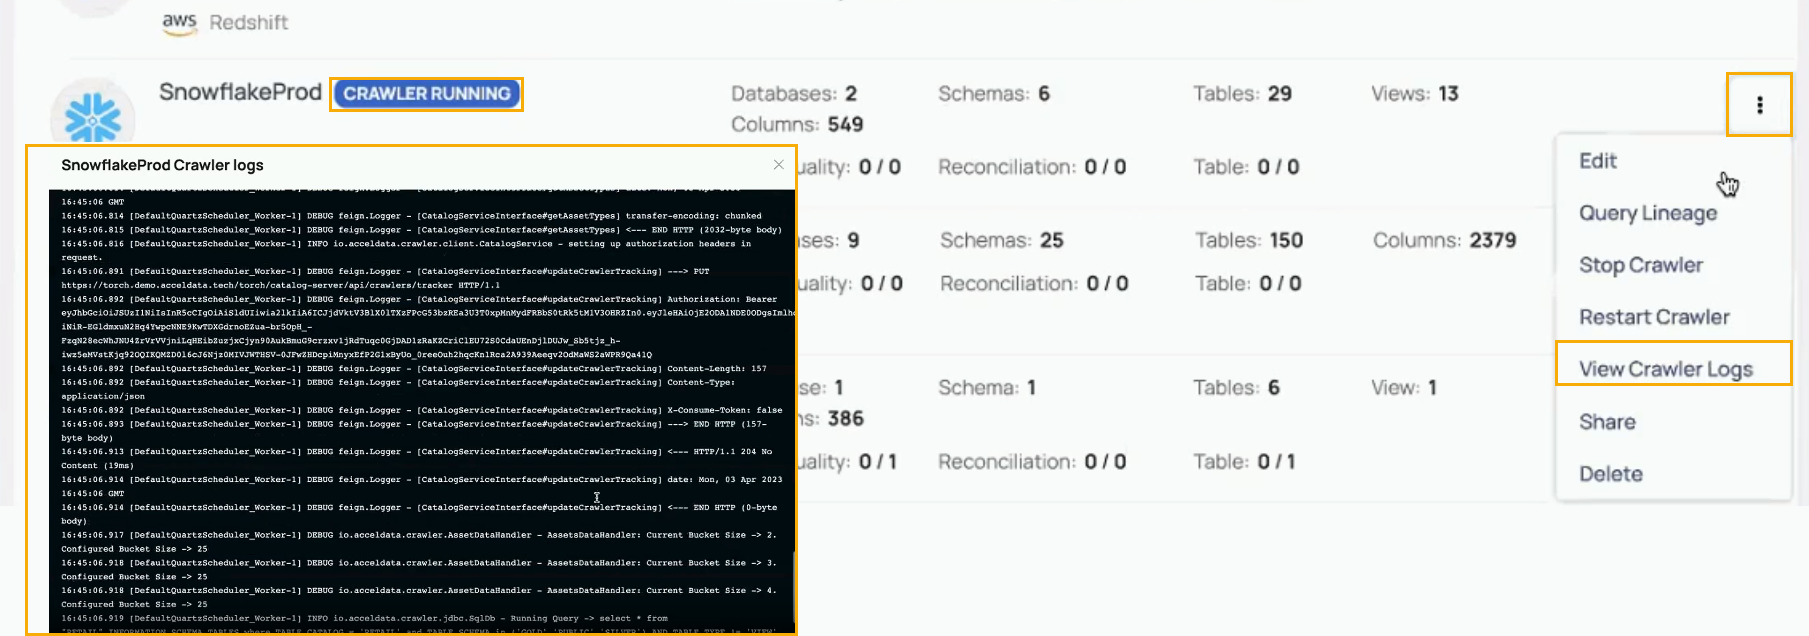
- Start the crawler by selecting the vertical ellipsis icon on the right side of the data source.
- Navigate and select the Start Crawler option. The status will change to Crawler Starting.
- After the Crawler status is changed to Running. Select View Crawler Logs.
You can now see the logs in a new screen.
Service Monitoring
Single Asset Crawling
Acceldata provides you with an option to crawl either a single asset or select specific assets to add to an existing Snowflake, Redshift, or Databricks data source. This way, you can avoid the need to crawl the entire data source whenever new tables, columns, schemas, catalogs, or databases are added, saving valuable time and resources.
Performing this action is not possible through the ADOC user interface; instead, it must be executed via the API by appending the 'assets' variable to the API request URL, followed by the asset UIDs.
For example, suppose you have an existing data source named 'Databricks_Unity_Catalog_DS' and you wish to crawl only the 'employee3' table within it. The request URL would appear as follows: https://acceldata/catalog-server/api/crawler/Databricks_Unity_Catalog_DS?assets=Databricks_Unity_Catalog_DS.torch_catalog.employee.employee3
In a similar manner, you can include multiple assets by separating their UIDs with commas.
Query Lineage
The Query Lineage option allows you to get the details of SQL queries. You must provide an SQL command as an input and you can view the path traversed by data from the source database to destination database, as the output of Query Lineage. You can thus avoid scanning the stored procedures manually and use this automated path to track query journey. This option is applicable only to Snowflake and Databricks Data Sources.
To use Query Lineage:
- Click the kebab menu icon for the Databricks Data source.
- Select the Query Lineage option.
- Execute the steps in the Query Lineage#tab-lineage:lineage document to add a Query Lineage.
Delete Data Source
You can delete unwanted Data sources, by using the delete option under the kebab menu. Once you delete a Data Source, all the data related to it in the Compute and Data Reliability capabilities are also erased from ADOC.
To delete a Data Source:
- Click the kebab menu icon for the Databricks Data source.
- Select the Delete option.
- Click Yes to confirm.
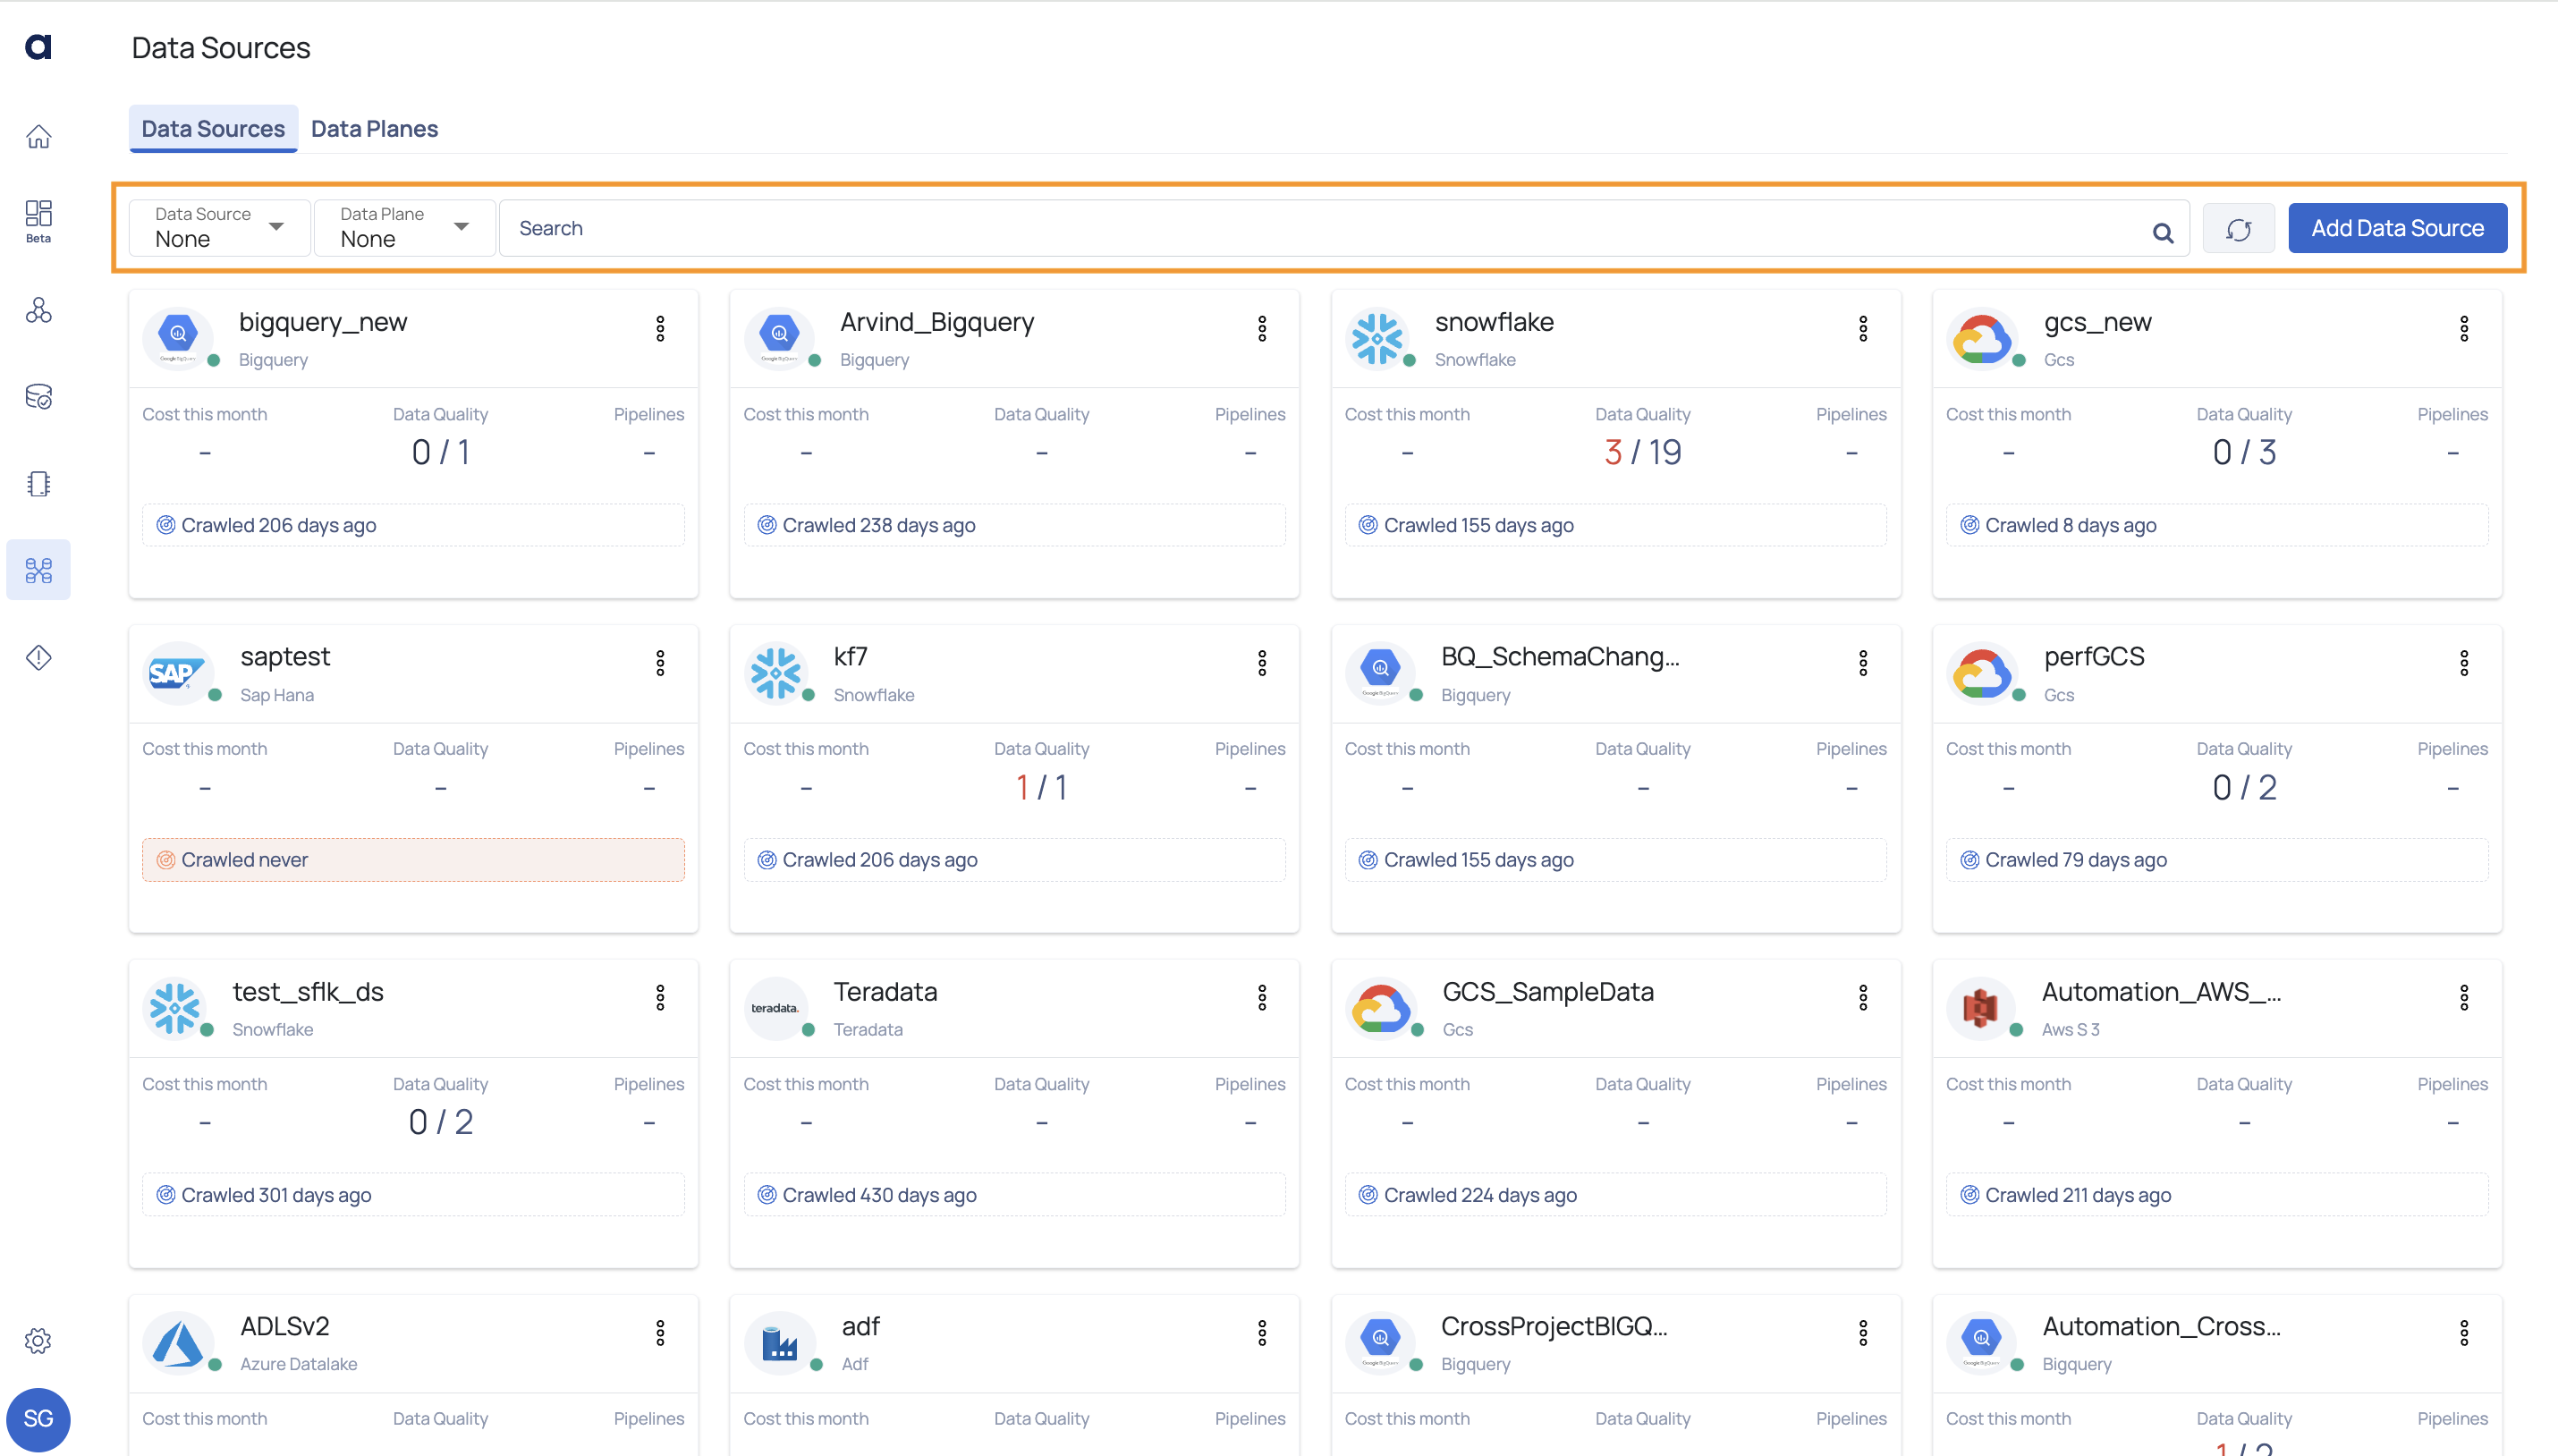
Search, Filter, and Refresh Data Sources
You can search for a specific Data Source on the Data Sources tab by using the search bar. You can search a Data Source with the name. You can refresh the Data Sources page to view the latest Data Sources added to ADOC. You can filter data sources to view data sources specific to an integration.