Databricks Query Studio

Query Studio Tab
The Query Studio page offers information about your clusters' metrics. On this page, you can use local page level filters (found in the left pane) as well as the Global Calendar filter.
Query Studio allows you to view your historical queries. You get an option to view real time queries on Databricks. This page allows for advanced filtering and also the ability to abort running queries. One of the key features is the ability to view similar queries using a concept called fingerprinting. The queries that are similar are grouped together with the same fingerprint ID. This allows you to get a bird's eye view of the number of similar queries being raised with other relevant statistics.
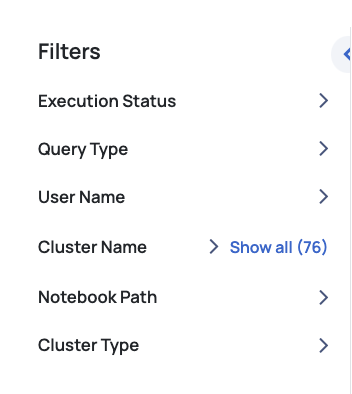
Filters
The Data Source Filter allows you to switch the Databricks data source. This enables you to view and analyze data across various sections based on the selected Databricks account or project, providing flexibility for monitoring and managing information across different data sources.
You can apply filters to view data specific to execution query status, cluster name and cluster type. These filters are contextual (for example, if you select a specific cluster in the filter, only the databases of that cluster are displayed in the database filters). You can also apply global calendar filters in the heatmap, to view the date and time when data was last fetched from Databricks. You can refresh the screen to fetch the latest data from Databricks.
| Name | Description |
|---|---|
| Execution Status | Filters results based on the status of the execution, such as completed, failed, or in progress. |
| Query Type | Filters results by the type of query, such as SQL, Python, or other execution types. |
| User Name | Filters results by specific users who initiated the tasks or queries. |
| Cluster Name | Filters results by the names of clusters used to run tasks or queries. |
| Notebook Path | Filters results based on the file path of the notebooks where the tasks or queries are executed. |
| Cluster Type | Filters results by the type of cluster, such as all-purpose, job-specific, or other cluster categories. |
| Widget | Description |
|---|---|
| Query Aggregate Table | The Query Aggregate table aggregates similar queries together to form a Query Fingerprint. You can view all the details of aggregated queries in this table. Alternatively, you can also view the query details individually without any fingerprint and also group by Users. |
| Query Fingerprint Table | In this table, each aggregated query group is assigned a unique ID called query fingerprint ID. You can drill down on the query fingerprint ID column to view the details of each individual query which are part of the Query fingerprint. When you apply any filters from the left pane, the data in the Query Aggregate table is refreshed as per the filters applied by you. The various columns included in the Query Aggregate table are described as follows: Sample Query: This columns displays the query used. Click the copy icon to copy the query to your clipboard. Clicking on the query will navigate you to the Query Details page. Distinct Warehouses: The number of unique warehouses. Query Count: The number of queries grouped as a result of query fingerprint process. Cloud Services Credits: The total number of credits consumed by the Query fingerprint. Query Cost: The estimated resources consumed by a database query, used to evaluate and optimize performance. Avg Execution Time: The average execution time of the queries which are grouped as part of the fingerprint. Max Execution Time: The maximum execution time of the queries which are grouped as part of the fingerprint. Median Execution Time: The median value of the query execution time of the queries which are grouped as part of the fingerprint. Median Queued Provisioning Time: The median value of the queue provision time of the queries which are grouped as part of the fingerprint. Avg Compilation Time: The average compilation time of the queries which are grouped as part of the fingerprint. Avg Total Elapsed Time: The average value of the total time elapsed in executing the queries, grouped as part of the query fingerprint process. This table displays filters which allow you to select the top 50 queries in various categories. The categories supported are Top 50 expensive queries, Top 50 long running queries, and so on. When you select any category, the filters in the left panel are automatically updated as per the selected category. All the left panel filters only display 50 queries which belong to the category selected. |
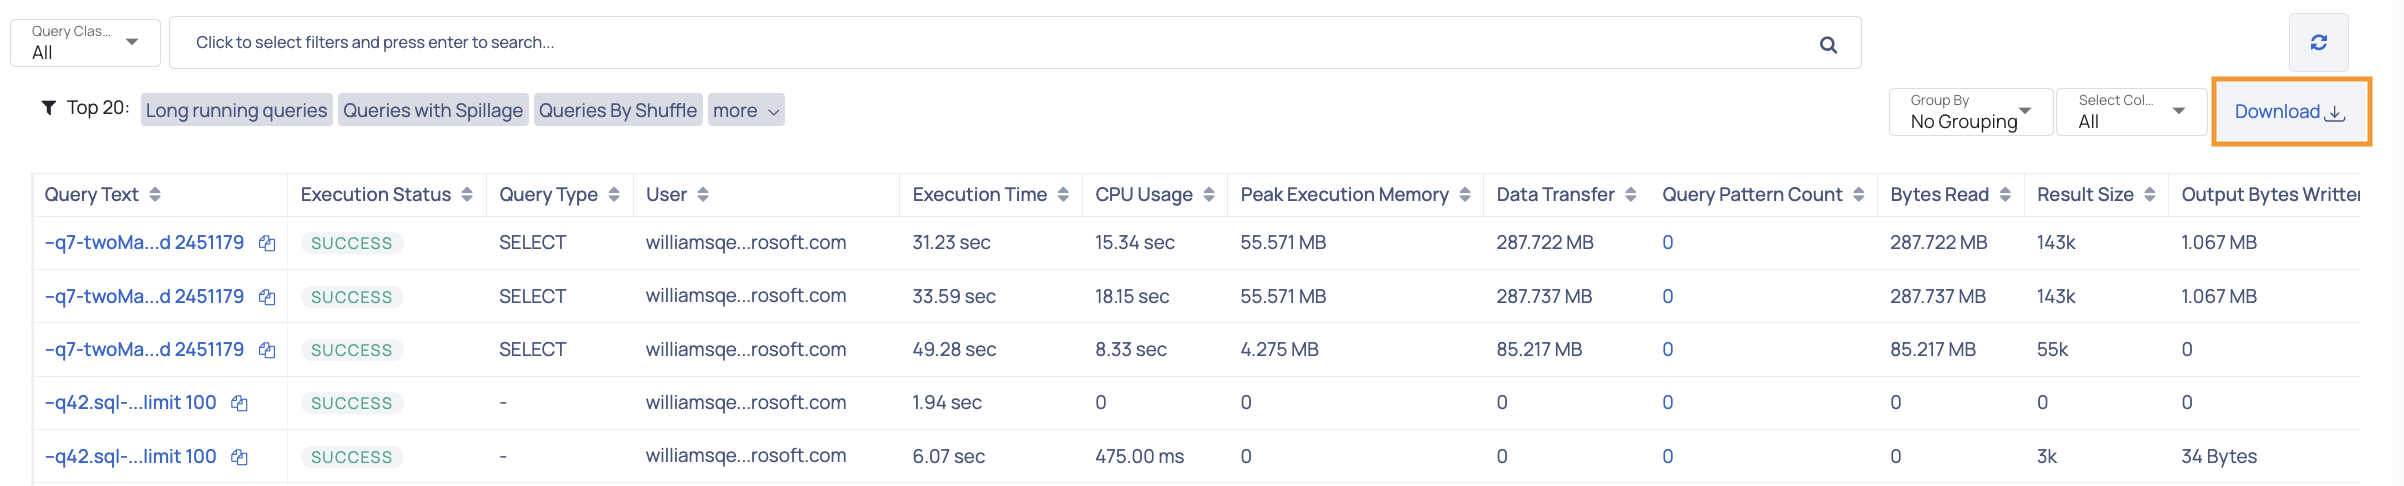
| No Grouping Table | This table displays data about all the individual queries. There is no fingerprinting in this view. The various columns displayed in this table are as follows: Query Text: The actual query. You can copy the query by clicking the copy icon. Query Id: The unique ID of the query. Execution Status: The execution status of the query. User Name: The username of the user who crated and executed the query. Query Cost: The estimated cost of the query execution. Credits Used Cloud Services: The cloud service credits consumed by the query. Warehouse Name: The name of the warehouse in which the query exists. Note You can now click on the Warehouse Name. It will take you to the Query Details page, where you can view details such as the actual cost incurred for a selected Snowflake query. Total Elapsed Time: The total time spent for the query execution to complete (including time spent in queue). Start Time: The date and time when the query execution started. End Time: The date and time when the query execution ended. Bytes Scanned: The total amount of data scanned by the query (in bytes). Rows Produced: The number of new rows created y the query. Warehouse Size: The size of the warehouse in which the query executes. Query Type: The type of query based on operation performed (for example, Select query selects some data, Update query updates existing data). Database Name: The name of the database in which the query executed. Schema Name: The name of the database to which the query belongs to. Execution Time: The total time taken for the query to execute. Compilation Time: The total compilation time of the query. Partitions Scanned: The number of partitions scanned by the query. Partitions Total: The total number of available partitions. % Partitions Scanned: The percentile value of total scanned partitions: (partitions scanned/total partitions)*100. Error Code: The error code encountered during query execution (if any). Error Message: The error message received during query execution (if any). Queued Provisioning Time: The total queue provisioned time of the query. Queued Repair Time: The total queued repair time of the query. Queued Overload Time: The total queued overload time of the query. Transaction Blocked Time: The transaction blocked time of the query. Bytes Spilled to Remote Storage: The bytes of data stored by query on a remote storage location. Bytes Spilled to Local Storage: The bytes of data stored by query on a local storage location. |
| Group By Users | This filter allows you to group by users displaying a table with the following columns: User Name: Displays the names of the users who have executed queries. It helps identify the individuals responsible for query executions. Query Count: The Query Count column showcases the total number of queries executed by each user within the specified grouping. It provides insights into the query workload of each user. Avg Execution Time: The Avg Execution Time column presents the mean duration taken by queries executed by a user. It offers an overview of the typical time taken for query completion. Max Execution Time: Max Execution Time shows the longest duration taken by any query executed by a user within the selected group. It highlights the maximum time taken for query execution. Median Execution Time: Max Execution Time shows the longest duration taken by any query executed by a user within the selected group. It highlights the maximum time taken for query execution. Total Credits: Total Credits column illustrates the cumulative credits consumed by a user for their query executions. It quantifies the overall resource consumption for each user's queries. Query Cost: The Query Cost column provides an approximation of the cost incurred by a user for their query executions. It offers an estimation of the monetary value associated with resource usage. |
Export Raw Data
You can download data as a CSV for the current page, with all applied filters accurately reflected. This ensures that the exported data matches your selected view and filter criteria.
Query Detail View
When you click on any query in the No Grouping table, you can view the Query Detail view.
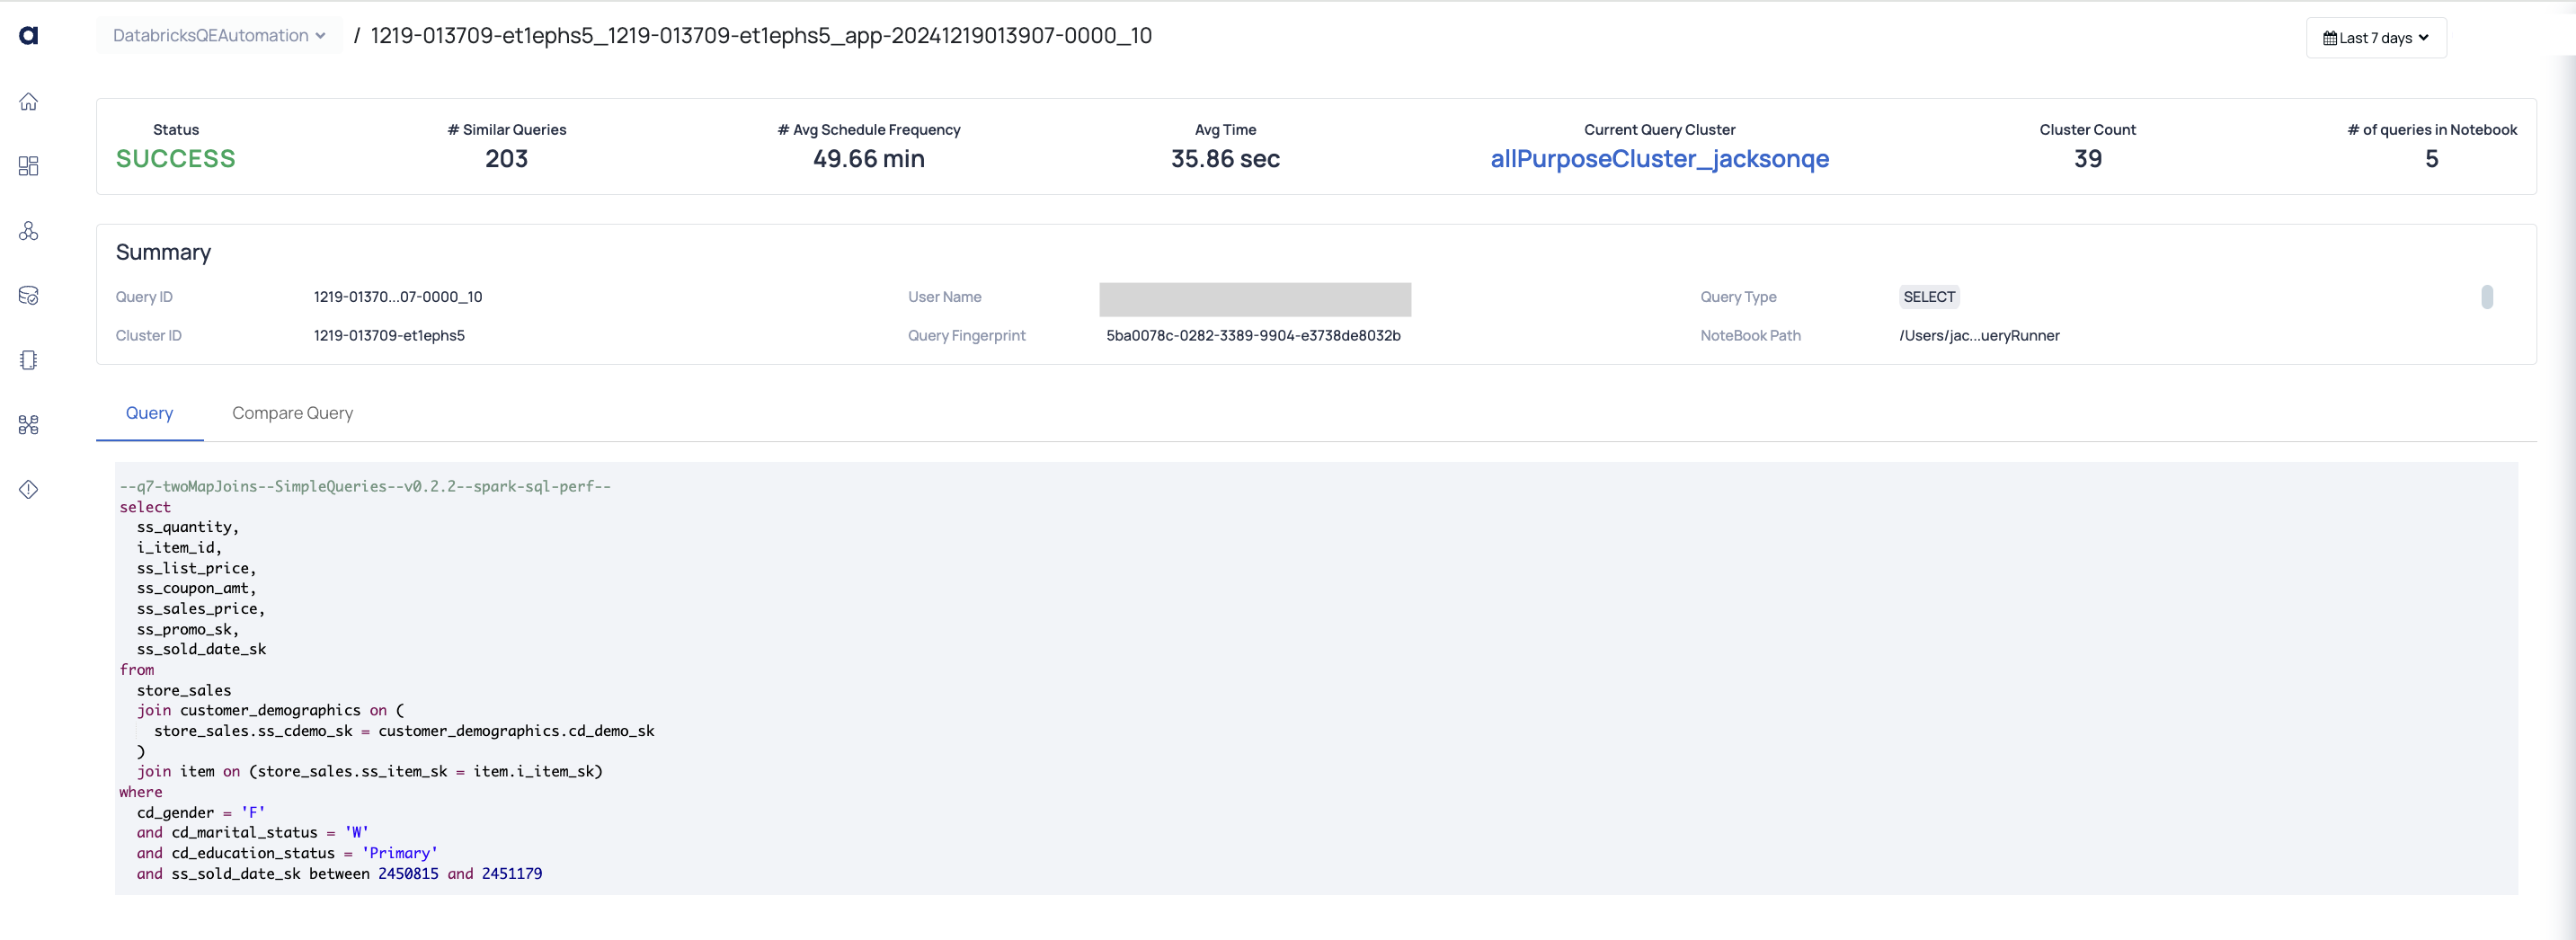
The Query Detail view displays the following information.
Metrics
- Status: Displays the result of the query execution.
- # Similar Queries: The number of queries that are similar to the query, whose detailed view is open.
- # Avg Schedule Frequency: The average number of days between successive runs of a scheduled job. ASK
- Avg. Time: The average execution time of the query.
- Current Query Cluster:
- Cluster Count: The number of clusters used by the query.
- # of Queries Notebook: Total queries in the notebook.
Summary
- Query ID: Unique identifier for the query.
- Cluster ID: Identifier for the cluster used.
- User Name: The user who executed the query.
- Query Fingerprint: Unique hash for the query structure.
- Query Type: SQL operation type (e.g., "SELECT").
- Notebook Path: File path of the notebook.
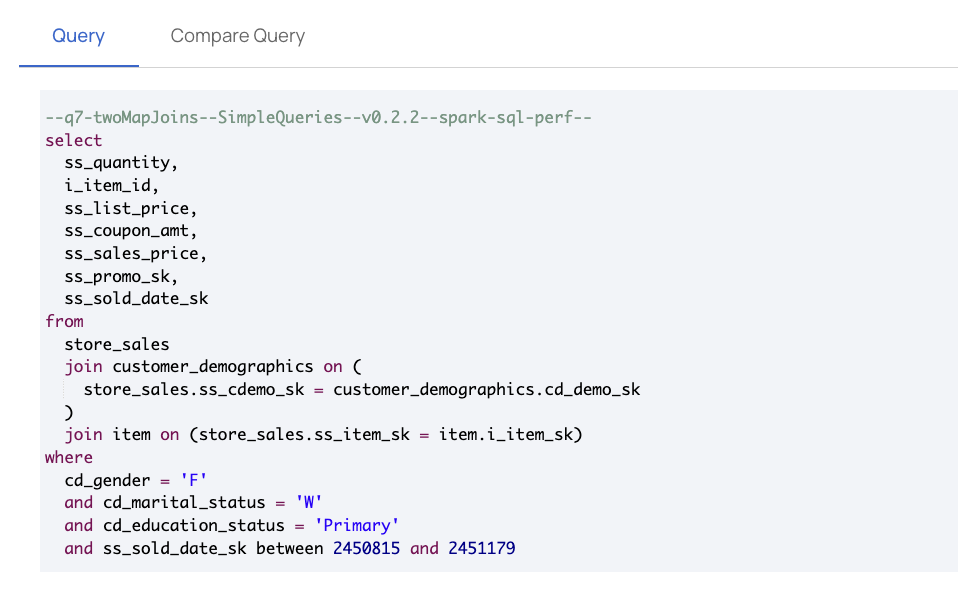
Query
This section displays the actual query text in full and also the execution status. You can also view the query ID.
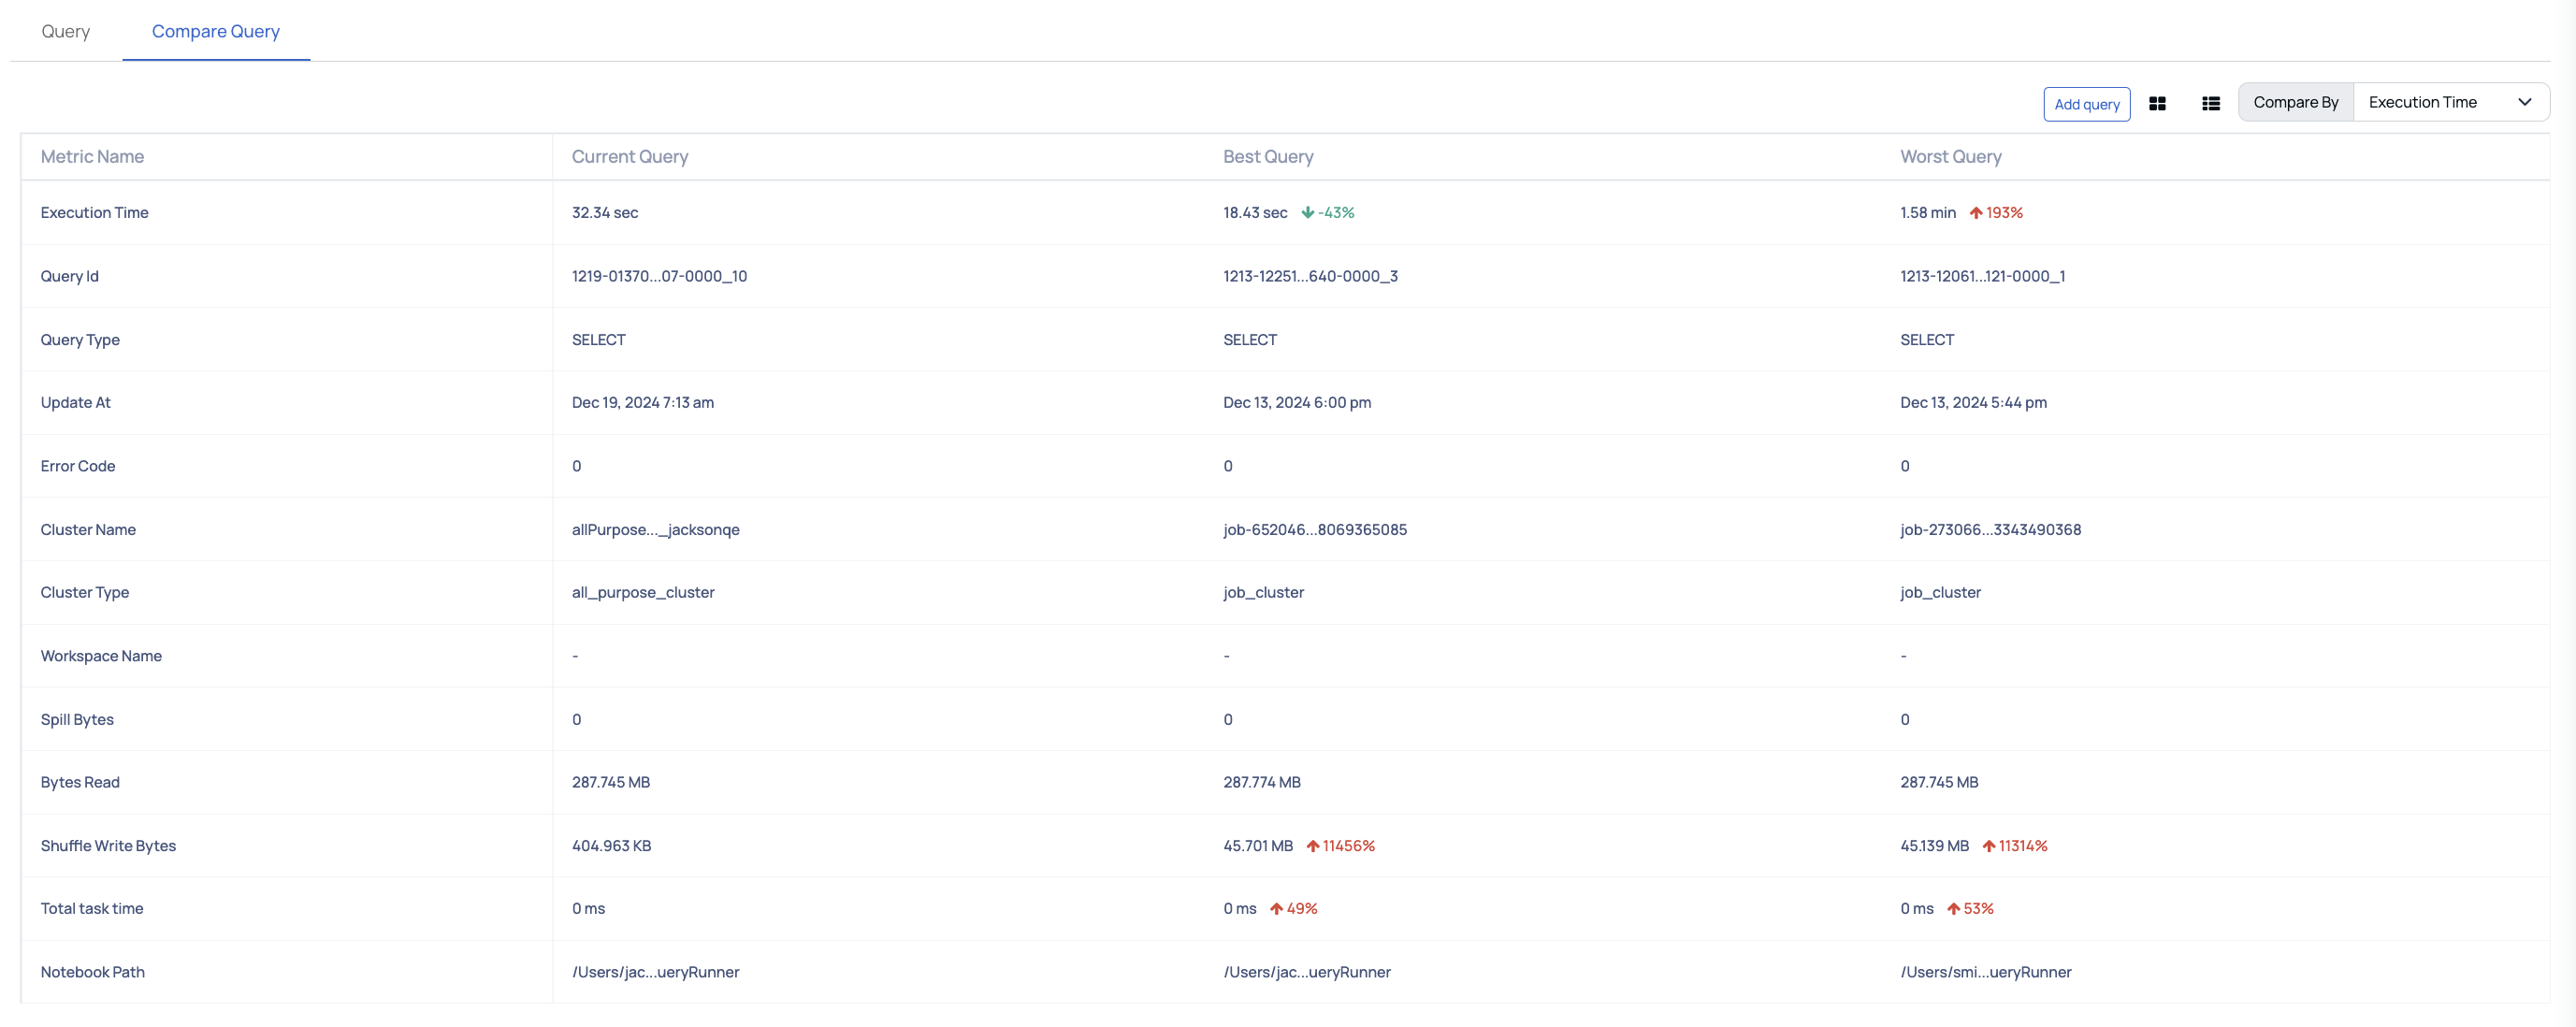
Compare Query
This is a table which displays comparative data of the current query with the best and the worst queries. You can choose one of the following as the comparison parameter.
- Execution Time: This parameter compares the execution time of the query against the best and worst queries for this parameter. You can also see the percentile value by which the best query betters the current query for this parameter and also the percentile value by which the current query betters the worst query.
You can also compare any the query with any other specific query by using the Add Query option.