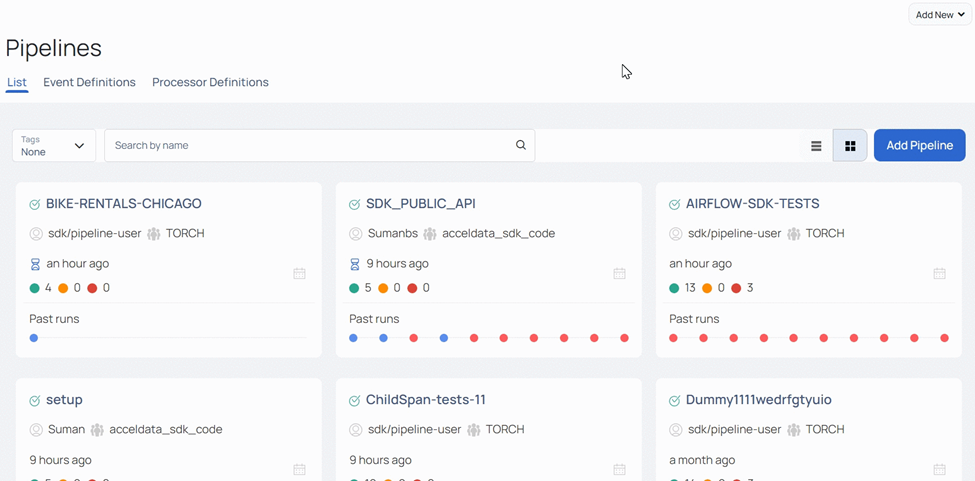
Pipeline Home
Filters
The various components of Pipeline list view are as follows:

| Filters | Description |
|---|---|
| Pipeline Run Status | You can use this filter to view pipelines based on execution status. |
| Alert Severity | You can use this filter to view pipelines based on the severity of the alert status raised in the pipelines. |
| Alert Type | You can use this filter to view pipelines based on the type of the alert status raised in the pipelines. |
| Policy Type | You can use this filter to view pipelines based on the status of the policies, created on the pipeline components. |
| Tags | You may now filter the pipelines based on tags and even search for tags by clicking the dropdown button. |
| Data Sources | You can use this filter to view pipelines based on the data sources on which they are created. |
| Search Box | The Pipeline search box allows you to search pipelines by pipeline names. |
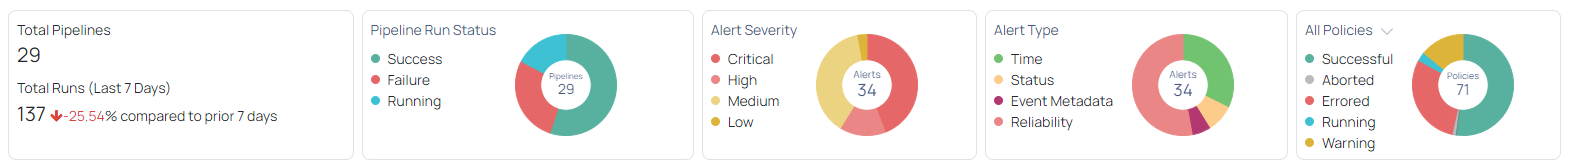
Pipeline Widgets
The Pipeline widgets graphically display important information about the Pipelines. The various widgets present on the Pipeline list view are as follows:
| Widgets | Descriptions |
|---|---|
| Total Pipelines and Total Runs | This widget displays two values: total pipelines and total runs. The first figure represents the number of pipelines established in your ADOC, while the second value represents the total number of pipeline executions in the last 7 days. |
| Pipeline Run Status | This is a donut chart that indicates the status of several pipeline executions. Hover over any section of the donut to view the value of the portion. The donut chart also works as a filter. When you click a specific portion of the donut, the pipeline list view is filtered to show just the values that match the selected donut portion, and the selected filter in the filters section is automatically updated. |
| Alert Severity | This is a donut chart that depicts the pipelines' varying alert severity. You may see the value of any section of the doughnut by hovering over it. The donut chart also works as a filter. When you click a specific portion of the donut, the pipeline list view is filtered to display just the values that match the selected donut portion, and the selected filter in the filters section is automatically updated. |
| Alert Type | This is a donut chart that displays the pipeline's multiple alert types such as Time and Status. Hover over any part of the donut to view its value. The donut chart also works as a filter. When you click a specific donut portion, the pipeline list view is filtered to show just the values that match the selected donut portion, and the selected filter in the filters section is automatically updated. |
| Policies | This donut chart displays status of various policies used in Pipeline components. You can filter the statuses to select policy type from the drop-down menu. The donut chart also acts as a filter. When you click a specific portion of the donut, the pipeline list view is filtered to display on those values which match the selected donut portion and the selected filter is automatically updated in the filters section. |
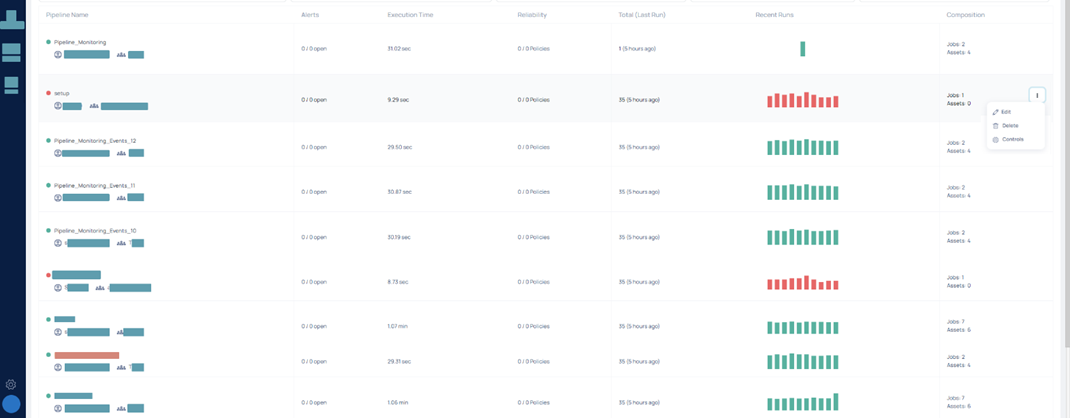
Pipeline Table
The Pipeline table displays a list of pipelines. This list is dependent on the filters applied in the filters section and donut charts. The various columns present in this table are as follows.
| Columns | Description |
|---|---|
| Pipeline Name | The name of the pipeline. |
| Alerts | The number of alerts triggered on Pipeline. |
| Execution Time | The execution time of the pipeline. |
| Reliability | The number of policies on pipeline components. |
| Total (Last Run) | The total number of pipelines runs with the last run time in the brackets. |
| Recent Runs | The status of executions in the recent runs. |
| Composition | The number of jobs and assets in the pipeline. |
How to create or add a Pipeline?
To create a new pipeline, click the Add Pipeline button.
The Add Pipeline wizard is displayed.
The following table describes the parameters to be entered in the Add Pipeline wizard:
| Fields | Description |
|---|---|
| Name | Name of the pipeline. |
| UID | UID of the pipeline. |
| Description | Description of the pipeline. |
| Owner | Name of the owner. |
| Team | Name of the team. |
| Code Location | It is the metadata of a pipeline describing the location of the code that defines the pipeline. |
| Context | Annotation of the pipeline. |
| Pipeline tags | Add tags for the pipeline. |
Click the Save button to add the pipeline.
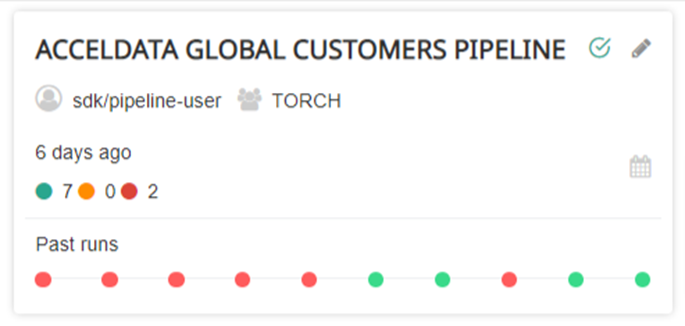
Pipeline Card
All registered pipelines are displayed as pipeline cards. The following picture displays a registered pipeline card:
| Field | Description |
|---|---|
| ACCELDATA GLOBAL CUSTOMERS PIPELINE | Name of the pipeline. |
| sdk/pipeline-user | Owner of the pipeline. |
| TORCH | Team associated with the pipeline. |
| 6 days ago | Last time the pipeline was run |
The Pipeline card also displays the past runs. The Green dots indicate successful runs and red dots indicate failed runs. The number of successful runs and failed runs are also displayed.