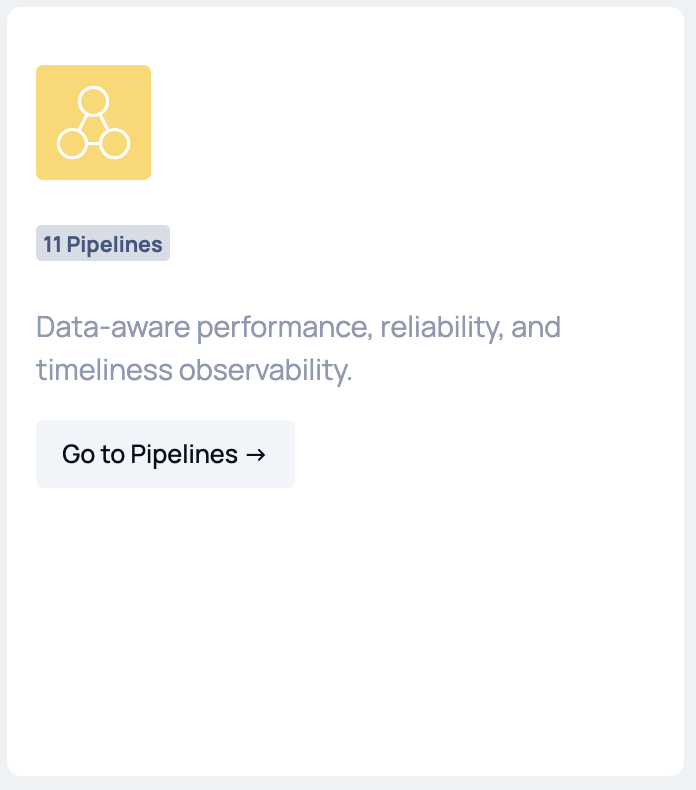
Home
Upon successful sign-in to ADOC, you are taken to the Home page, where you can explore an overview of Acceldata's capabilities and effortlessly navigate to specific dashboards or perform relevant actions.
If you are accessing ADOC for the first time, the Home page will not show any data. To start, click on Add Data Source .
Home Page
From here, you can view the following panels:
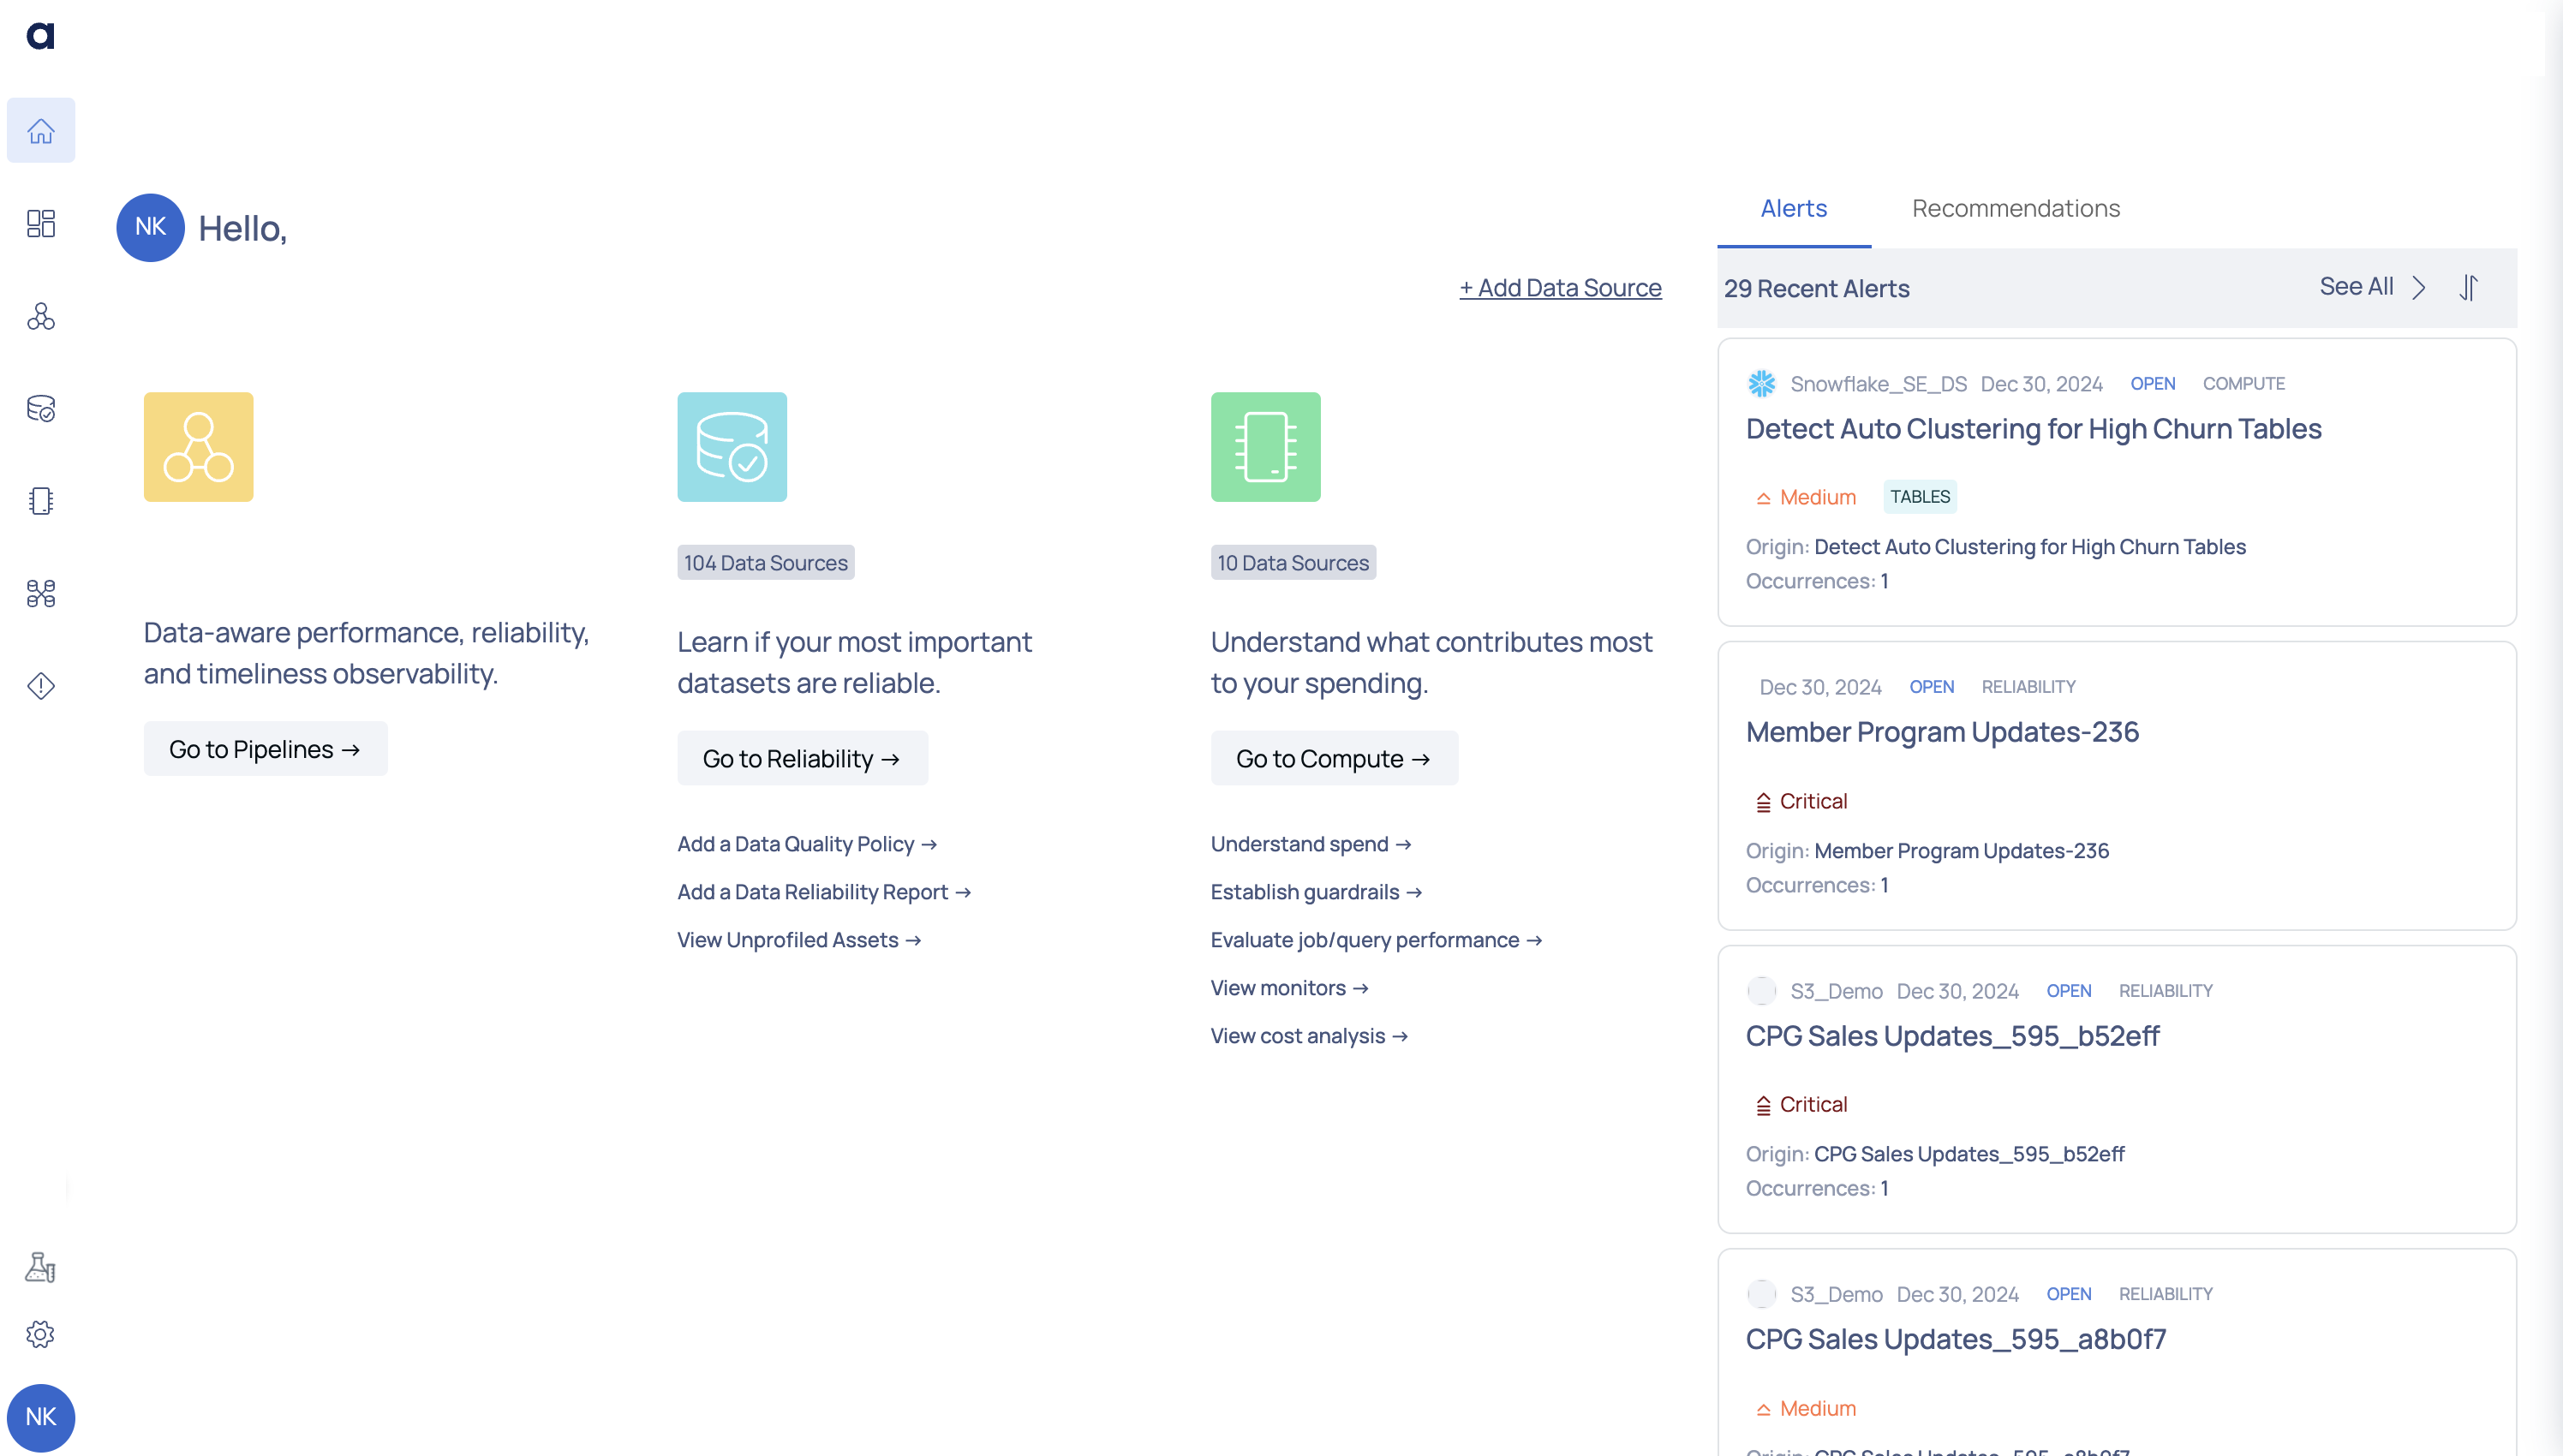
Compute
This capability allows you to take proactive control of costs to achieve maximum data ROI, optimize your expenditure, eliminate cost overruns, and allocate resources efficiently. You can also mitigate outages, streamline operations, and achieve operational excellence.
Clicking on the Go to Compute button navigates you to the Compute dashboard. To learn more about our compute capabilities, see Observe Snowflake documentation.
Within this panel, you can perform the following actions:
- Understand spend: Navigate to the Cost dashboard by clicking this link.
- Establish guardrails: Clicking this link displays a list of available data sources. Choose the desired data source to view its guardrails information.
- Evaluate job/query performance: Access a list of available data sources by clicking this link. Select the desired data source to evaluate its performance.
- View monitors: Clicking this link directs you to the Monitors List dashboard.
- View cost analysis: Access the Chargeback and Budget dashboard by clicking this link.
Compute Panel
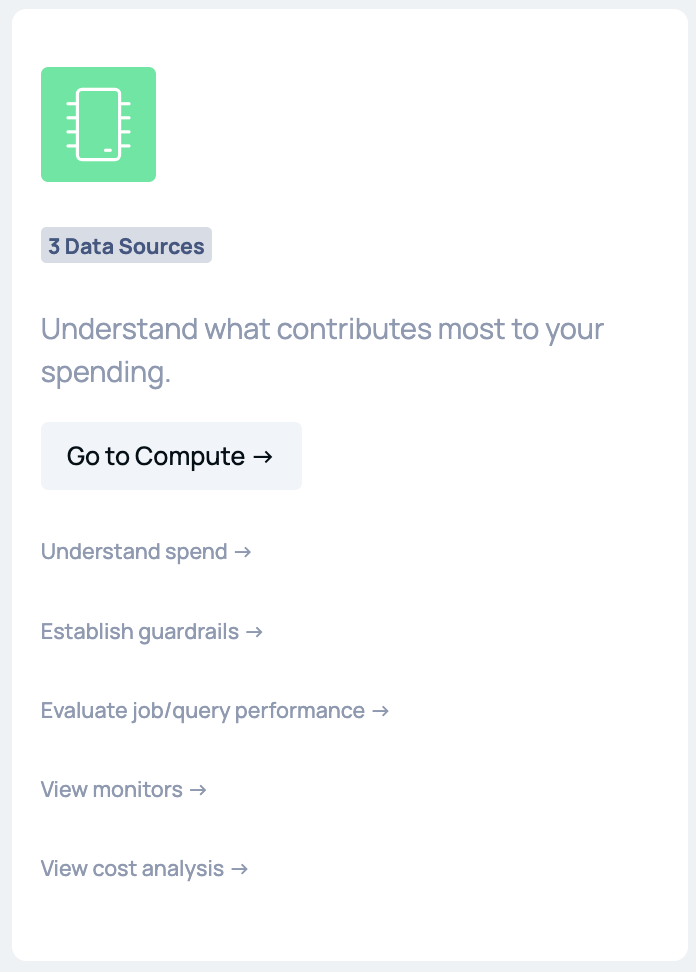
Reliability
This capability ensures that you achieve optimal data quality and eliminate data outages. At the same time, you can gain comprehensive insights to identify, resolve, and proactively prevent data issues.
Clicking on the Go to Reliability button navigates you to the Reliability dashboard.
Within this panel, you can perform the following actions:
- Evaluate Data Reliability: Access the Data Reliability dashboard by clicking this link.
- View Unprofiled Assets: Navigate to the Unprofiled tab in the Discover dashboard to see all assets that haven't been profiled.
- Add a Data Quality Policy: Initiate the workflow to add a data quality policy by clicking this link.
- Add a Data Reliability Report: Visit the Report page by clicking this link.
Reliability Panel
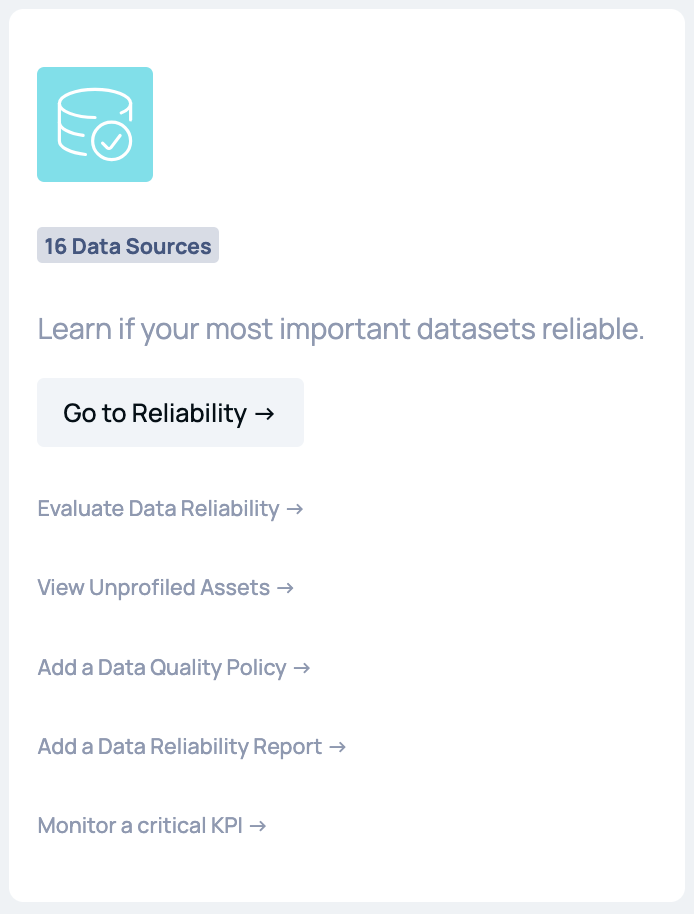
Pipelines
ADOC's pipeline monitoring feature allows you obtain end-to-end insights into your data and data pipelines. It provides comprehensive visibility into your data assets and pipelines from initiation to completion, ensuring accurate and timely delivery of data.
Clicking on the Go to Pipelines button navigates you to the Pipelines dashboard.
Pipelines Panel
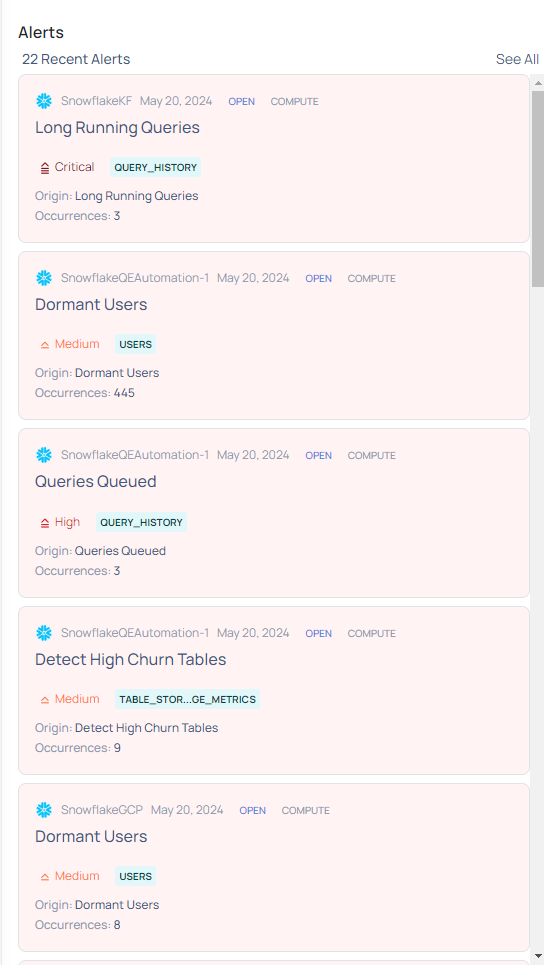
Alerts
This panel displays the most recent alerts to notify you about any unusual or unexpected data activity. They are triggered in response to predefined criteria or thresholds that indicate deviations from expected patterns.
Click See All to proceed to the Alerts page where you can view the list of all alerts raised.
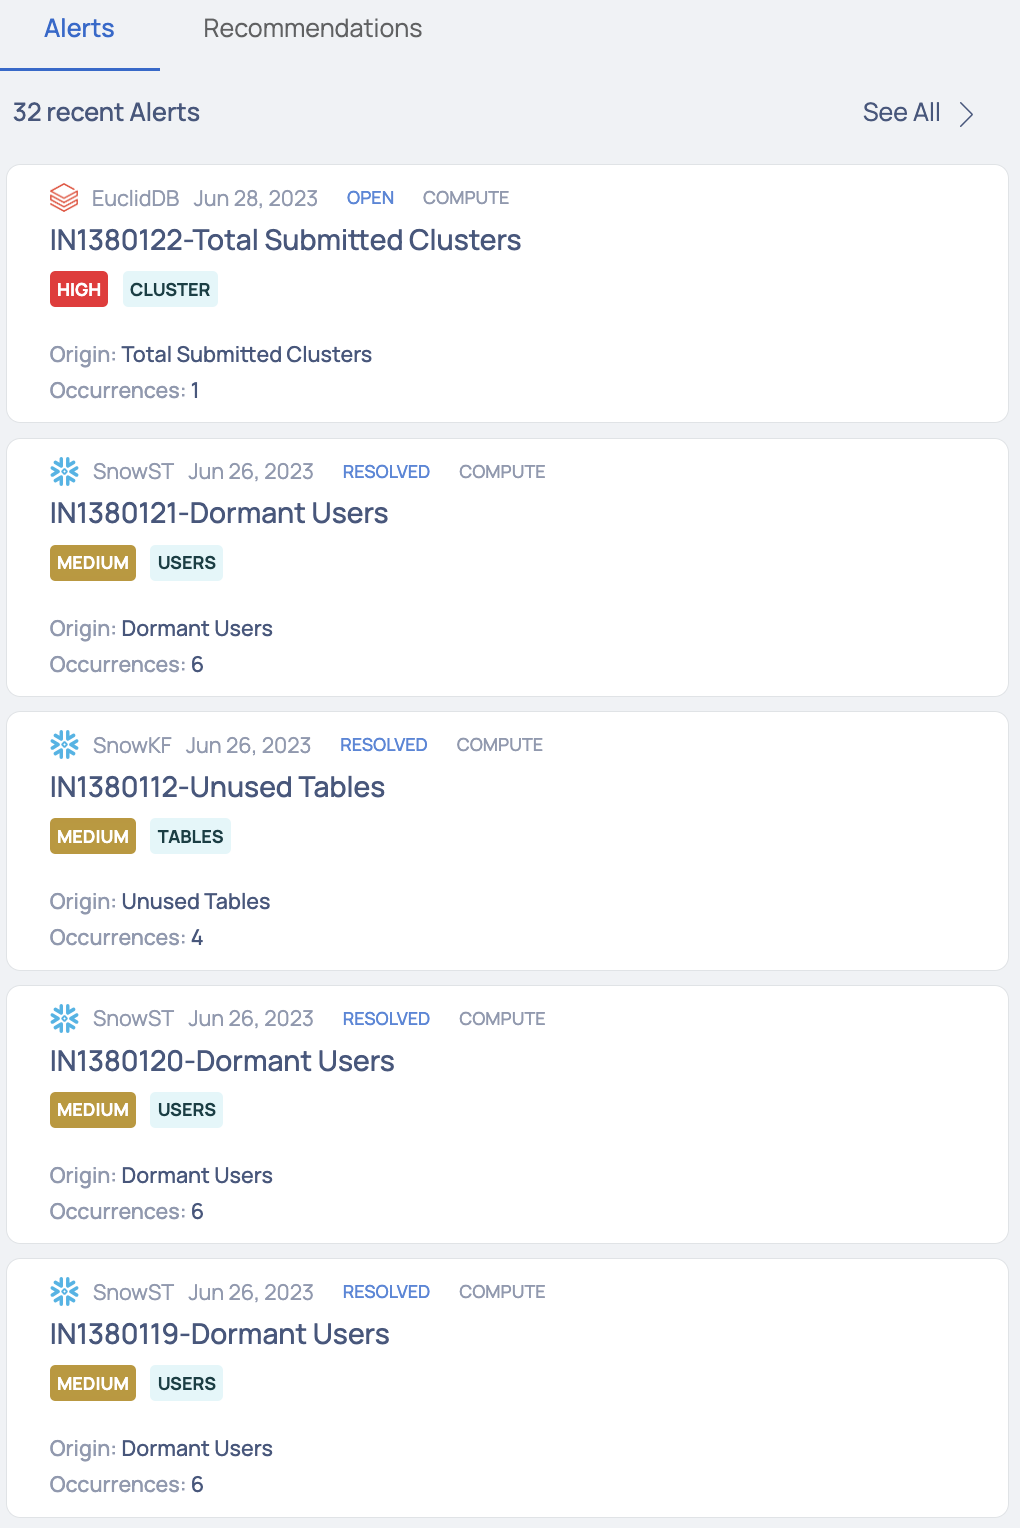
Alerts Panel
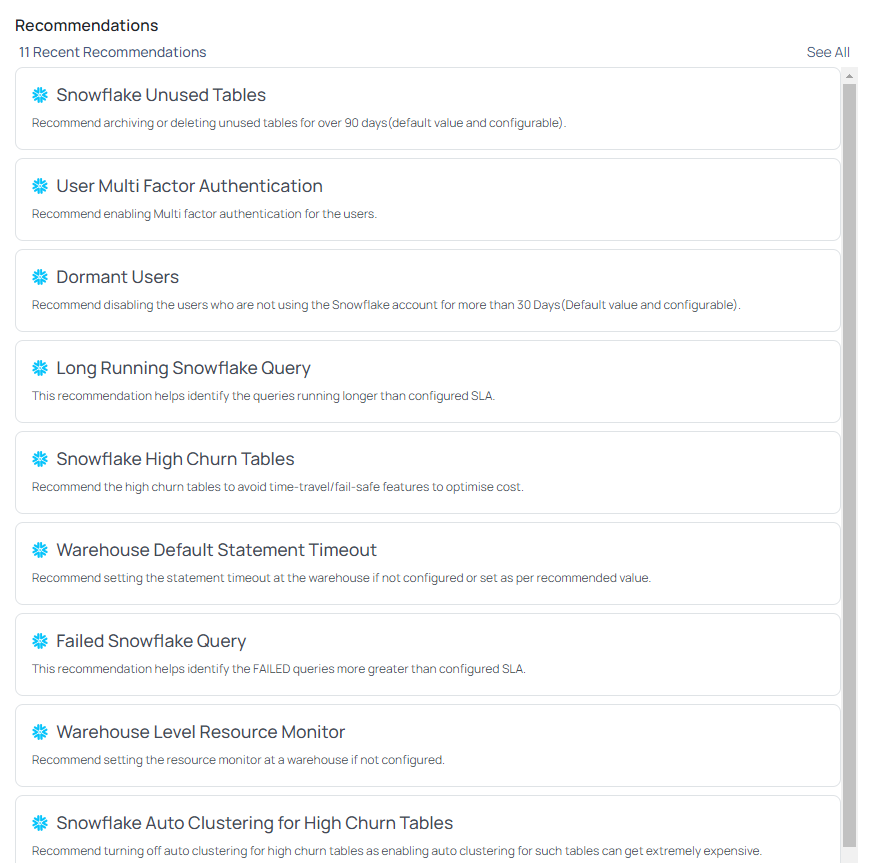
Recommendations
The Recommendations tab displays the recent recommendations provided to you as a user by ADOC. The recommendations are applicable for Snowflake and Databricks data sources. For more information, see Acceldata Recommendations.
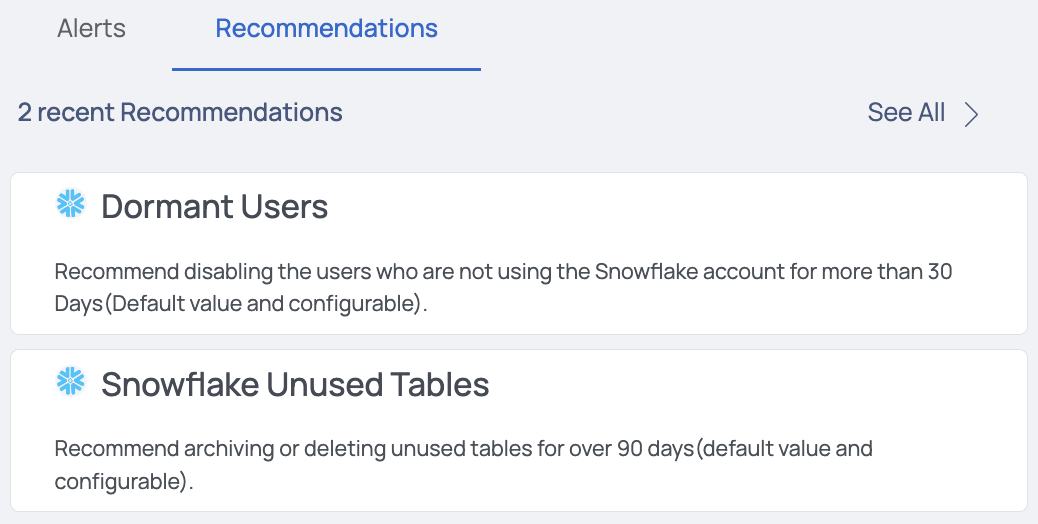
Recommendations Panel
Role Based View
The ADOC V3.5.0 update introduces significant changes to the Home page, enhancing user navigation and providing tailored views for different user personas. This guide will help you understand these changes and effectively use the new features.
The Home page now offers three distinct views:
- ADOC Home Page
- Platform Admin View
- Data Engineer View
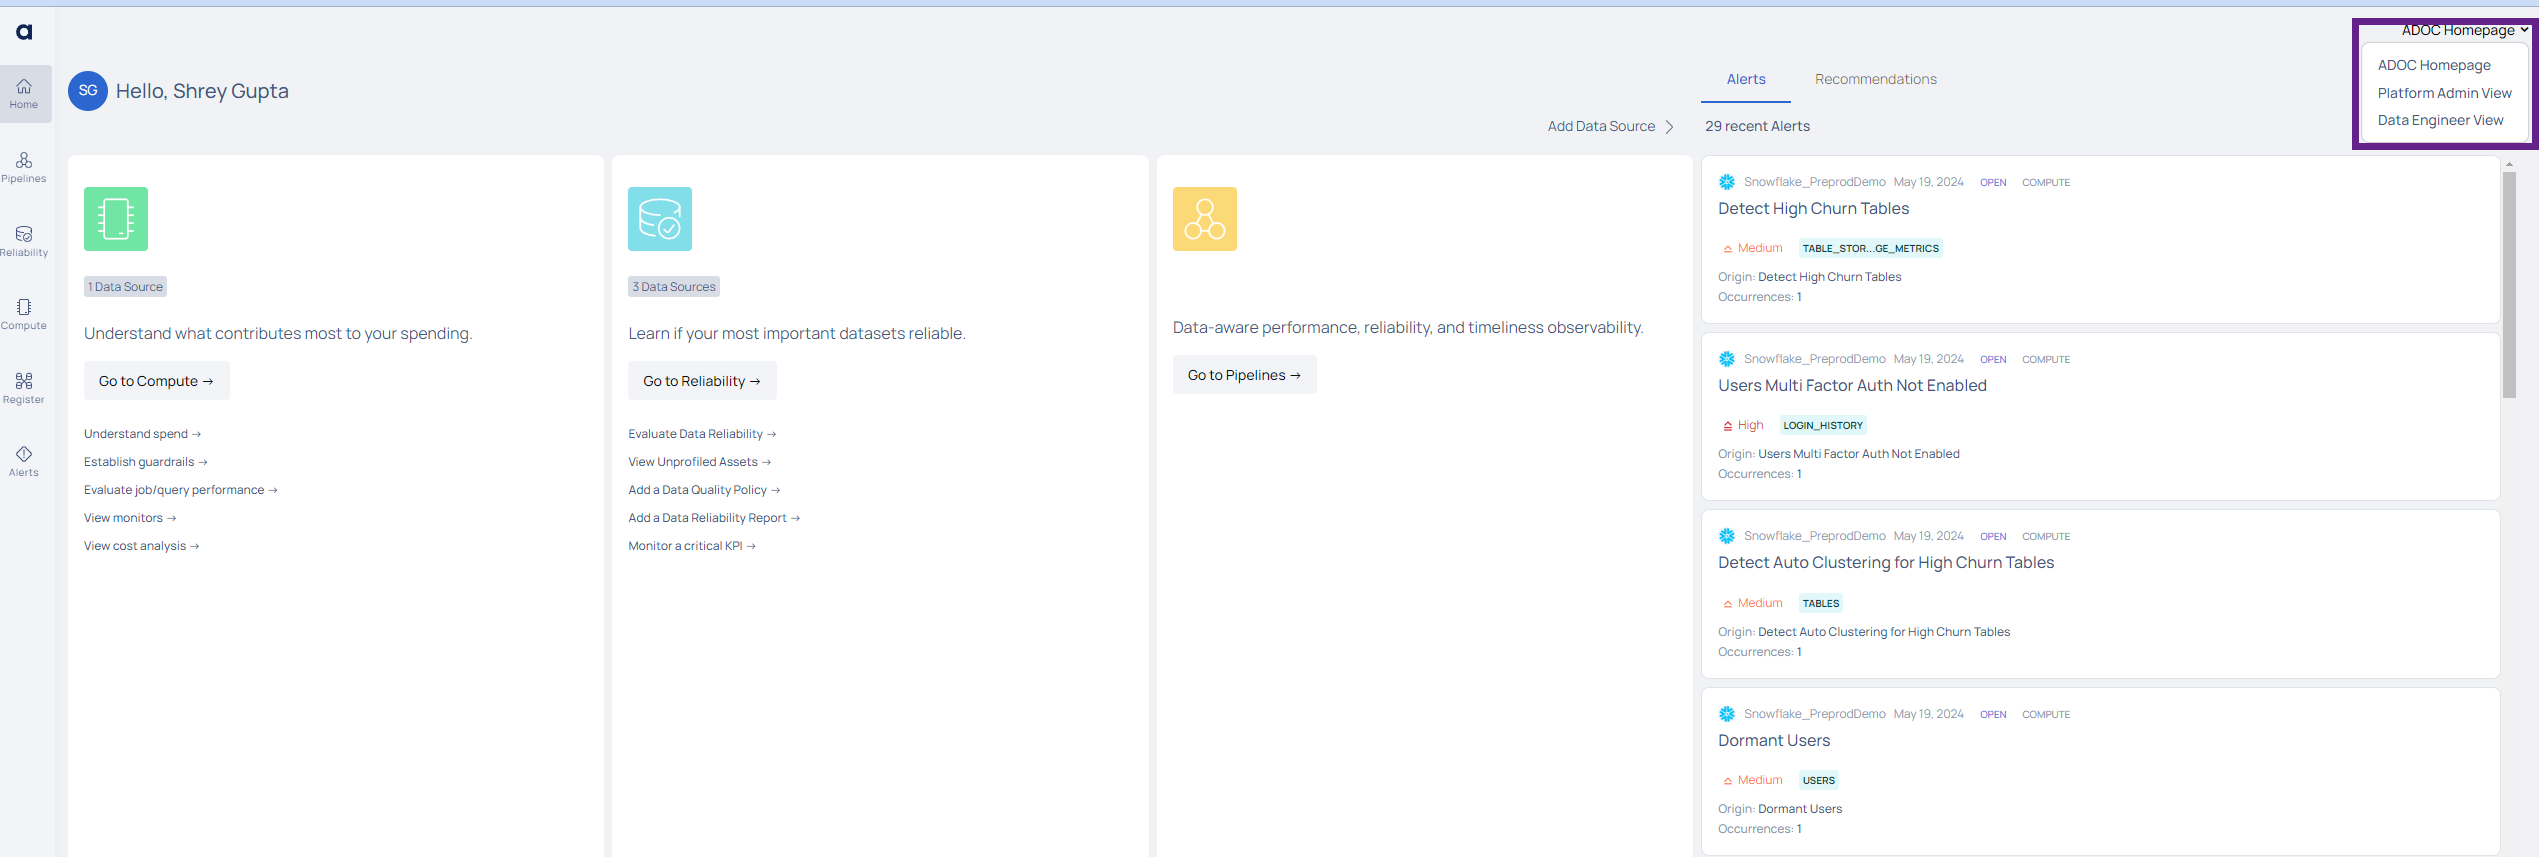
These views are designed to cater to the specific needs of different user roles within your organization.
Platform Admin View
The Platform Admin View is designed to provide comprehensive insights into cost optimization, operational efficiency, and budget management for platform administrators. This guide will walk you through the various components and features of this view.
- Insights into cost spikes and long-running jobs.
- Detailed cost savings analysis.
- Health metrics for overall system performance.
- Chargeback and budgeting information.
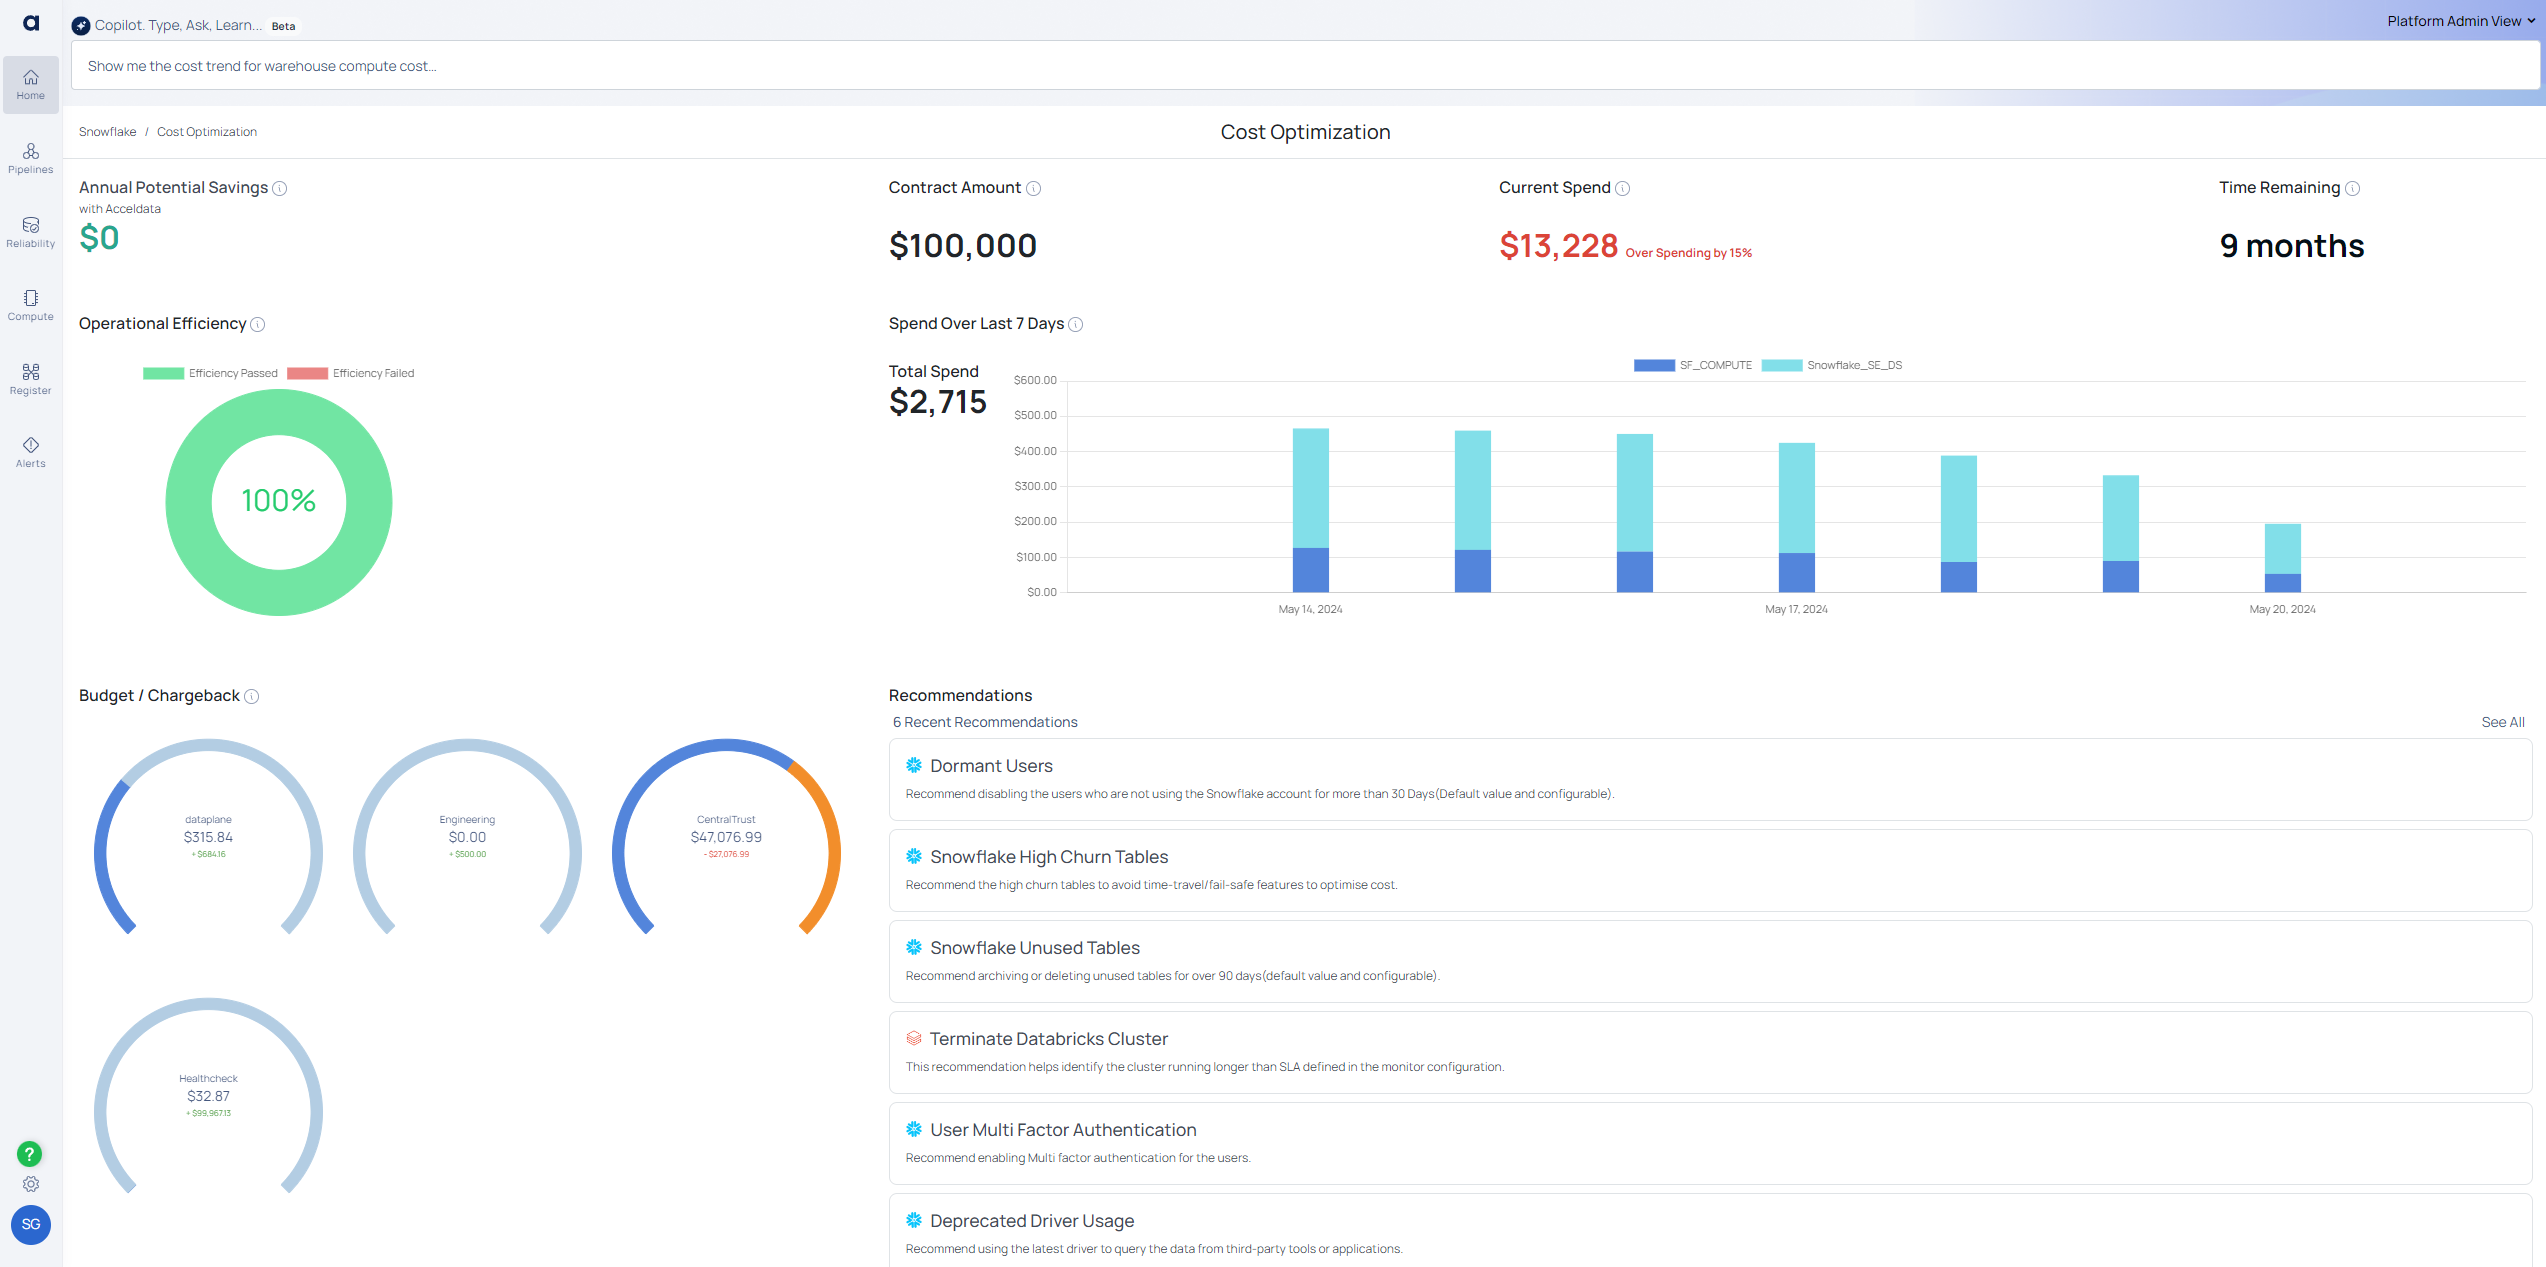
Copilot NLI Interface
The new Copilot Natural Language Interface (NLI) enhances user interaction with real-time suggestions and smart recommendations.

- Type-ahead suggestions for instant recommendations.
- Smart alternatives for ambiguous queries.
- Interactive dashboards for detailed analysis.
Cost Optimization Section

| Field | Description |
|---|---|
| Annual Potential Savings with Acceldata | This metric shows the potential savings a user can achieve annually by addressing inefficiencies identified by Acceldata. Note: Click on the field to view the detailed Annual Potential Savings page |
| Contract Amount | Displays the total contract amount allocated for the Snowflake services. Note: Click the field and select the data source to view the detailed organization wise cost view. |
| Current Spend | Shows the current spend against the allocated contract amount. This is updated in real-time. Note: Click on the field to view the Spend per Account graph. |
| Time Remaining | Indicates the remaining duration of the contract. |
This is the total annual projected potential savings in dollars that a client can save from their accounts on an annual basis; in other words, this component will identify potential leakages in the system and their associated costs.
In other terms, if a user has a leakage of $20 in the last day for a category - High span queries, if this trend continues, the user would have lost $7300 (20 x 365) annually. However, if proper actions are taken on Acceldata's recommendation, users could potentially save ~$7300. As a result, it motivates customers to take immediate action on the defaulting categories.
Operational Efficiency
The Operational Efficiency Score is a quantitative measure of the system's overall state. This score helps to identify potential problems and prioritize activities for optimization. Hover over the chart to see the efficiency percentage, then click the doughnut chart to see the operational efficiency across data sources.
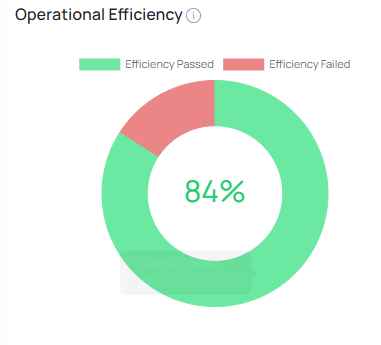
Monitoring the health of a system is critical for guaranteeing its efficiency, dependability, and performance. A complete health score is a quantitative indicator of the entire state of the system, assisting administrators in identifying possible concerns, prioritizing work, and making educated decisions to improve system performance. This measure provides the system's health score, with drill down capabilities that allow the platform owner to easily identify areas to improve on.
The data warehouse system's health is measured based on four essential components:
- Query Health
- Warehouse Health
- System Configuration
- Administrative Task
Budget/Chargeback
Displays the budget usage and chargeback information across different departments or business units. Each circle represents a different business unit with its budget status.
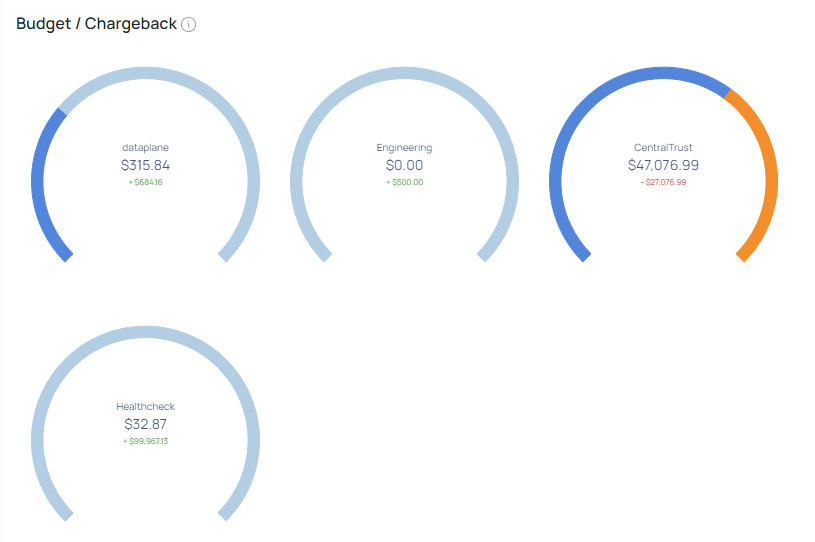
It is critical for organizations to monitor and track the expenditures incurred by various departments or the organization. The chargeback feature in ADOC lets you manage, measure, and assign infrastructure expenses across business units and data platforms. The Chargeback tool also enables you to efficiently allocate funds (based on previous expenditures) to different business units within your corporation.
The following tabs are available on the Chargeback and Budget page:
- Cost Analysis
- Organization Units
- Budgets
Spend Over Last 7 Days
A bar chart representing the expenditure over the last week across different Snowflake accounts.

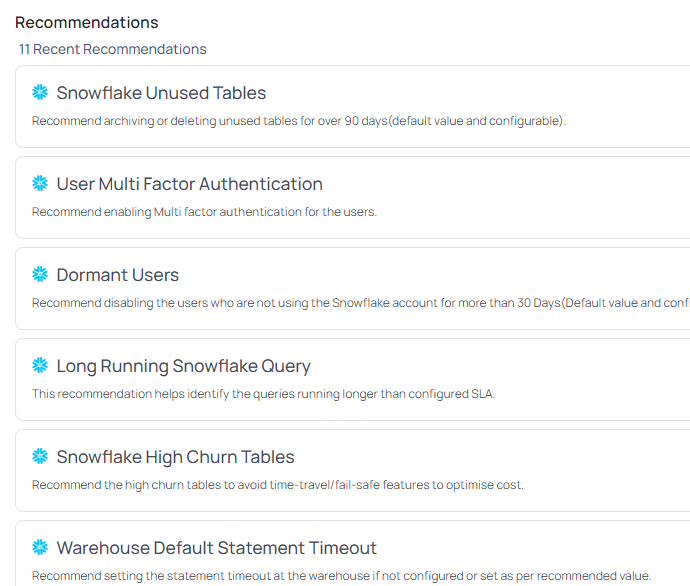
Recommendations
Lists the latest recommendations provided by ADOC to optimize Snowflake and Databricks data sources. These recommendations aim to reduce costs and improve system performance.
The Platform Admin View provides a sophisticated interface for cost management, system health monitoring, and performance optimization. By following this guidance, platform administrators may efficiently navigate the new user interface, access real-time insights, and make data-driven decisions to improve operational efficiency.
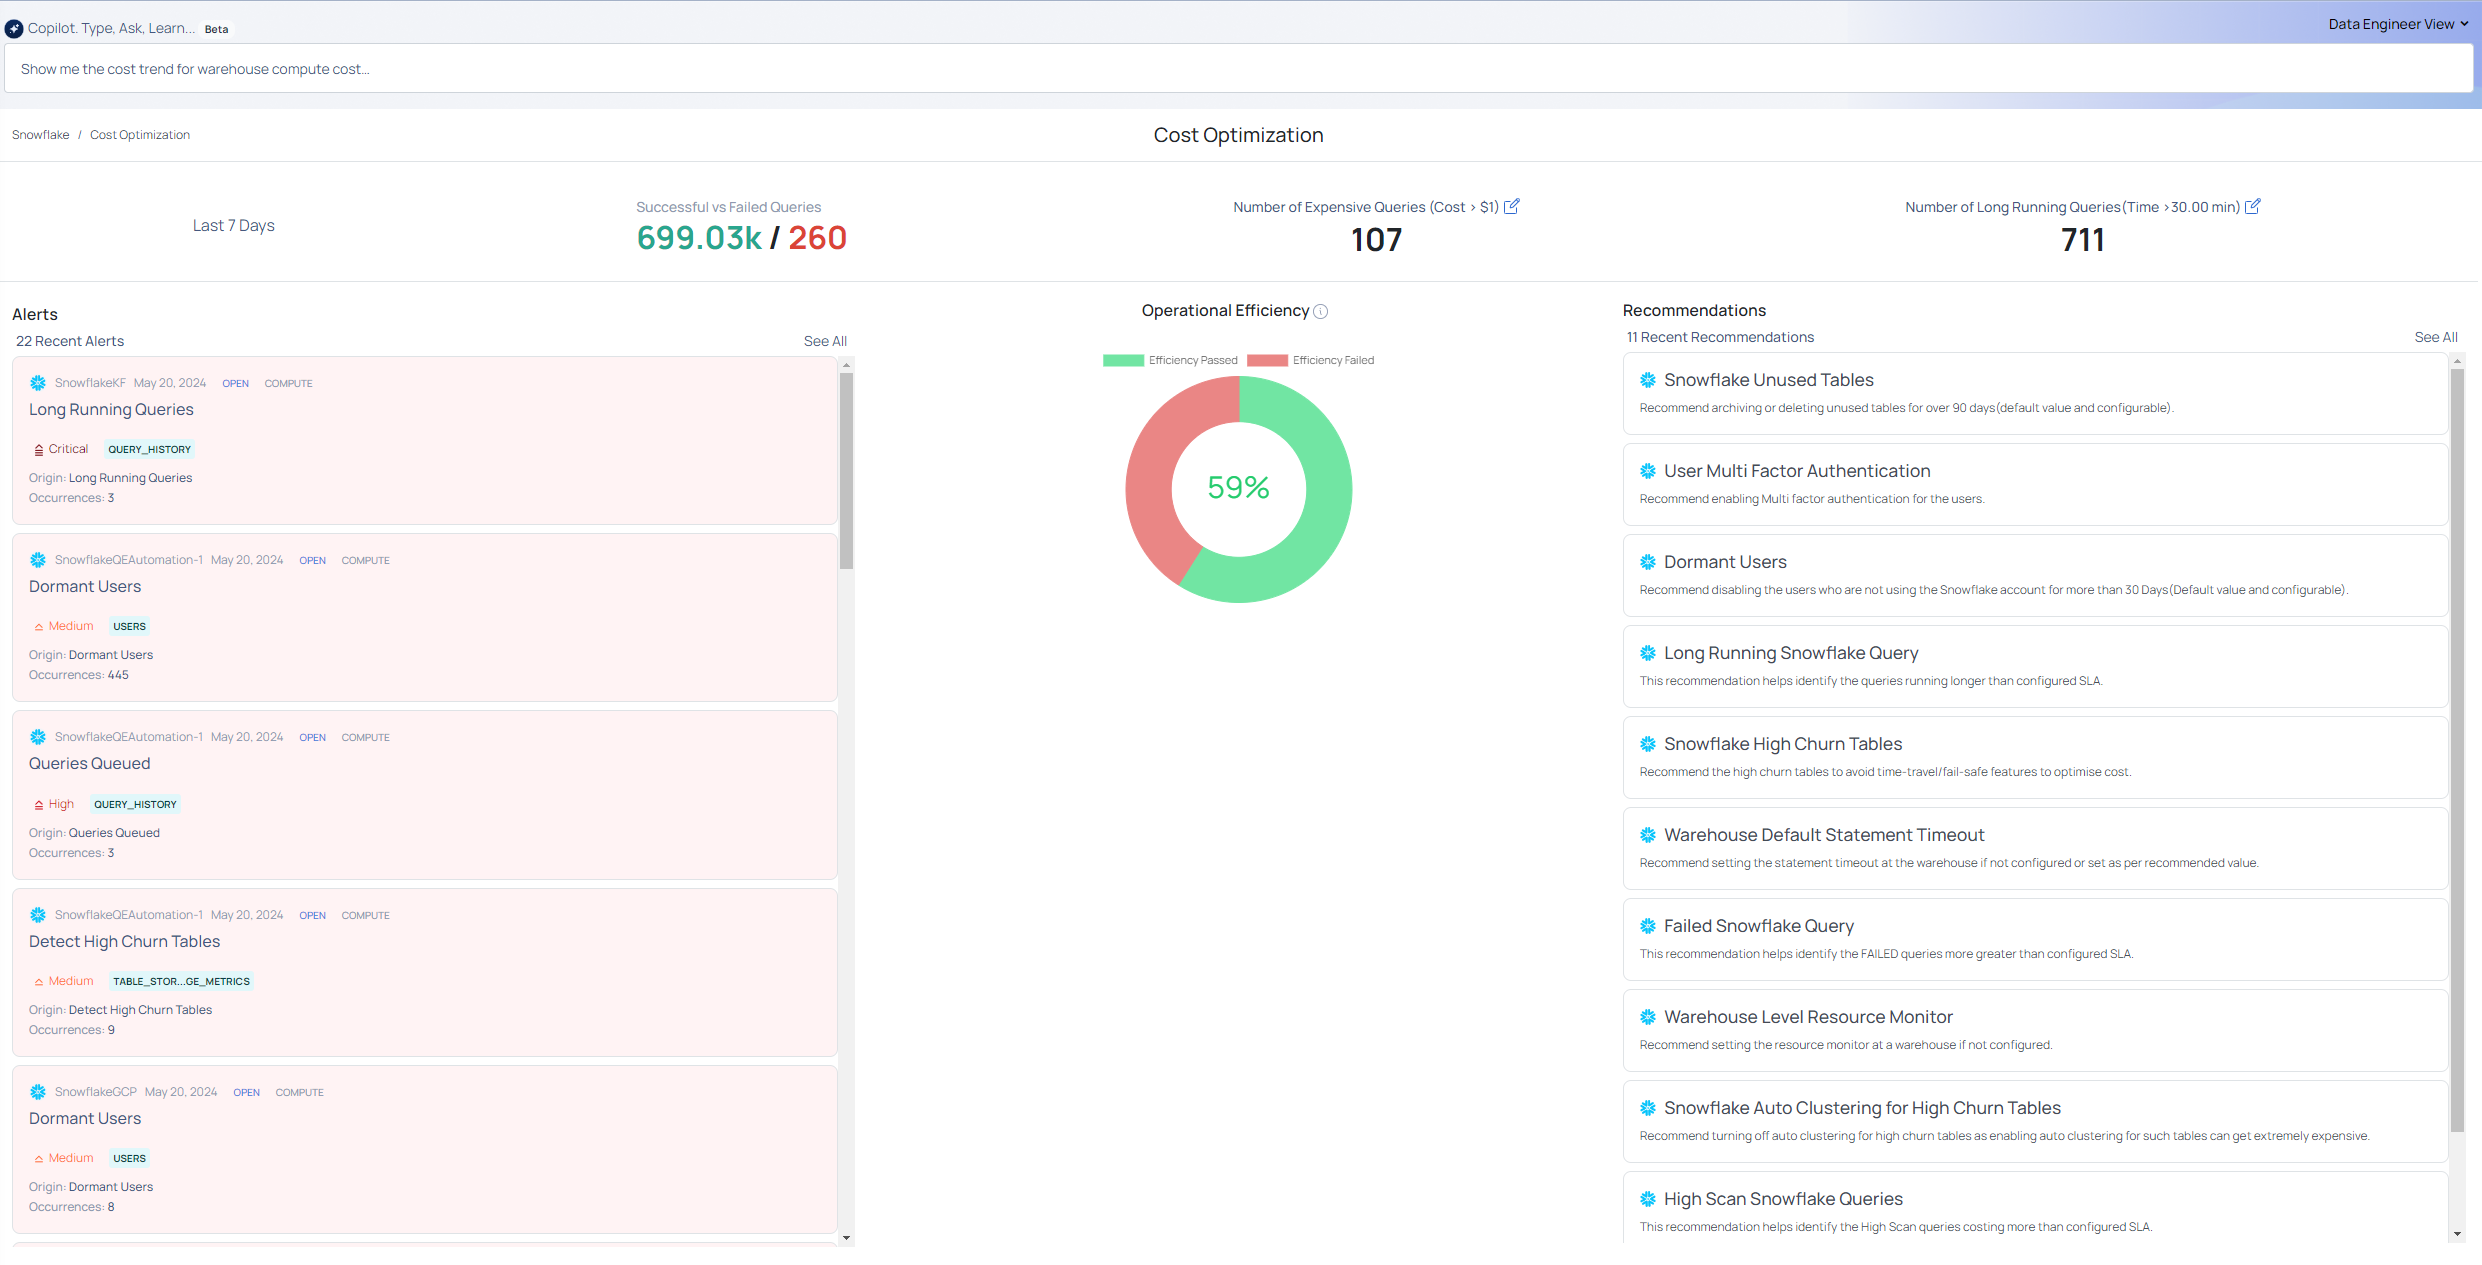
Data Engineer View
The Data Engineer View in ADOC V3.5.0 is tailored to provide detailed insights into job performance, query optimization, and system efficiency. This guide will help you navigate and utilize the features available in this view.
- Metrics on successful vs. failed queries.
- Identification of expensive and long-running queries.
- Detailed analysis of resource optimization.
- Alerts for critical issues and recommendations for improvements.
Copilot NLI Interface
The new Copilot Natural Language Interface (NLI) enhances user interaction with real-time suggestions and smart recommendations.
- Type-ahead suggestions for instant recommendations.
- Smart alternatives for ambiguous queries.
- Interactive dashboards for detailed analysis.
Cost Optimization Section

| Field | Description |
|---|---|
| Successful vs Failed Queries | Displays the number of successful versus failed queries over the last 7 days. Users can see the number of successful and failed requests. When a user clicks on this, they must select a specific data source. They will then be taken to the Query Studio dashboard, where they can view additional details. |
| Number of Expensive Queries | Shows the count of queries costing more than $1. Users can view the number of expensive requests. This is an editable field where users can enter any value appropriate for their use case. When users click, they are prompted to select a specific data source. They will then be taken to the Query Studio dashboard to view more detailed information. |
| Number of Long Running Queries | Indicates the count of queries running longer than the specified threshold (e.g., 30 minutes). Users can view the number of long-running requests. This is an editable field where users can enter any value appropriate for their use case. When users click, they are prompted to select a specific data source. They will then be taken to the Query Studio dashboard to view more detailed information. |
Operational Efficiency
The Operational Efficiency Score is a quantitative measure of the system's overall state. This score helps identify potential problems and prioritize activities for optimization. Hover over the chart to see the efficiency percentage, then click the doughnut chart to see the operational efficiency across data sources.
Alerts
Displays the most recent alerts to notify you about critical issues and unexpected data activity. These alerts help you quickly identify and address problems within your data pipelines.
Recommendations
Lists the latest recommendations provided by ADOC to optimize Snowflake and Databricks data sources. These recommendations aim to reduce costs, enhance performance, and improve system efficiency.
The Data Engineer View provides a comprehensive interface for monitoring job performance, optimizing queries, and ensuring system efficiency. In this persona based view, data engineers can effectively navigate the new UI, leverage real-time insights, and make data-driven decisions to enhance operational performance.
Operational Efficiency of the system
- Currently, we do not have the ability to enable or disable any health categories on the main page. Currently, these operations are only available on the monitor configuration dashboard.
- New tabs for each functionality.
Copilot NLI feature
- Queries in the Copilot NLI interface redirect to the respective dashboard but not to specific widgets. The customer must investigate the widget/navigation within the page.
- In the Copilot NLI interface, queries redirected to the Query Studio dashboard do not automatically filter for a few criteria. Users will have to manually apply these filters to the query studio dashboard. This limitation will be addressed in the upcoming edition.