Snowflake Warehouse
The Snowflake Warehouse page provides you with recommendations to effectively utilize your Snowflake warehouses. This feature evaluates the average running time and average queue size of your Snowflake warehouses and provides you recommendations. You can modify the values for average queue size and average running time to view various combination of recommendations.
To access the warehouse page, perform the following:
- Navigate to the left menu bar and select Compute.
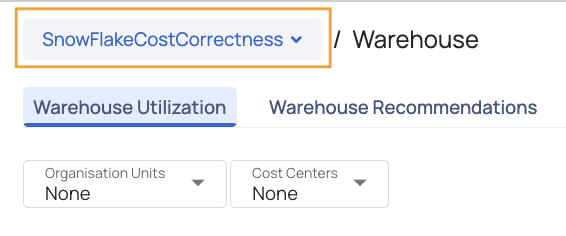
- From any Snowflake data source, click the Warehouse option. The Warehouse page for the Snowflake data source is displayed with the following two tabs:
- Warehouse Recommendations
- Warehouse Utilization
Filters
The Data Source Filter allows you to switch the Snowflake data source. This enables you to view and analyze data across various sections based on the selected Snowflake account or project, providing flexibility for monitoring and managing information across different data sources.
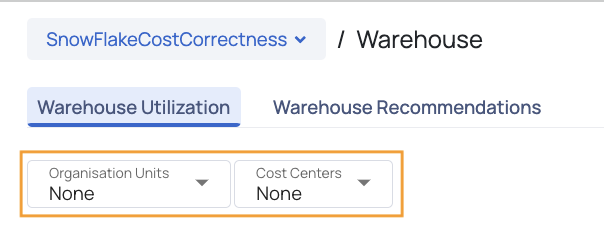
The filters on this page include Organization Units and Cost Centers, allowing you to refine your graphs, dashboards, and tables accordingly.
Warehouse Recommendations
The Recommendations tab provides you with the following data on warehouse sizes:
Warehouse Recommendation
This section consists of a quadrant graph. The x-axis of the graph consists of Average Running Time Ratio of queries on warehouses and the y-axis represents Average Queue Load Ratio of warehouses. You can modify the values for Expected Warehouse Latency and Expected Warehouse Queue Load by clicking the Edit Configurations button if you have appropriate role permissions. By default, an expected warehouse latency and expected warehouse queue load values are configured to depict the chart. To consolidate all warehouses in a single chart, the ratio of average queue load for all warehouse and average of running time for all warehouse is taken into consideration.
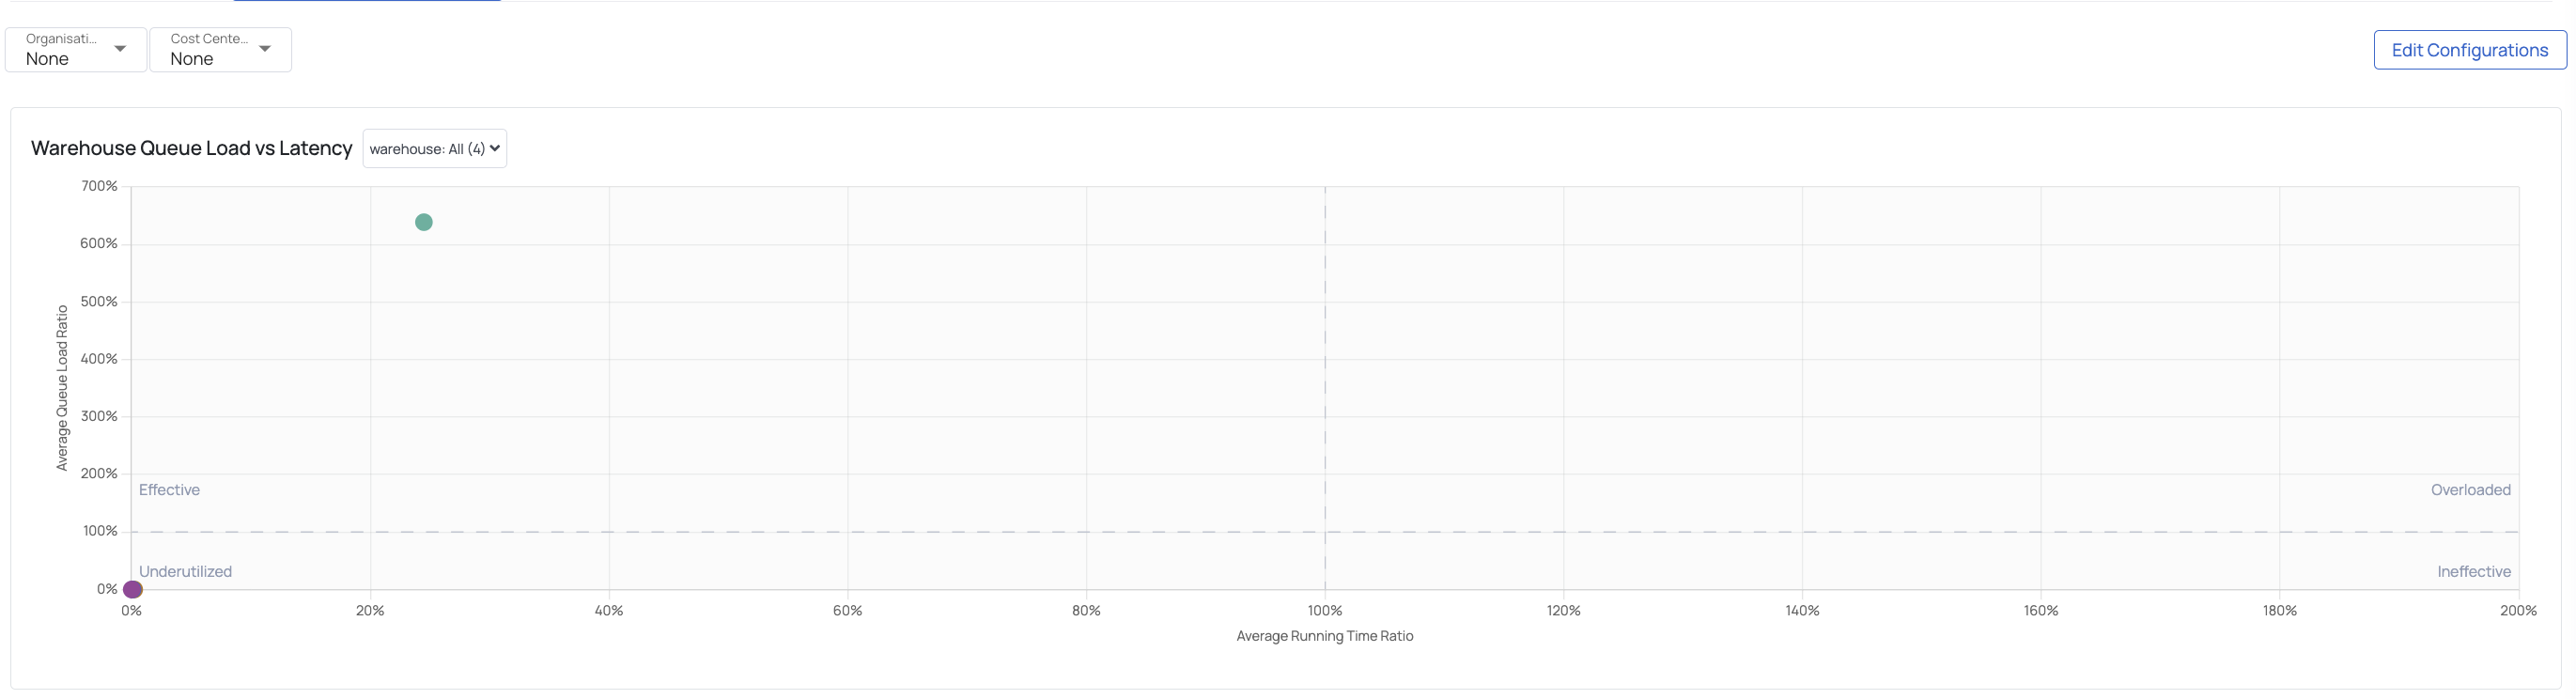
Warehouse Queue Load vs Latency
This graph has four quadrants which are based on the values of Average Running Time and Average Queue Load.
- Underutilized: If both Average Running Time and Average Queue Load are low for a warehouse, the warehouse is placed in this quadrant.
- Ineffective: If the Average Running Time is high and the Average Queue Load is low for a warehouse, the warehouse is placed in this quadrant.
- Effective: If the Average Queue Load is high and the Average Running Time is low for a warehouse, the warehouse is placed in this quadrant.
- Overloaded: If both Average Running Time and Average Queue Load are high for a warehouse, the warehouse is placed in this quadrant.
In the following image, you can see that the warehouses are placed in the second and fourth quadrant.

Based on the values of Average Running Time and Average Queue Load, there are three possible recommendations provided by ADOC.
- Upscale: This recommendation requires you to upgrade your Warehouse to the next higher level. This recommendation is suggested when your warehouse's load, query running time are high.
- Downscale: This recommendation requires you to downgrade your Warehouse to the next lower level. This recommendation is suggested when your warehouse is idle or has low query run time and load.
- Merge: This recommendation requires you to merge two warehouses. When one warehouse's load is high, you need to route some of the queries to the merged warehouse.
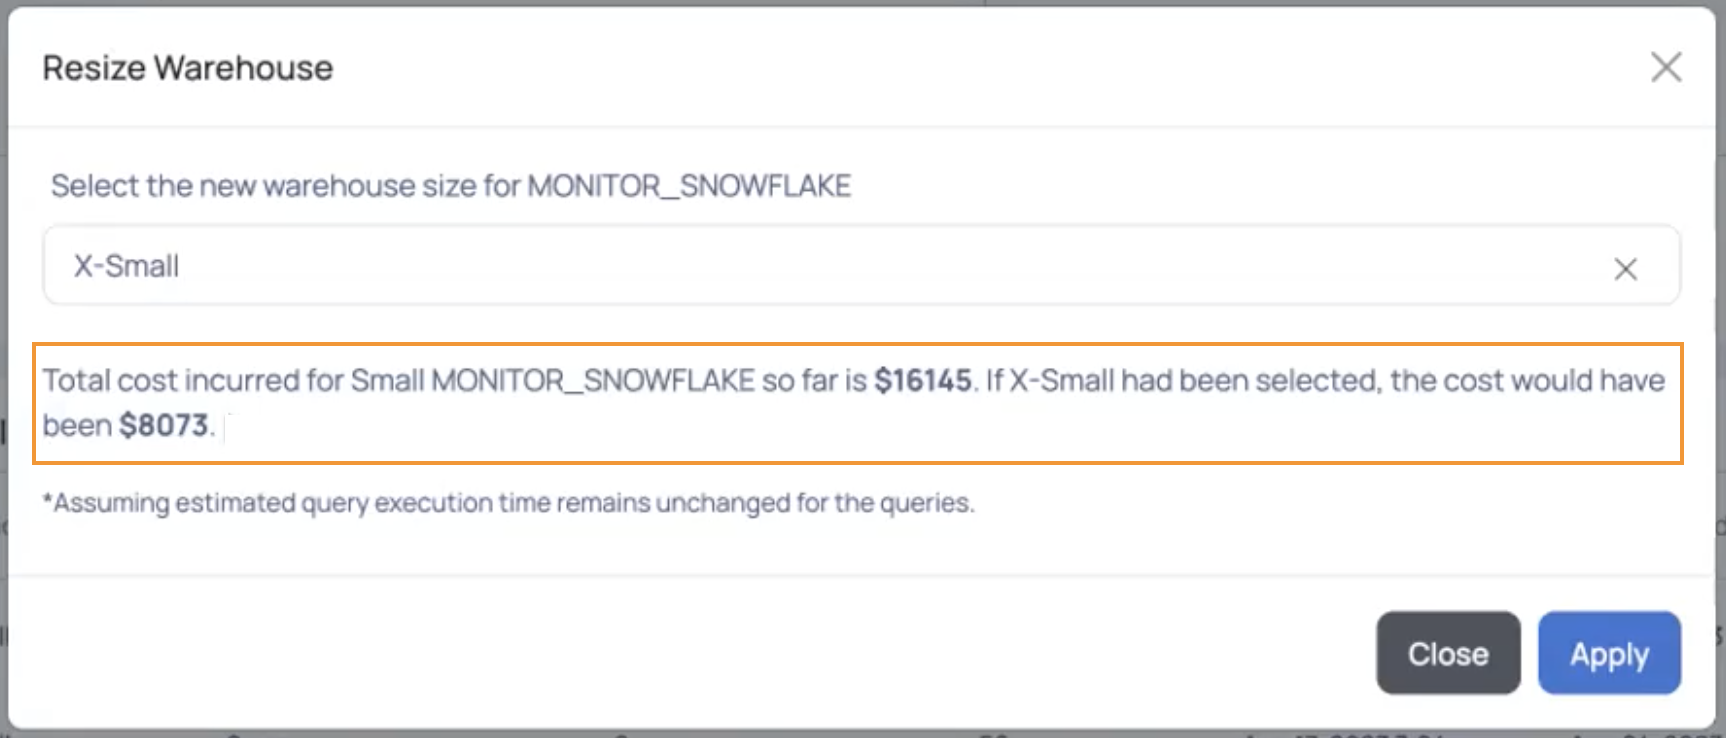
On applying one of the above recommendations, you will also be presented with the total cost associated with the current warehouse size and the projected cost if you were to adopt our recommended warehouse size.
Warehouse Sizing Recommendation
This section consists of a table which provides you all the recommendation details for each warehouse. The recommendations are based on the values of Average Running Time and Average Queue Load.
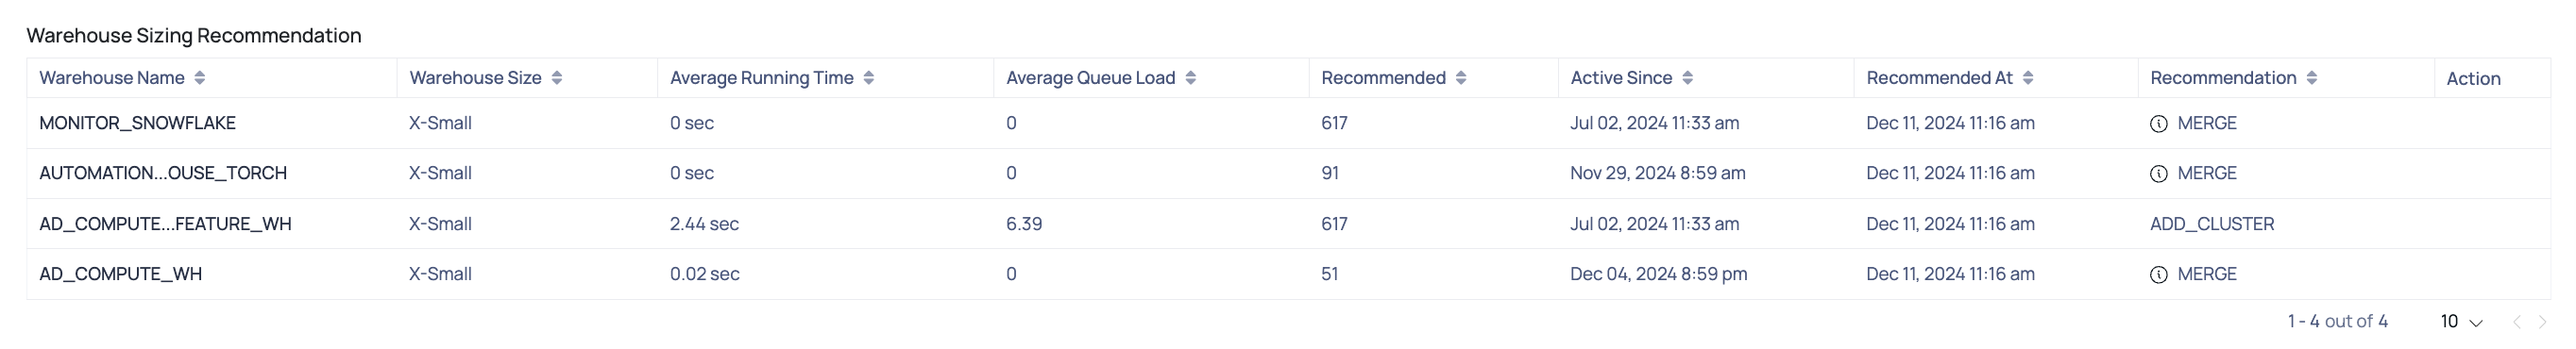
The various columns in this table are as follows.
| Column Name | Description |
|---|---|
| Warehouse Name | The name of the warehouse. |
| Warehouse Size | The current size of the warehouse. |
| Average Running Time | The average running time of queries on the warehouse. |
| Average Queue Load | The average queue load on the warehouse. |
| Recommended | The number of recommendations made out of total evaluations done on the warehouse. |
| Active Since | The duration from when the warehouse has been operational. |
| Recommendation | The ADOC recommendation for the warehouse. This can either be Merge, Upscale, or Downscale. |
| Action | The action that you can perform on the warehouse. This is applicable only to Upscale and Downscale recommendations. |
Warehouse Recommendations allows you to select a warehouse size starting with version 2.7.0.
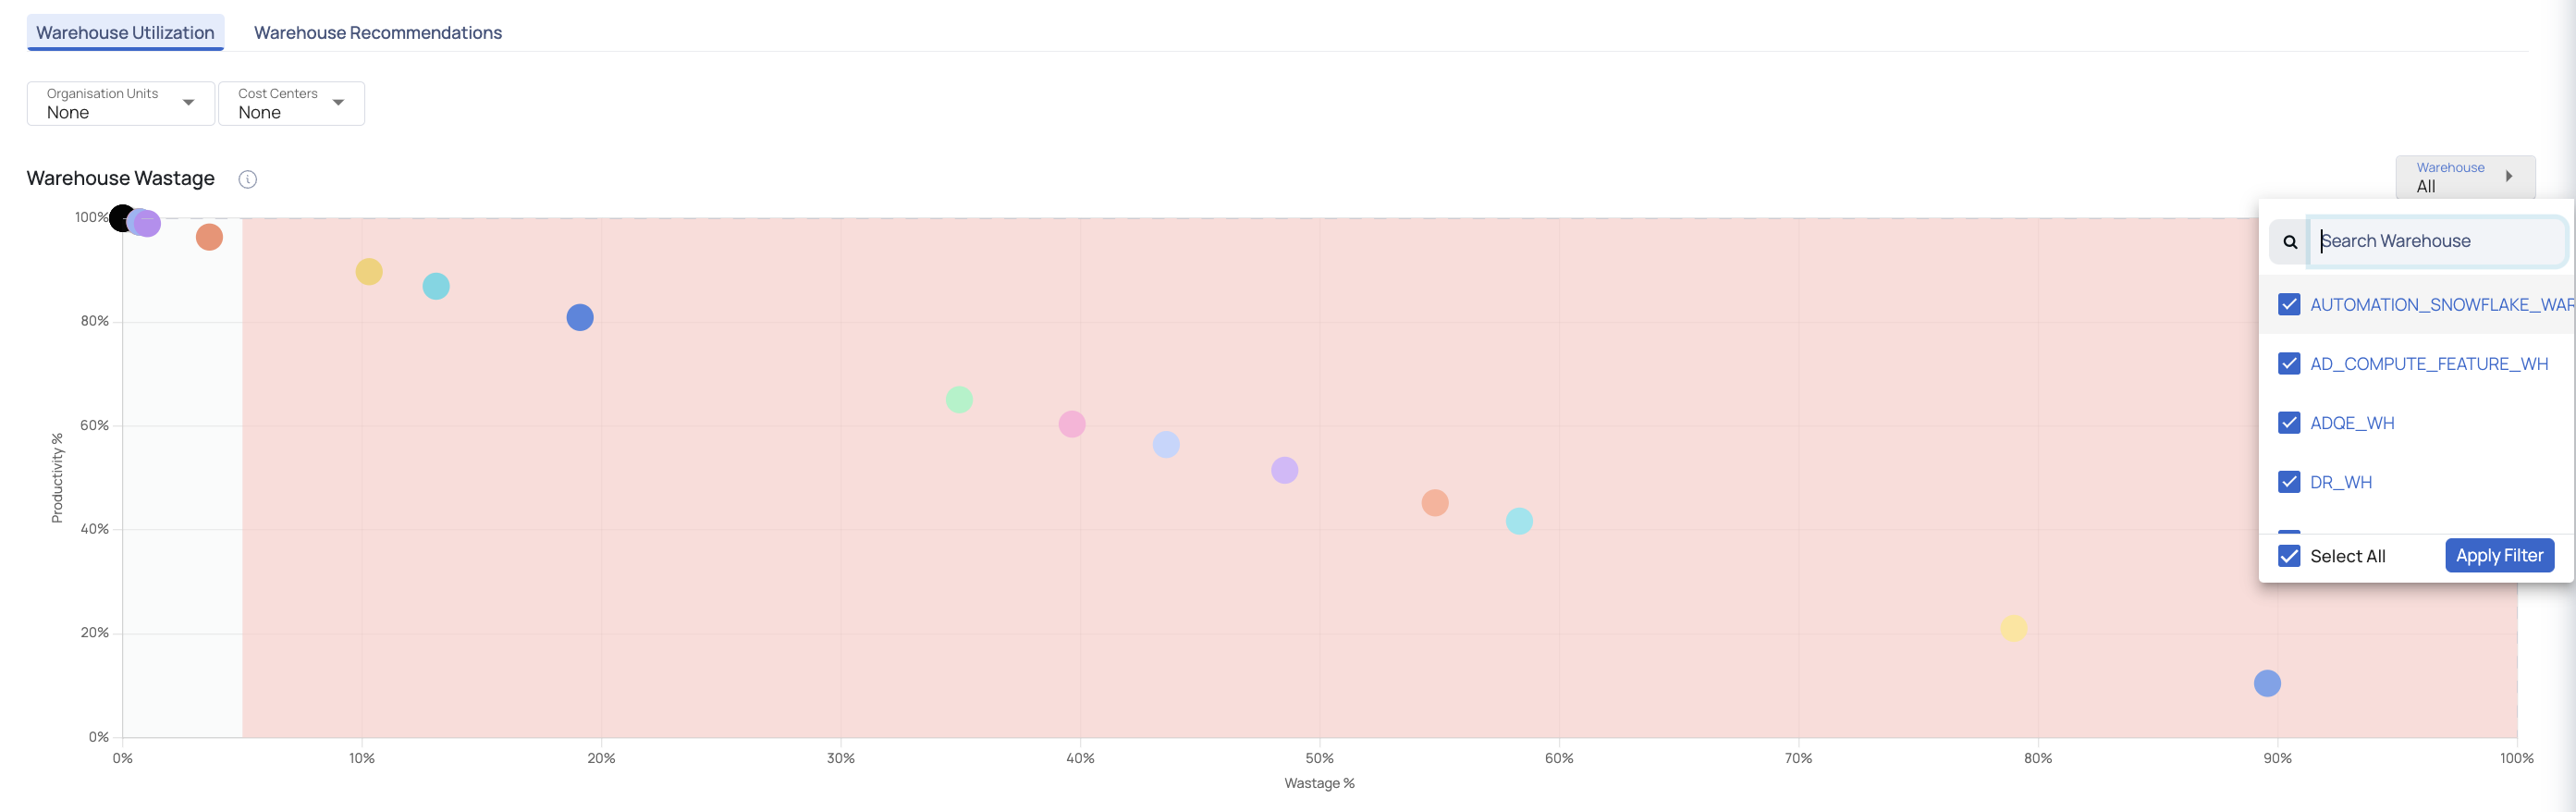
Warehouse Utilization
The Warehouse Utilization tab provides you with the following data on the Snowflake warehouses:
Warehouse Wastage
This chart offers an overview of a warehouse's efficiency and resource utilization, presented as percentages, within the chosen time frame on the global calendar. The x-axis represents the wastage percentage, while the y-axis indicates the productivity percentage of the warehouses.
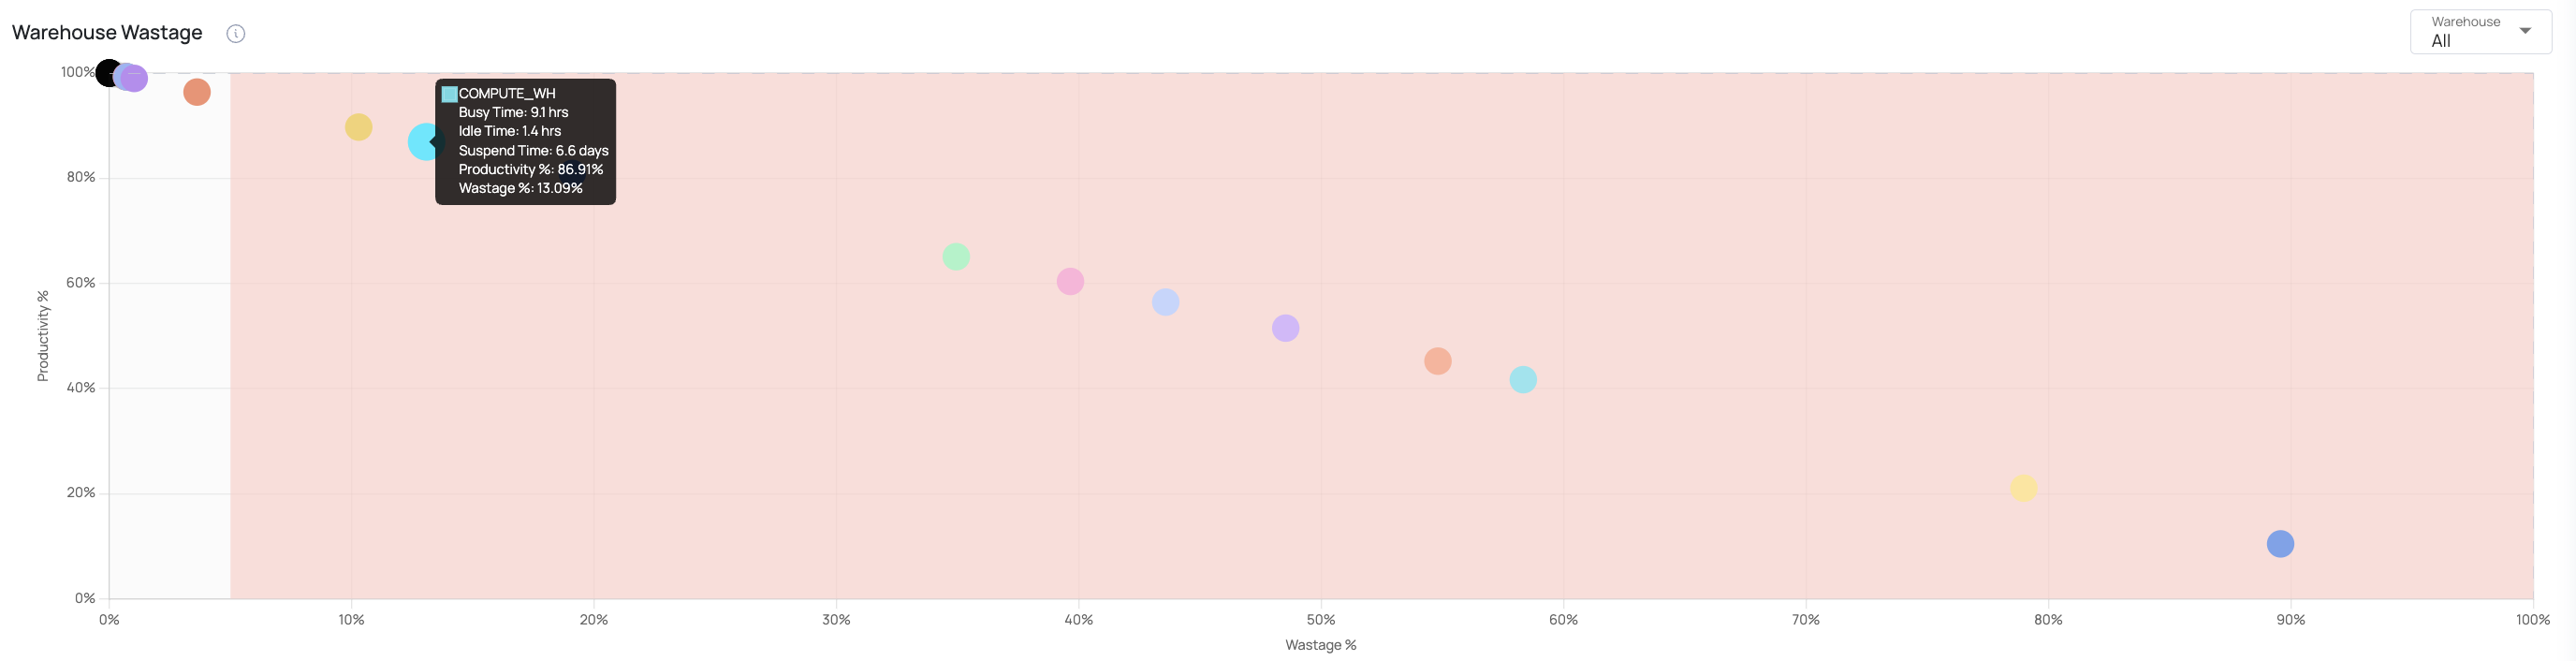
Warehouse Wastage Chart
Definitions:
- Warehouse Busy State: This refers to the period when the warehouse is actively processing tasks.
- Warehouse Idle State: This is when the warehouse is operational but not actively processing tasks.
- Warehouse Suspend State: In this state, the warehouse is temporarily halted, often as a cost-saving measure.
Calculation:
- Wastage %: Calculated as
(Idle Time * 100) / (Idle Time + Busy Time) - Productivity %: Calculated as
(Busy Time * 100) / (Idle Time + Busy Time)
It is recommended to maintain wastage below 5%. If the wastage percentage is higher, consider reducing the Auto Suspend timeout to optimize resource usage. Conversely, if the wastage percentage is low, increasing the Auto Suspend timeout can help save on transition costs.
Within the chart, warehouses appearing in the red section may have extended idle periods and merit further investigation.
For detailed analysis of specific warehouses, you can select a warehouse by name from the Warehouse drop-down menu.
Warehouse Wastage Chart
Warehouse Performance (Top 25 Idle Warehouses)
This chart depicts the top 25 warehouses sorted by their idle time. It utilizes three distinct legends: idle time, busy time, and suspend time. The x-axis showcases the warehouse names, while the y-axis quantifies the duration in days. Hovering over the bars in the chart, which are color-coded (yellow for idle time, blue for busy time, and gray for suspend time), provides deeper insights into the productivity and wastage percentages for each warehouse. The legends provide precise data on the number of days each warehouse spent in a specific state.
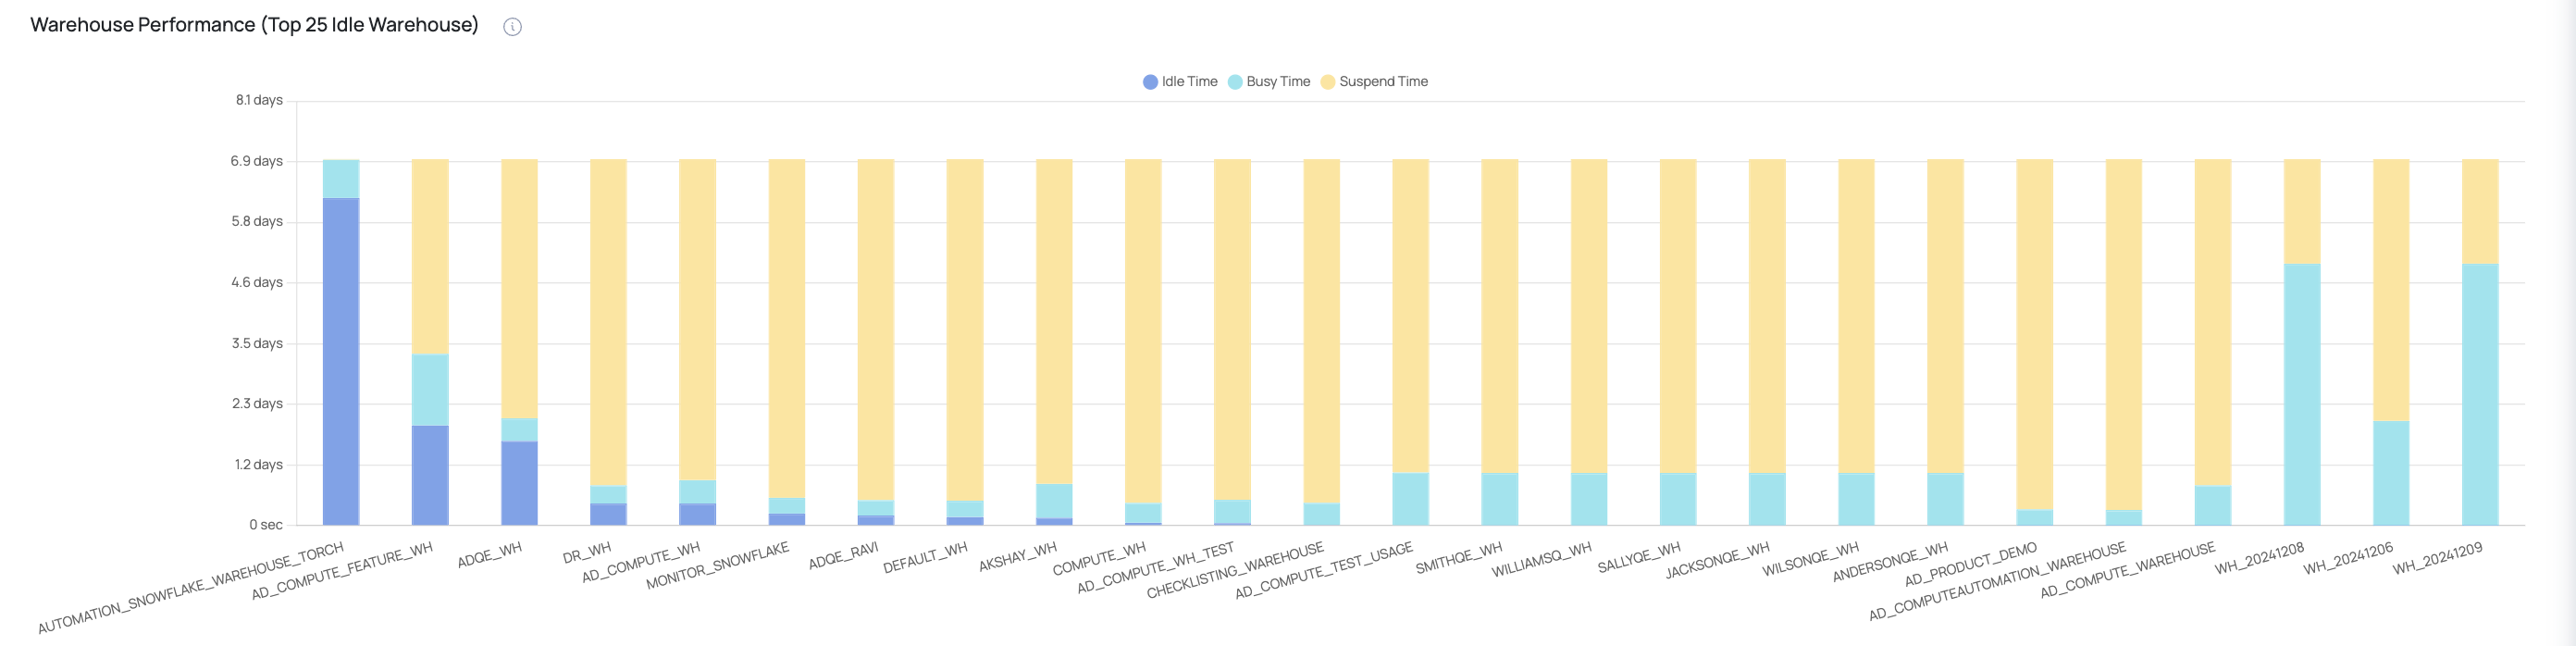
Warehouse Performance Chart