FAQ
This documentation deals with the frequently asked questions in Acceldata Data Observability Platform.
How can Acceldata Data Observability Cloud (ADOC) help your organization?
Acceldata Data Observability Cloud (ADOC) is a unified platform that offers a variety of monitoring services for your data environment. You can now input data from a number of sources into ADOC and continuously check data dependability and calculation cost.
How do I sign up to ADOC?
Perform the following steps to sign up to ADOC:
- Create an account in https//accounts.acceldata.app/admin/signup. For more information, see Setting up ADOC.
- Add your Data Sources to ADOC.
- Configure Data Plane to enable Data Reliability.
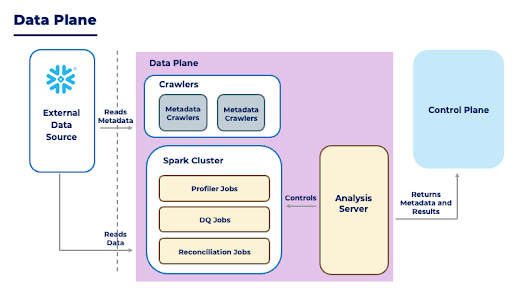
What is Data Plane in the ADOC platform?
The Data Plane in the ADOC platform connects to your organization's underlying data sources, and reads and analyzes the metadata. The Data Plane includes the data analyzer, query analyzer, crawlers, and the Spark infrastructure. It returns the metadata and results to the Control Plane. The Control Plane is the platform's orchestrator and includes the UI and API interfaces for interacting with the platform.
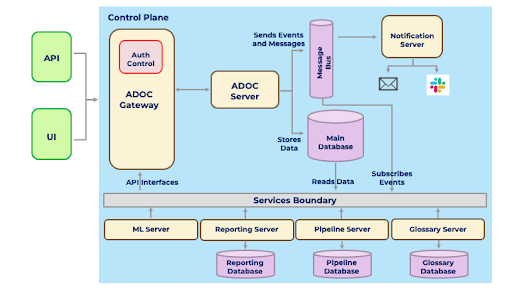
What is Control Plane in the ADOC platform?
The Control Plane is the platform's orchestrator, and it provides UI and API interfaces for interacting with it. All metadata, profiling data, job results, and other data are stored in the database layer by the Control Plane. It manages the Data Plane and, when needed, makes requests for job execution and other tasks. This Control Plane is maintained by Acceldata itself.
What are the key components of the ADOC platform?
The key components of the ADOC platform include:
- Data Sources: The Data Sources component enables you to connect to your data sources. To retrieve data from the data source, a connection must be established to the data source from the ADOC server. For more information on Data Sources, see Introduction to Data Sources.
- Data Reliability: The Data Reliability component assists you in discovering, comprehending, and utilizing data sources and assets. For more information on Data Reliability, see Discovering Data Assets.
- Compute: The Compute component of the ADOC platform allows you to view data from various data sources, displayed as graphs, charts, and tables. In addition to viewing data, this component also allows you to view and create custom dashboards and visualizations as well as view cost incurred and best practices. For more information on Compute, see Introduction to Compute Capabilities.
- Pipelines: The Pipelines component of the ADOC platform allows you to create ETL (Extract, Transform, Load) pipelines and also provides detailed information on all ETL pipelines that have been created. The collection of procedures used to transfer data from one or more sources into a database, such as a data warehouse, is known as an ETL pipeline. For more information on Pipelines, see Introduction to Pipelines.
- Incidents: The ADOC platform offers a comprehensive method for detecting anomalies. When a preset alarm condition fails, a custom alert is raised as an incident in the Incidents component. You can create alerts from scratch or use ADOC’s predefined alerts. An incident is created when an alert is triggered. For more information on Incidents, see Introduction to Incidents.
- Administration: The ADOC administration allows you to control different user roles and provide the users with required access. For more information, see User Management and Access.
What are data sources, and which data sources does the ADOC platform support?
A data source simply refers to the source of data, which is a database on a remote server. Data Sources lists all of the data sources that ADOC supports.
How do I add more than one Snowflake account?
To add more than one Snowflake account (instance), use the Add Data Source feature in the Data Source page of the ADOC platform. Numerous data sources can also be added to a single instance for ADOC's data reliability feature, which caters to multiple databases. Using different Snowflake user credentials, multiple data sources referring to the same Snowflake instance can be added.
How many prior Data Plane versions are compatible with the current control plane?
The current control plane currently supports up to three Data Plane versions.
What is the running cost of a Data Plane?
The running cost of a Data Plane would be directly proportional to the size of the EKS cluster created by the customer for Data Plane deployment.
What must be done if you are having trouble connecting to your Snowflake account?
If you are having trouble connecting to Snowflake from the ADOC platform, you should first see if you can access the web interface for Snowflake to log into your account. For more information, see Logging in using the Snowflake web interface.
If you are able to successfully login to the Snowflake web interface, then check if the appropriate role is provided to you in your Snowflake account. For more information, see Access Control Privileges.
As a part of the prerequisites to configuring a Snowflake Datasource, ensure that you have set your connection to the default warehouse.
What must be done if you are having trouble crawling through the metadata from your data source?
The crawler might be failing to start due to a missing Docker image, or the crawler execution might be erroring due to insufficient privileges or unavailability of data sources. Investigate the following logs and follow the instructions provided:
- In case there is no ad-<data_source_name>-service-<id> pod: Please check the ad-analysis-service-<id> pod.
- In case there is an ad-<data_source_name>-service-<id> pod: Please check the logs of this pod itself as it might have failed due to insufficient privileges or unavailability of a data source.
What must be done if you are unable to run a job profile, mini-profile, data quality policy, or reconciliation policy?
The following two reasons state why you are unable to run a job profile, mini-profile, data quality policy, or a reconciliation policy:
- Spark driver errors
- Insufficient privileges or unavailability of a data source
Investigate the following logs and perform the following instructions:
- In case there are pods named profile-<asset_name>, dq-<policy_name>, miniprofile-<asset_name>, recon-<policy_name> then check for possible Spark error messages inside these pods.
- Check for error messages in the ad-analysis-service-<id> pod.
- Check for error messages in the ad-catalog-<id> pod logs.
How to troubleshoot in case a policy failure alert is not being shared via email, slack, or other notification channels?
You can view all of the raised alerts by navigating to the ADOC platform's Incidents page. Click the Reliability checkbox in the filter panel to only see policy alerts. For more information, see Incidents.
Explain the ADOC Architecture.
The platform is built as a set of microservices that work together to manage various business outcomes. The ADOC collects metrics by gathering and analyzing raw data as well as metadata from underlying data sources. It allows you to monitor compute performance and confirm data quality policies set by the system. For more information, see ADOC Architecture.
How do I invite others to my organization?
Only administrators in an organization have access to invite new users based on the following two conditions.
- SMTP is enabled: To invite new users, go to the Home page and click the Settings button. Click the Manage Users link on the Settings page. Click the Invite Users button and enter the user's email address. When the administrator clicks the Submit button, the user will receive a confirmation email.
- SMTP is disabled: If SMTP is not enabled for the user’s email address, then the administrator can also invite users using an external platform, in which case an email address and password is shared with them.
The user must change the default password during the initial login period and also provide additional information like first name and last name.
The confirmation email is valid for approximately 24 hours. If the account is not verified or acknowledged by the user within 7 days, the account is automatically deleted.
The administrator can enable and configure the following sign-in options for any user in the SSO authentication page: SAML, OIDC, and LDAP. For more information, see SSO.
What are the prerequisites required for setting up the Data Plane in ADOC?
To set up the Data Plane in the ADOC platform, you should have an AWS account with the following privileges:
- VPC full access
- EC2 full access
- Tagging resources access
- Autoscaling full access
- EKS Full Access
- IAM Full Access
- Cloud formation Full Access
- API Gateway Full Access
- VPC Link full Access
- Read-only S3 access to the bucket where job results will be stored and values.yaml will be placed.
VPC details
- When a user intends to use an existing VPC, ensure that the data source (for example, snowflake) is accessible from the VPC's private subnets. Use only those subnets that have access to the data source.
- When a user creates a new VPC, ensure that the new VPC network has access to the data source, via peering, or by editing the security group of EC2 nodes.
What are lookup tables, and how can I use them in ADOC?
Lookup tables are reference tables used to validate data against a predefined set of values. They can be used in data quality policies to check if the data in a column matches the allowed values in a lookup table. You can create or import lookup tables in the Data Quality Management section and use them in policies.
How do I handle schema changes in my data sources?
Use the Schema Drift Policies to detect schema changes such as addition, deletion, or modification of columns. Configure schema drift policies to alert you when unexpected changes occur in your data source schema.
What should I do if my custom alert is not being triggered as expected?
Check the alert conditions and ensure that the metric thresholds or rules are correctly defined. Verify that the alert is mapped to a notification channel and that the policy triggering the alert is successfully executed. Additionally, review the alert logs in the Incidents page.
How can I optimize data storage costs in ADOC?
Use the Storage Management dashboard to review the current storage usage and costs. Consider applying data retention policies to delete older data, compress data where possible, and use cost-efficient storage options like object storage for long-term retention.
What are our support channels and tools for ADOC?
You can send your support queries to the cloudsupport@acceldata.io Email ID.