How Pulse Works
Pulse monitors Hadoop cluster nodes and the services running on them to deliver real-time, actionable insights into your big data infrastructure.
It helps you understand system behavior by collecting and analyzing logs, metrics, and events, offering unified observability to operations teams.

Pulse Architecture Components
- Agents – Collect logs, metrics, and traces from Hadoop cluster nodes.
- Hooks – Captures query events from Hadoop services.
- Connectors – Pull and process Hadoop service data.
- Services
- Core Services – Enable essential Pulse operations.
- Add-on Services – Extend observability capabilities.
- Databases – Store and enrich observability data.
Pulse supports observability across multiple Hadoop distributions. For details, see Pulse Compatibility Matrix.
Pulse Architecture consists of three parts: Data Collection, Processing, and UI and Visualization.
Data Collection
Pulse collects data from Hadoop cluster nodes and services using three methods: Agents, Hooks, and Connectors.
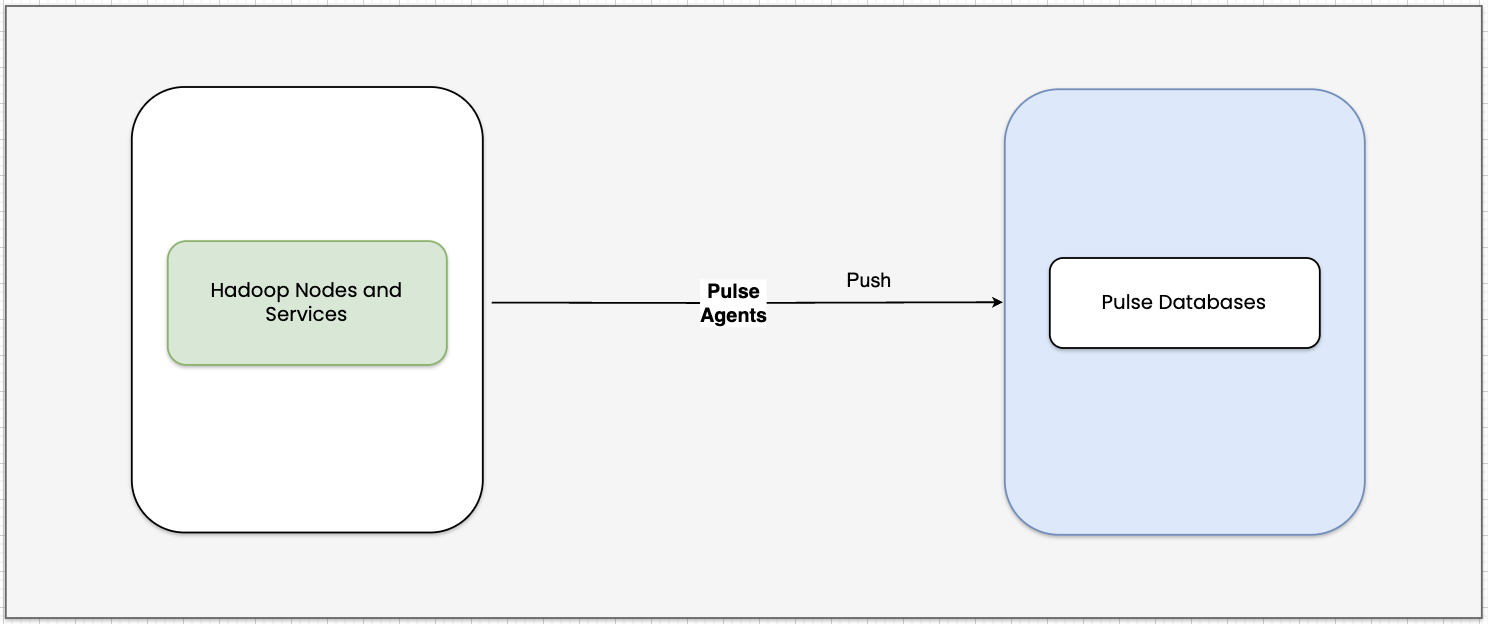
Agents
Agents are lightweight services, and they follow a push model and send metrics, logs, and health signals to Pulse databases. Some of the Agents include Pulse Node, JMX, Logs, etc.
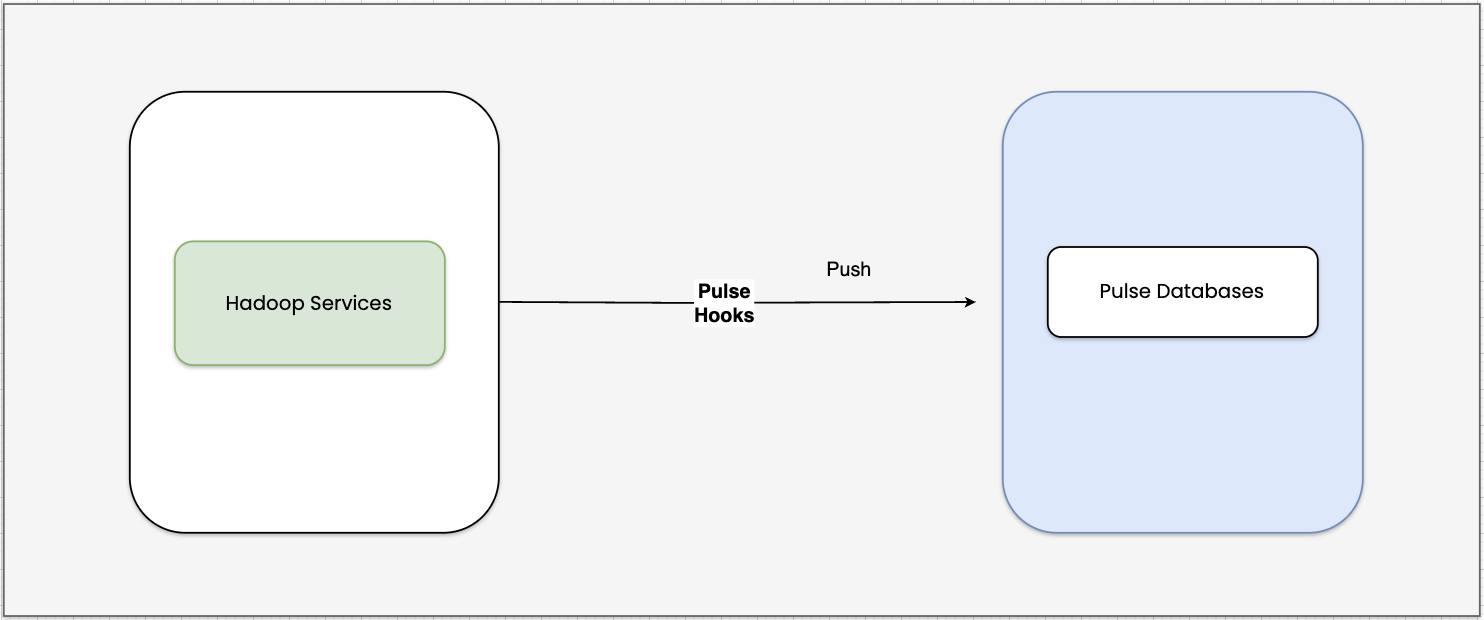
Hooks
Hooks send real-time query events to the Pulse databases for observability. Some of the Hooks include Hive, Trino, etc.
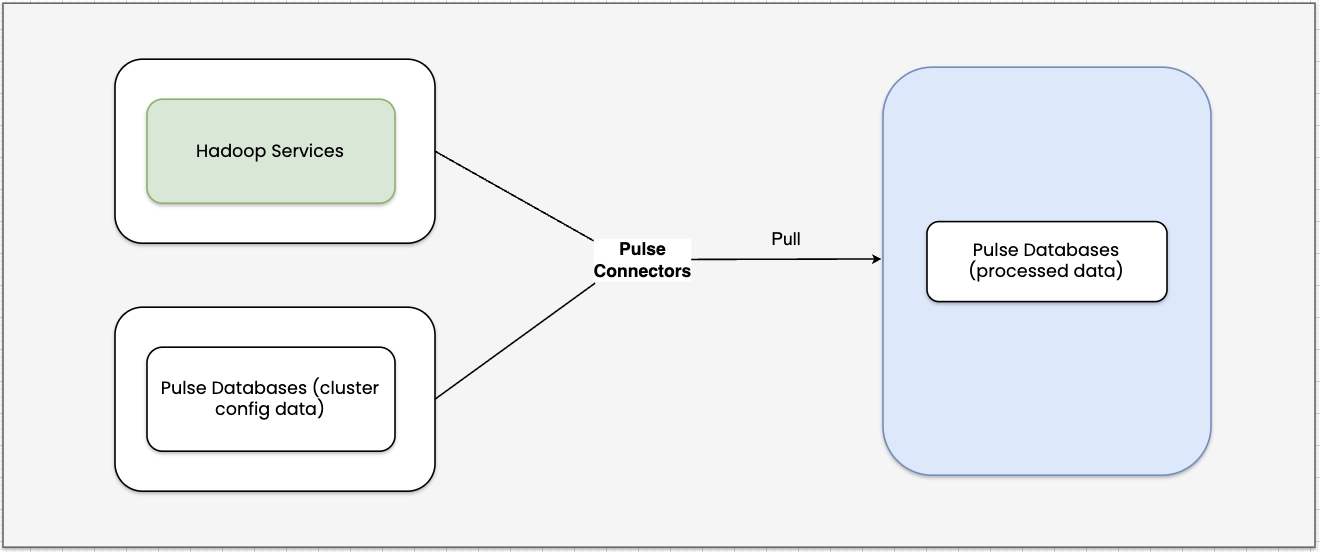
Connectors
Connectors pull, process, and analyze Hadoop services data. Some of the connectors include Kafka Connector, Ozone Connector, etc.
For detailed information, see Pulse Agents, Pulse Hooks, and Connectors.
Data Processing and Storage
Pulse collects, processes, and stores Hadoop system and service-level data to provide real-time visibility, alerting, and actionable insights through the Pulse UI.
- Pulse processes system and service-level data collected by Agents and stores it in the appropriate databases for easy access. This helps you monitor system health on the UI.
- Pulse processes Hadoop service events collected through hooks and stores them in the database. This enables you to track service activity in real time.
- Pulse connectors pull, process, and correlate data from Hadoop services and cluster configuration data available in the Pulse databases, and write it back to the databases. This enables you to monitor service-level metrics in the form of charts and dashboards in the Pulse UI.
This helps you:
- Monitor the health and performance of Hadoop services in real time.
- Analyze trends and patterns across infrastructure and applications.
- Identify issues quickly using correlated service and system-level insights.
- Improve troubleshooting efficiency and reduce operational overhead.
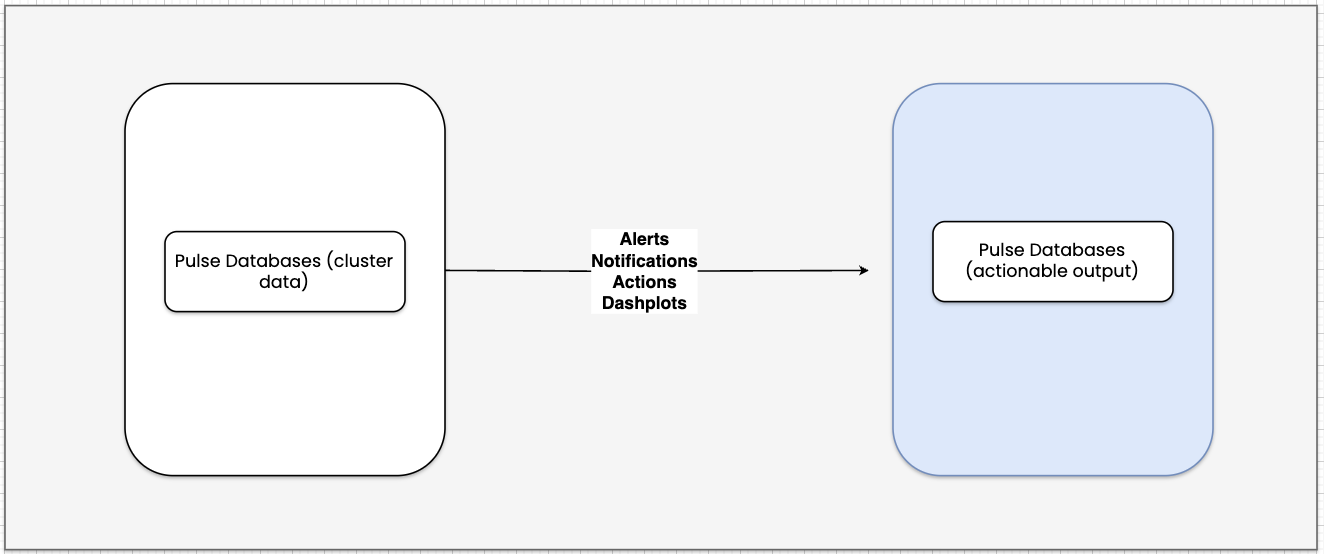
- Once Pulse processes and stores data in the database, the following Pulse services enable you to:
- Alerts and Notifications: enable stock alerts, define custom alerts, and send notifications through channels such as Slack, Email, etc.
- Actions: Automatically trigger responses based on alert conditions, and you can also trigger the built-in actions.
- Dashplots: Create custom dashboards and visualizations to visualize metrics and trends for better analysis.
Pulse databases store and enrich the observability data. For detailed information, see Pulse Databases.
For the complete list of Pulse services, see Pulse Services.
UI and Data Visualization
The Pulse UI connects to Pulse Databases to present a unified view of your environment. It displays logs, metrics, alerts, recommendations, dashboards, etc.. This helps you monitor system and application health in one place.
Key services that power the UI:
- GraphQL: Serves UI requests and delivers insights.
- Dashplot: Powers customizable visualizations and dashboards.
- LDAP (optional): Enables LDAP login for enterprise users.
This architecture enables scalable, intelligent, and production-ready observability across your big data stack.