Managing Clusters
A cluster is a group of interconnected computers working together to process large-scale data in parallel, enabling efficient computation for tasks in Big Data, such as data science, data engineering, and data analytics.
Pulse captures metadata from distributed computation tasks, providing comprehensive insights to monitor, optimize, and enhance the performance and reliability of Big Data operations.
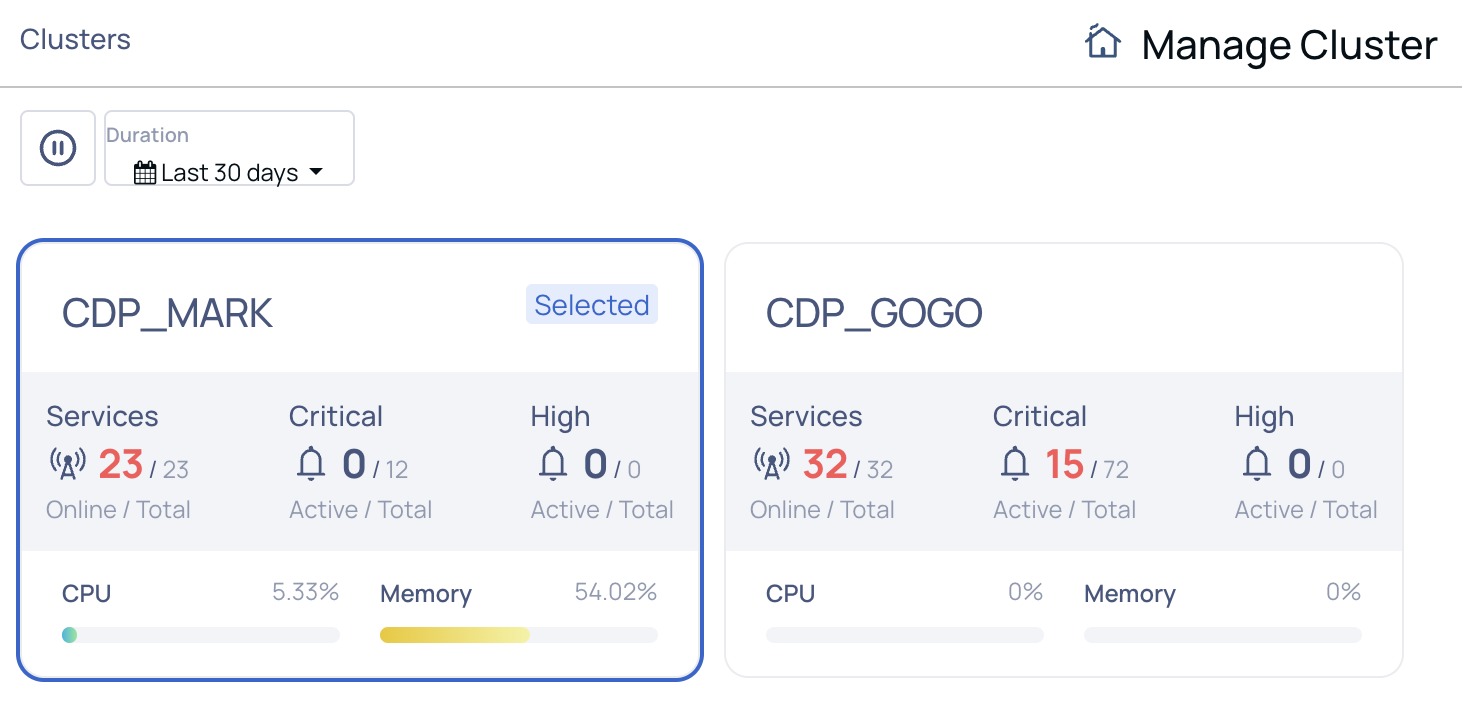
It tracks the current status of services within the cluster, showing the number of active services out of the total running. It also highlights critical and high-priority active incidents requiring immediate attention.
Pulse also provides real-time metrics such as CPU usage (%) and memory usage (%), offering a detailed view of resource utilization across clusters to support proactive decision-making and ensure system efficiency.
Perform the following steps to view the statistics of all the clusters in Pulse together on a single page:
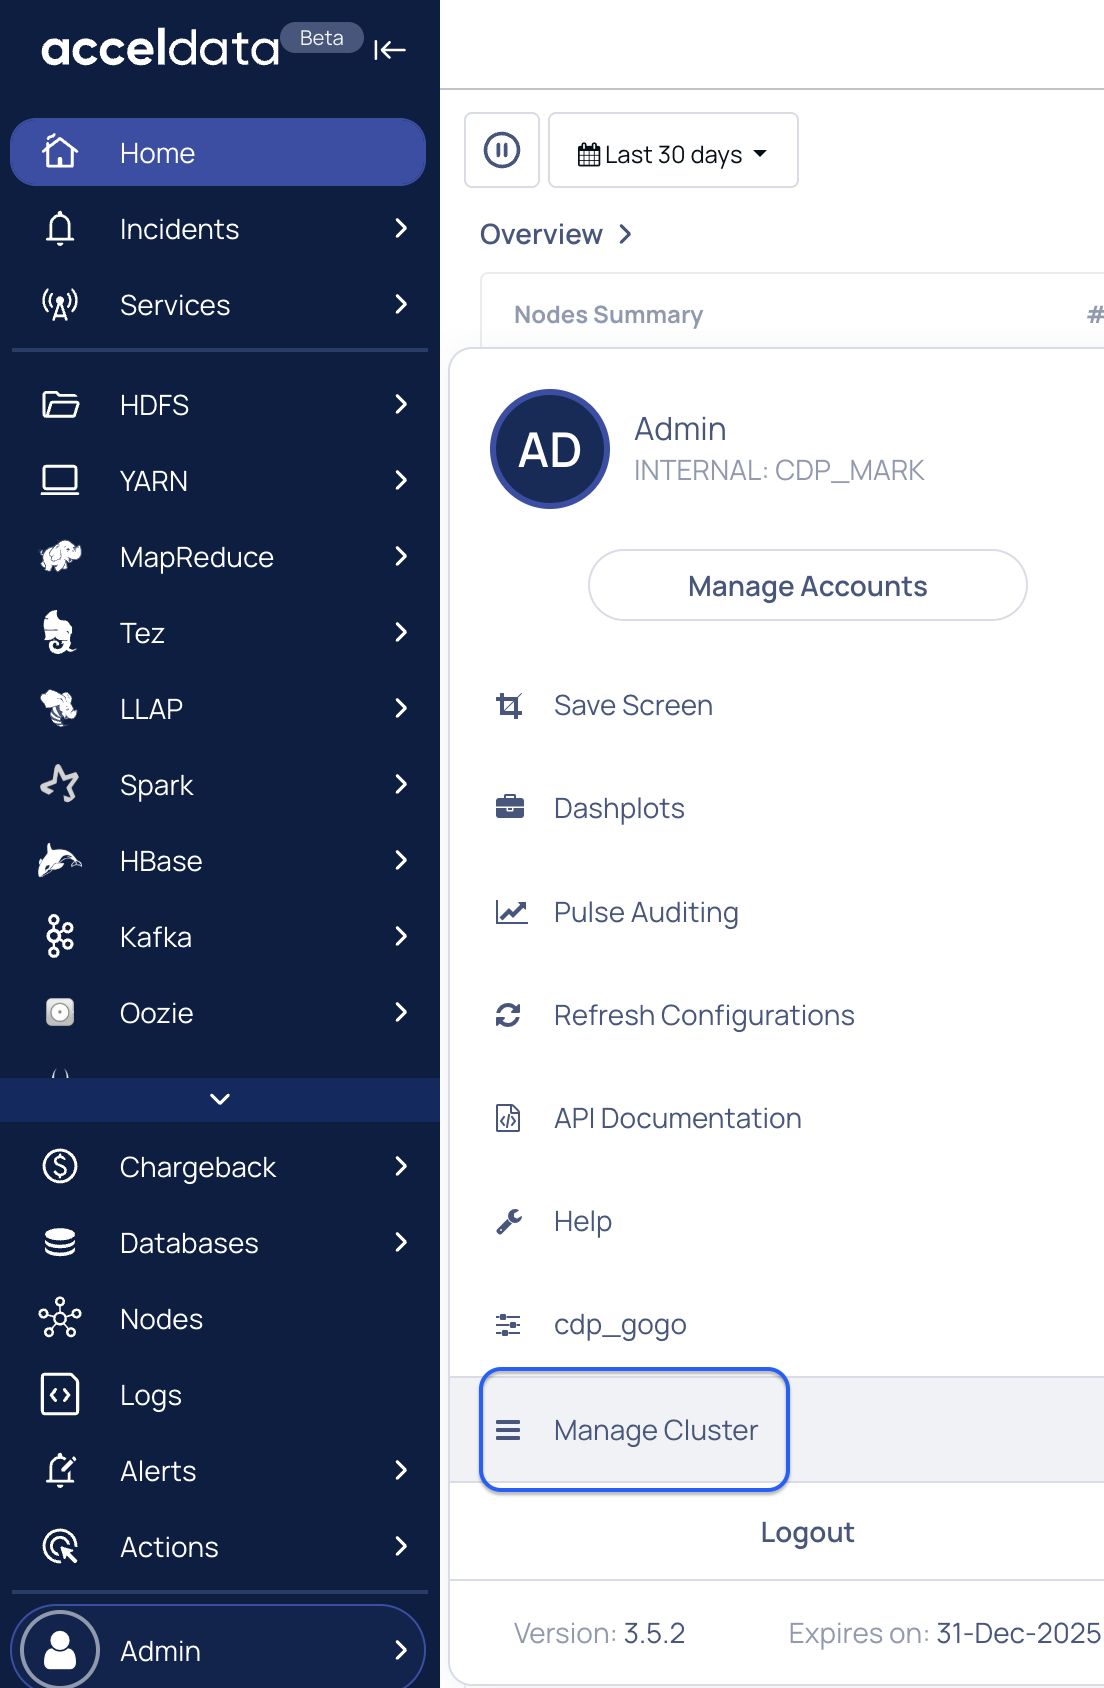
- Log in to the Pulse UI and navigate to the Admin page on the bottom left.
- On the Admin page, select Manage Cluster.

The list of clusters available in your ecosystem appears. You can select the cluster you want to monitor or check the overall cluster performance.
Pulse provides these functionalities to filter the data on the Manage Cluster page.
| Functionality | Description |
|---|---|
| Refresh the status | Click the ⏵ (Play) and ⏸ (Pause) buttons at the top left of the page, to toggle between play and pause respectively. Click the Play button to refresh the cluster status every ten seconds and the Pause button to temporarily stop the refresh. |
| Timestamp | Choose an option to select a time period (For example, Today, Last 12 hours, Last 3 Months, etc.) or choose a “custom date and time” and click Apply. |
The following metric tiles are displayed on the Manage Cluster page.

| Metric | Description |
|---|---|
| Services | The current status of services attached to the cluster. Displays the number of services online from the total services running on a cluster. |
| Critical Incident | The number of active critical incidents has been raised. |
| High Priority Incident | The number of highly critical incidents which are active and in the raised status. |
| CPU Usage | The amount of CPU utilized (in %) is displayed for each cluster. |
| Memory Usage | The amount of memory utilized (in %) is displayed for each cluster. |