
Documentation
Pulse 3.6.x
Release Notes
Getting Started
Architecture
Installation
Advanced Installation
Pulse Administration
Advanced Feature Integrations
Features
Troubleshooting
User Guide
CLI Guide
Workflows
Additional Resources
Tech Preview
Title
Message
Create new category
What is the title of your new category?
Edit page index title
What is the title of the page index?
Edit category
What is the new title of your category?
Edit link
What is the new title and URL of your link?
About the Logs Summary Page
Summarize Page
Copy Markdown
Open in ChatGPT
Open in Claude
Connect to Cursor
Connect to VS Code
The Pulse Logs Summary page enables you to check the log summary of applications running in your ecosystem.
To access the Logs Summary Page, log in to the Pulse UI and navigate to Home > Logs Summary.
For the initial analysis, you can analyze the Logs Summary shown on the Pulse UI Home page:
- Service: Logs are organized by service for easier navigation.
- Error / Warn: Shows the number of errors and warnings per service.
- Last 7 days trend: Visualizes error and warning trends over the past 7 days for proactive monitoring.
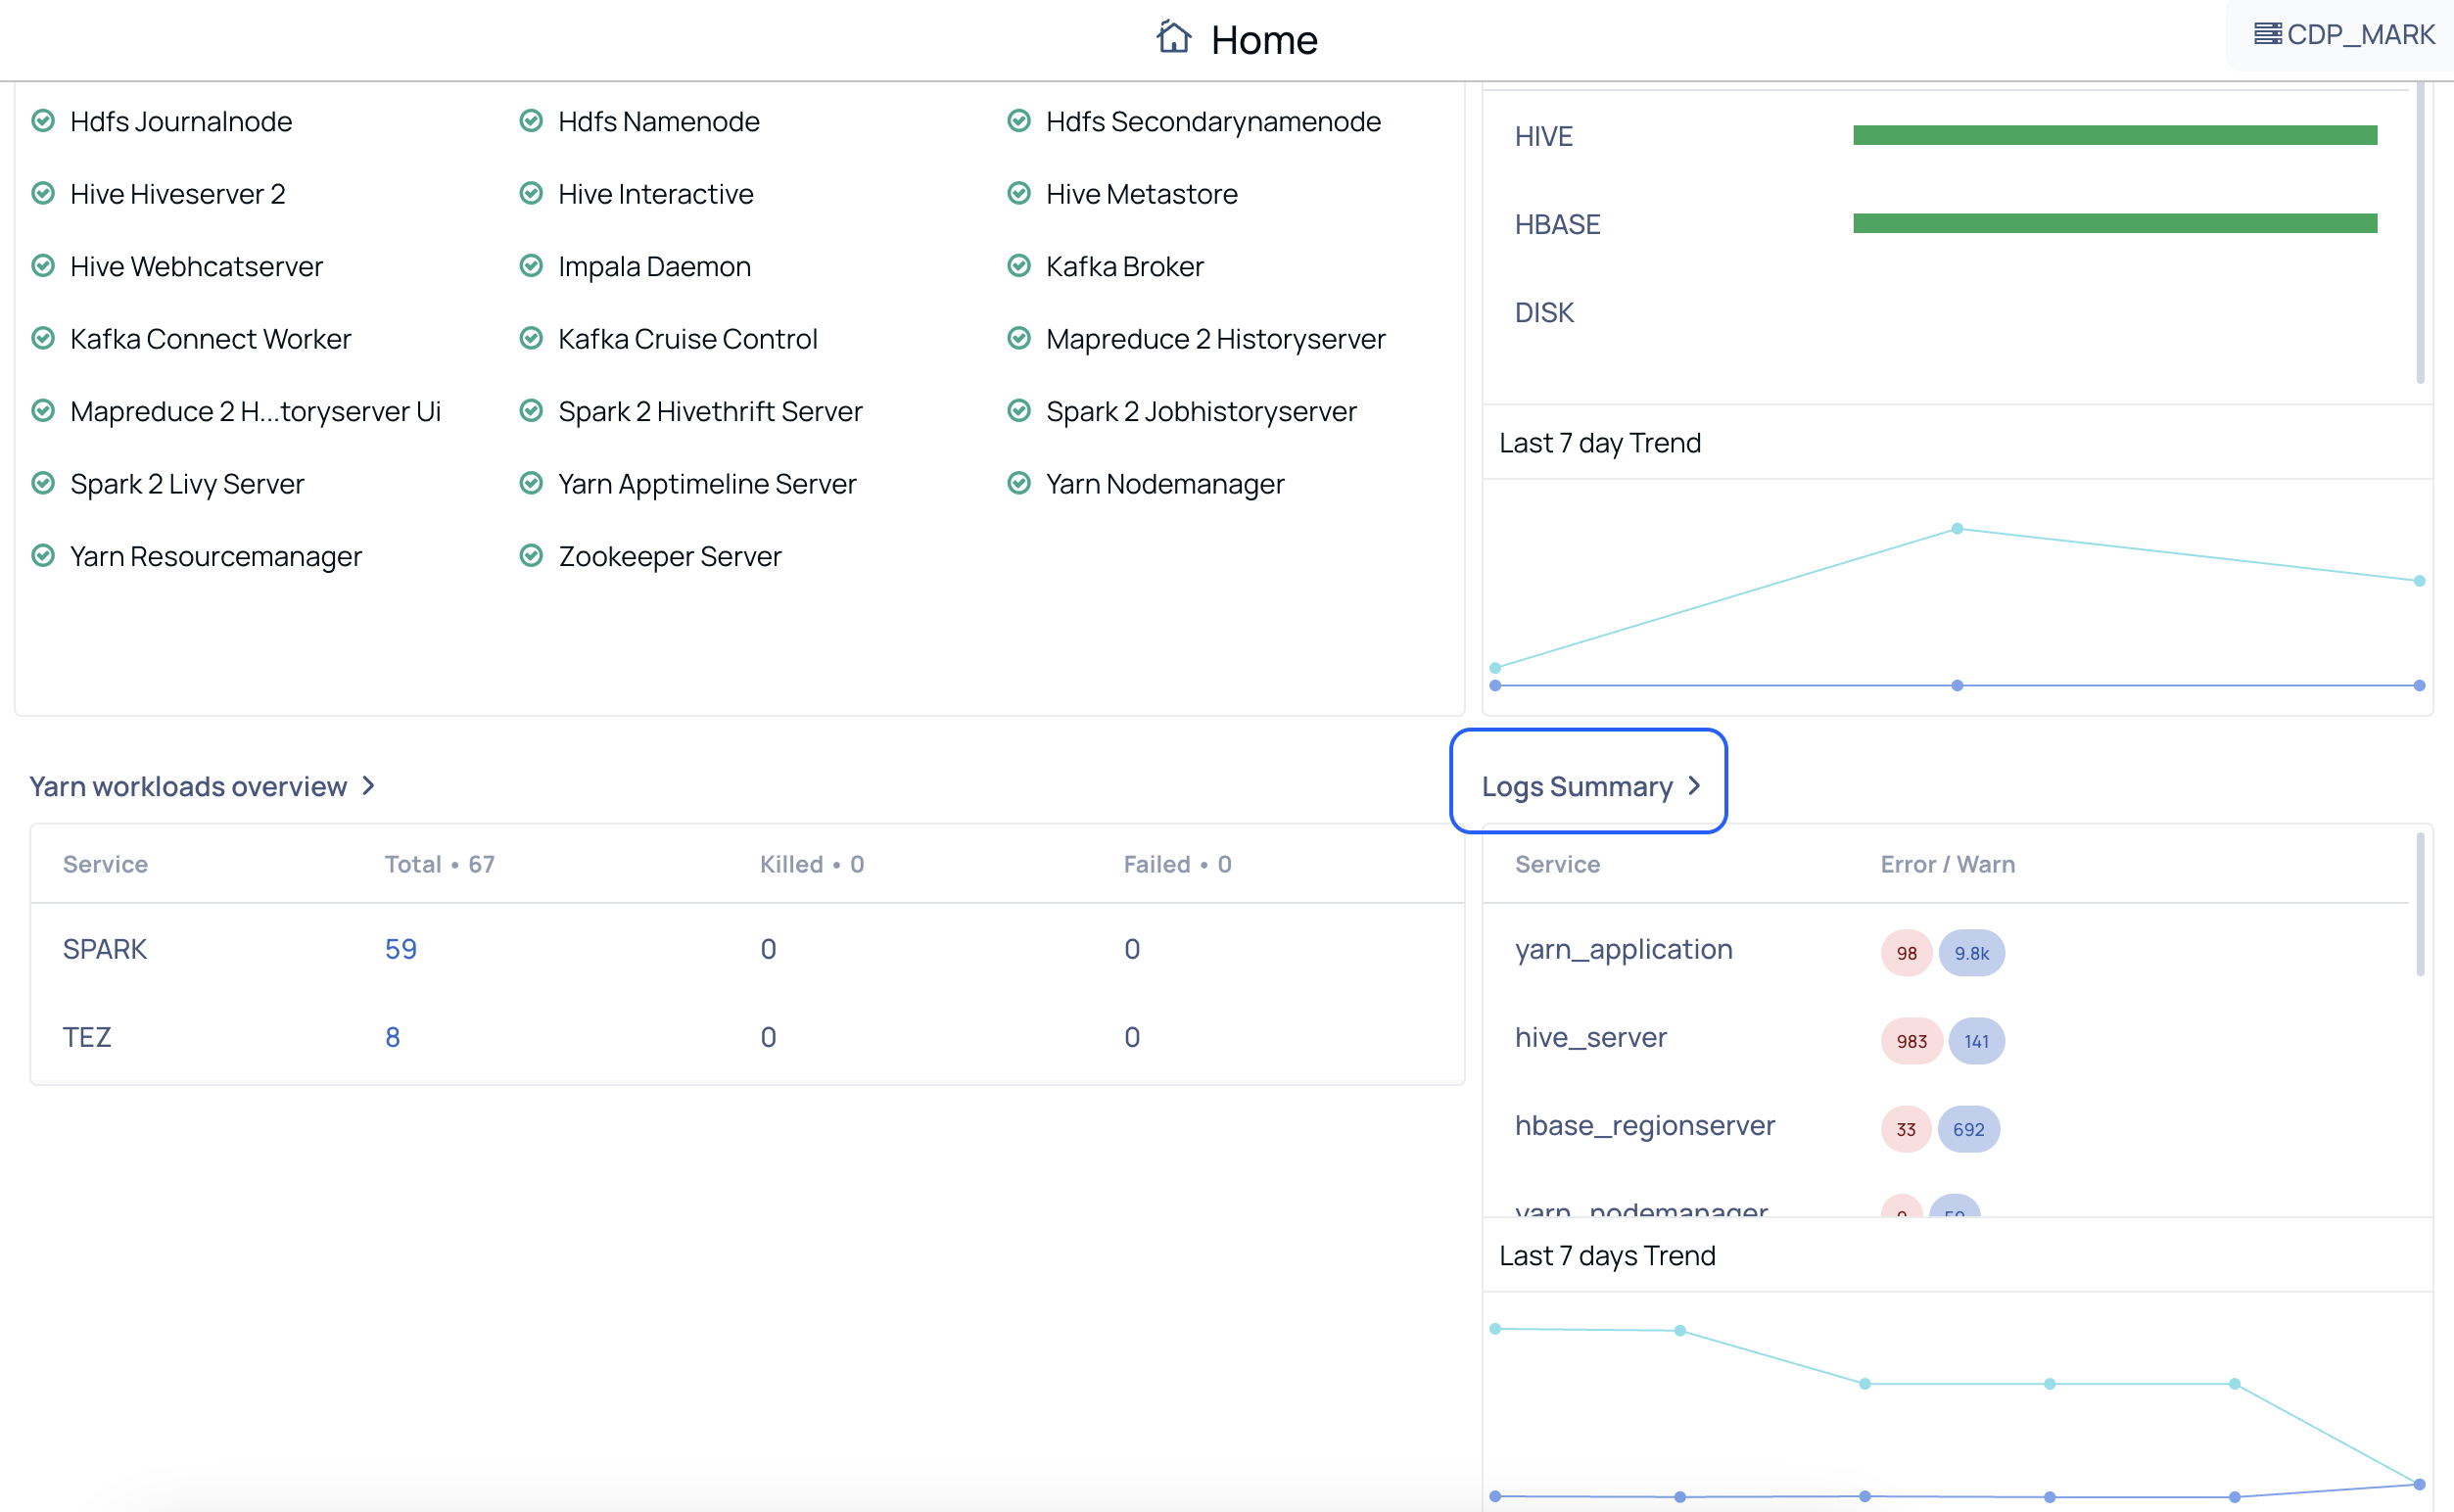
For the detailed analysis, click on Logs Summary. The Logs page appears on the screen, and the logs are categorized into Application Logs, HDFS Audits, and Ranger Audits for streamlined monitoring and precise analysis. You can click on the respective tab to access the logs.
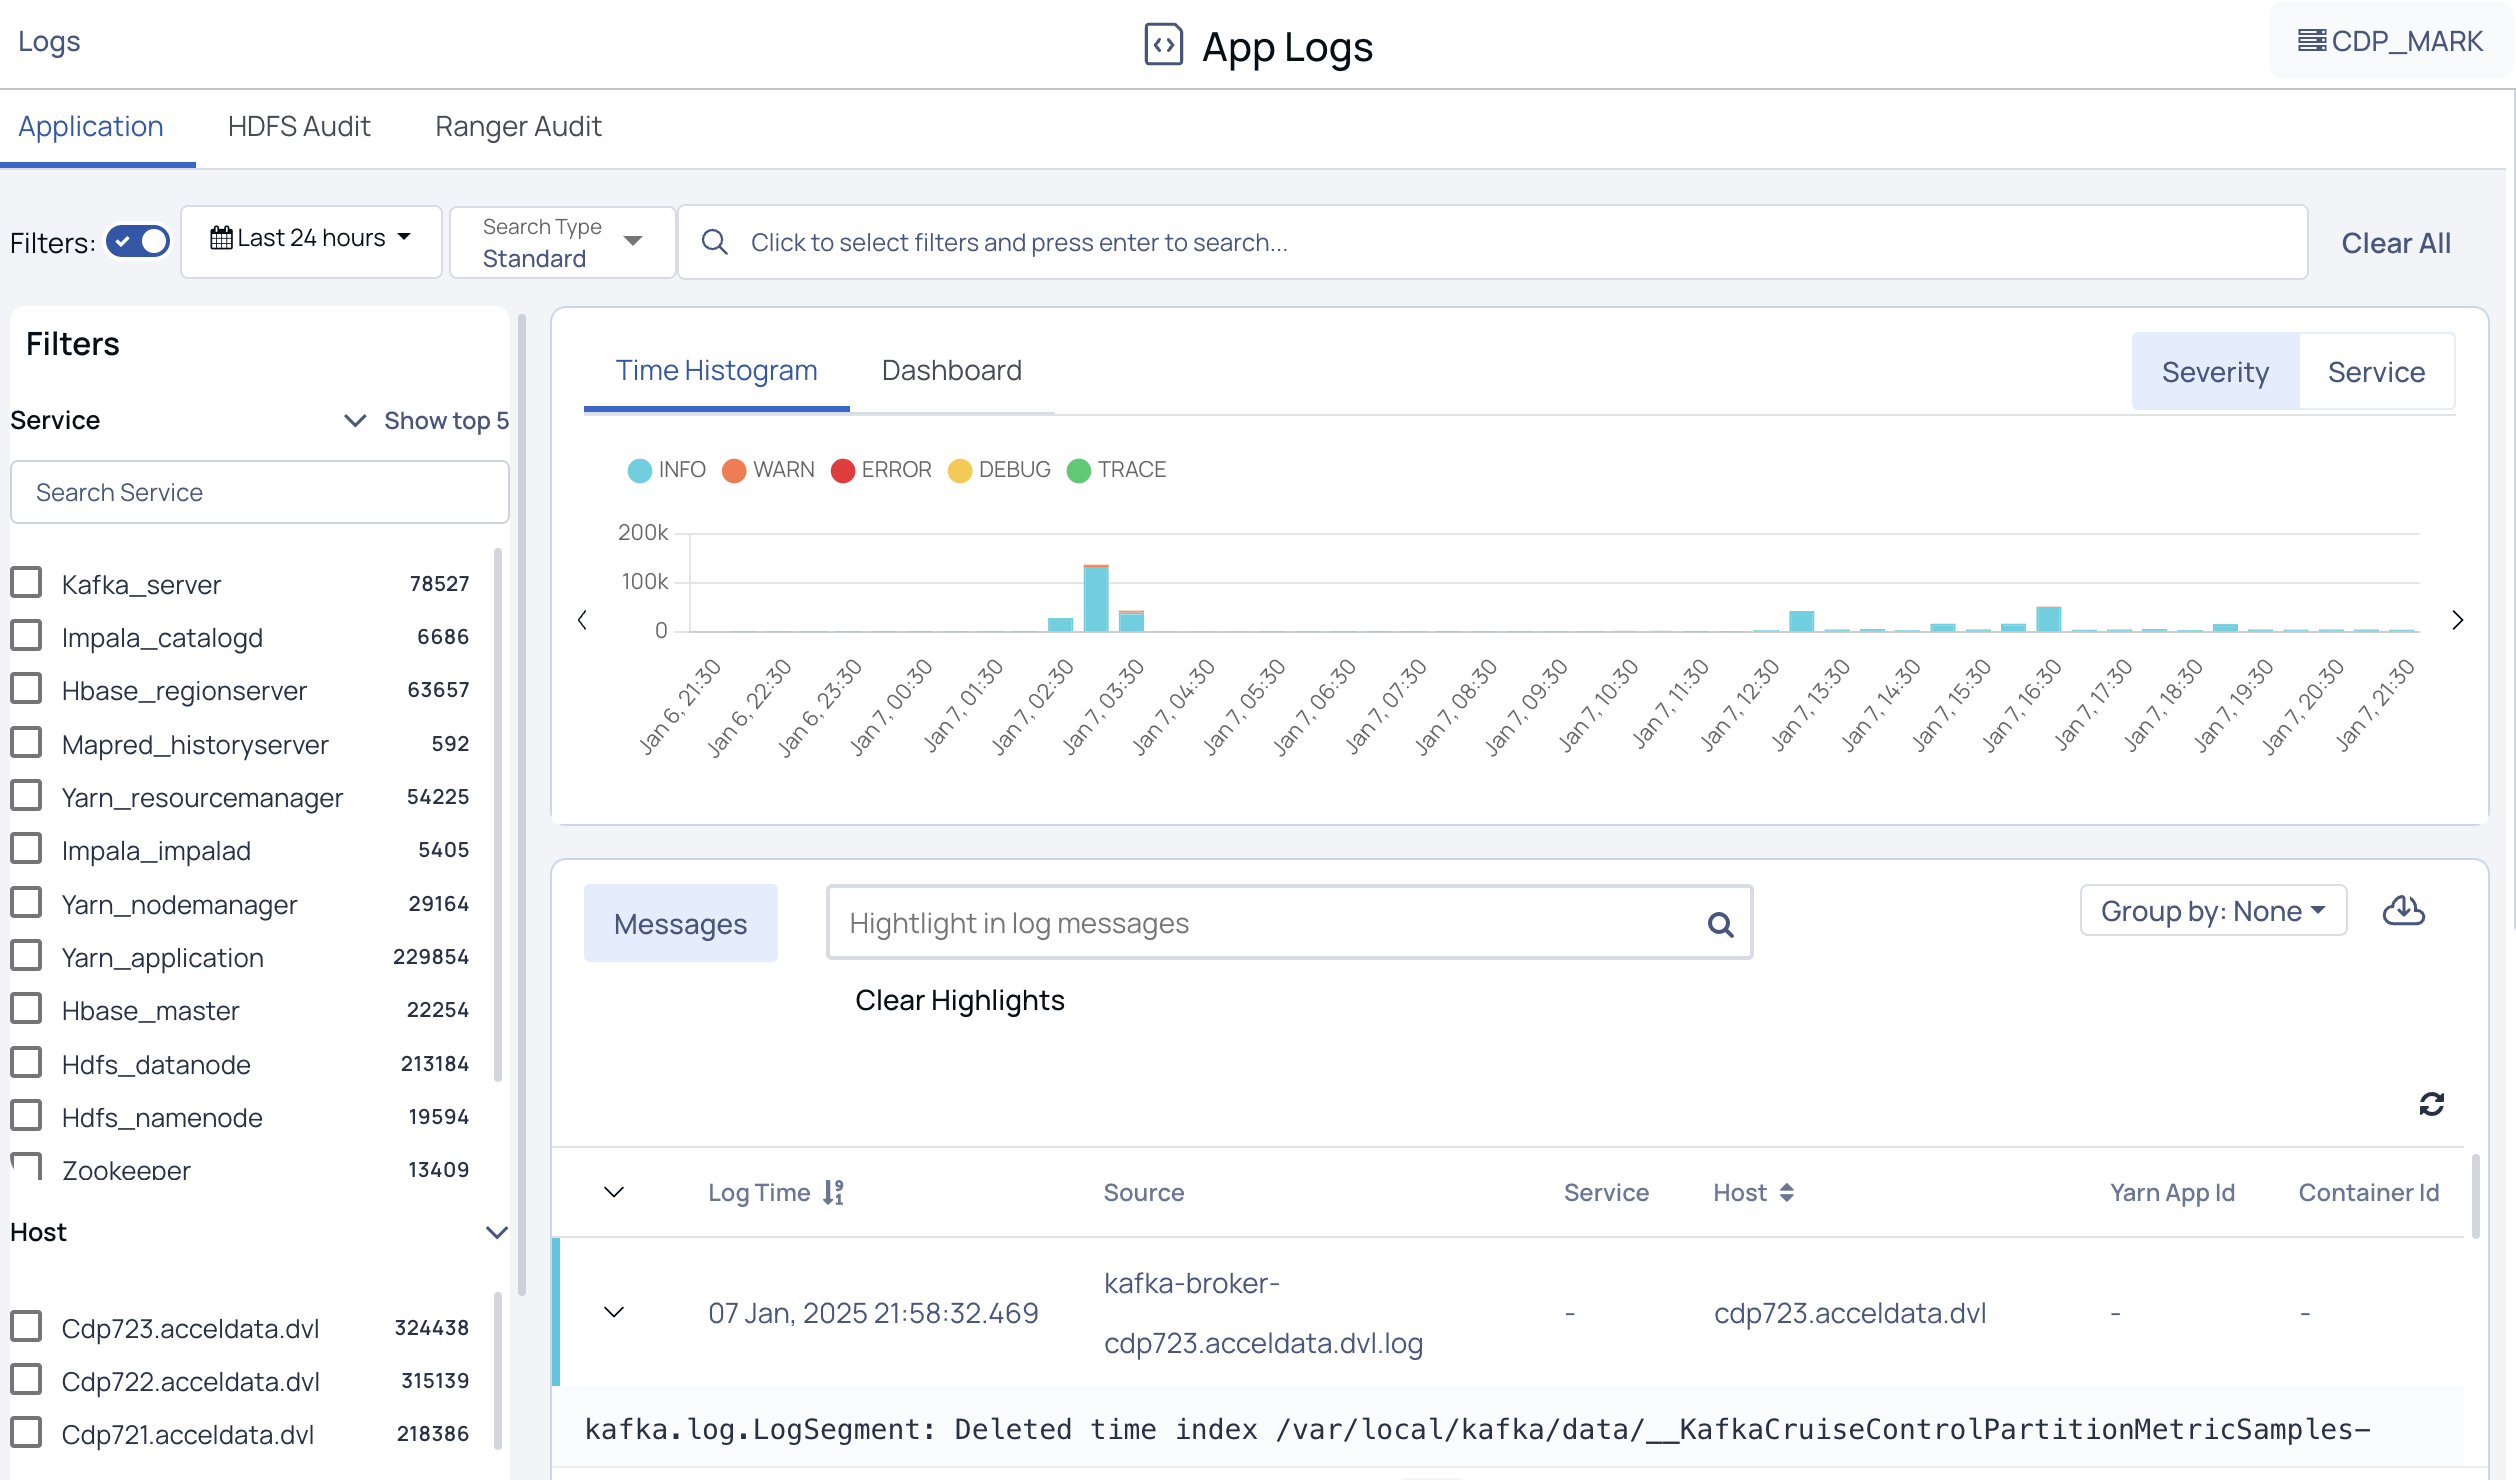
For more details, access the following pages:
Type to search, ESC to discard
Last updated on
Was this page helpful?
Next to read:
Analyzing the Application LogsFor additional help, contact www.acceldata.force.com OR call our service desk +1 844 9433282
Copyright © 2026
Discard Changes
Do you want to discard your current changes and overwrite with the template?
Archive Synced Block
Message
Create new Template
What is this template's title?
Delete Template
Message