
Pulse displays application or YARN workload (Jobs and Queries) metrics to help you monitor workloads, optimize resource usage, and troubleshoot performance issues.
Steps
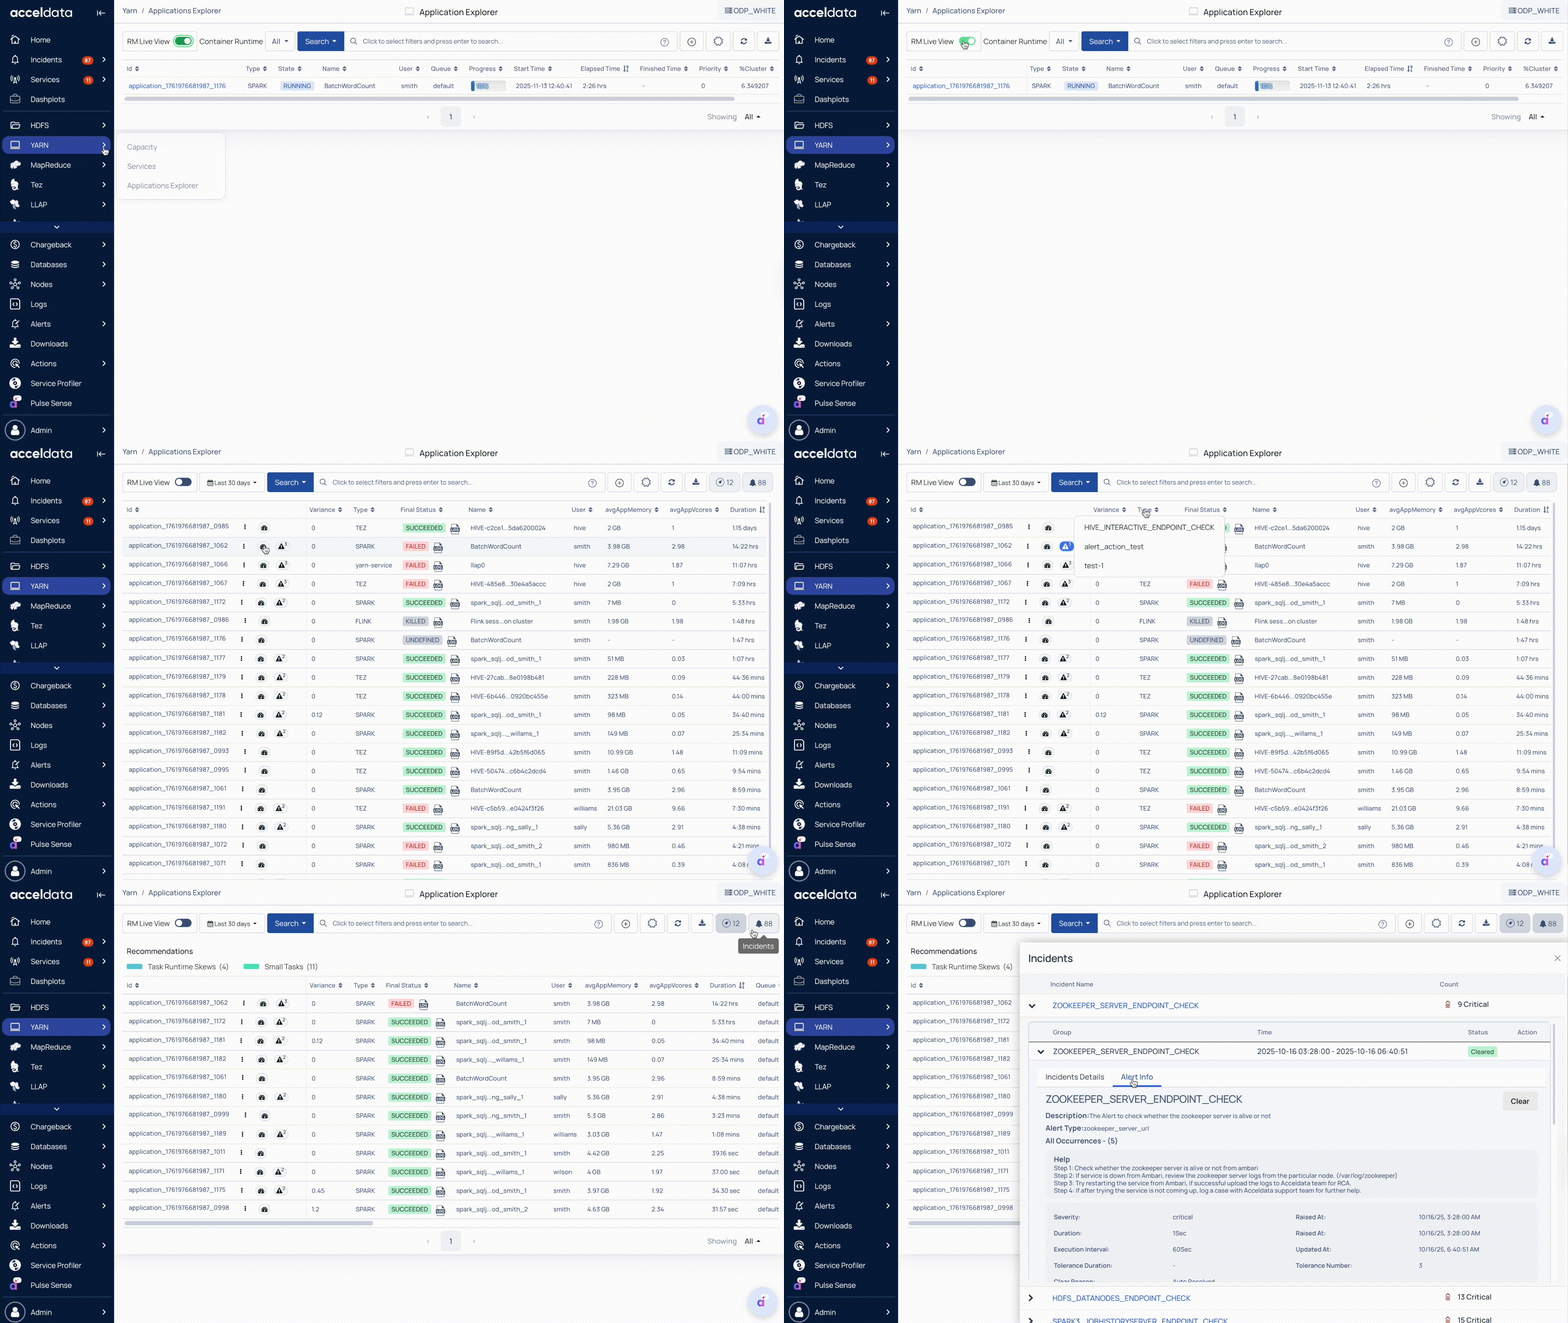
Access Application Explorer
In the Pulse UI, select YARN from the left navigation bar > Application Explorer.
Or, go to Pulse Home and click YARN Workloads Overview.
On the Application Explorer page, set the following.
On the Application Explorer page, set the time range
Choose Today, Last 12 Hours, Last 3 Months, or define a custom period.
Click Apply to view results within the selected time frame.
Enable or Disable RM Live View
Enabled (default): Shows a real-time streaming view from the YARN ResourceManager. Only current resource usage is displayed; completed jobs are not shown.
Disable: Displays all workloads and jobs, including completed ones, using historical metrics stored in the cluster.
Filter by Container Runtime. This is available only on the Enabled RM Live View.
Narrow results based on runtime (for example, >30 min, 1 hr, 2 hr, 4 hr).
Helps identify long-running jobs and optimize resource usage.
Application Metrics
Application Identification
ID / Name / Type – Track specific applications and jobs, and differentiate job types.
User – Identify the job owner for accountability and resource tracking.
Application Status and Duration
Final Status – View job completion states: Succeeded, Failed, Killed, Undefined, Unknown. Helps you quickly identify failures. Click the Logs icon to check the specific application logs.
Start / End / Duration / Total Time – Monitor job timelines and execution efficiency.
Resource Usage
avgAppMemory / maxAppMemory – Memory consumed by the job; helps detect over- or under-utilization.
avgAppVcores / maxContainerCore – CPU cores allocated and used; helps optimize cluster CPU usage.
CPU / Memory % – Percent utilization; helps spot resource bottlenecks.
memoryMbSec / coresSec – Memory and CPU utilization rates; useful for trend analysis and optimization.
Workload Distribution
Containers – Number of YARN containers used; helps monitor parallel processing and workload distribution.
Hosts – Nodes running the job; shows where workloads are executing.
Queue – YARN queue name; helps track job placement and priority in the cluster.
For more details about the application-level metrics, see Application Metrics.
Action Icons
Action icons appear next to the Application ID in Pulse.
Three-dots menu: Provides options, including:
View Concurrency: Check applications (jobs or queries) running at the same time.
Add to Compare: Compare the performance data of two or more applications.
For details, see Analyze Concurrency and Compare Data.
Tachometer icon: Opens metrics for Queue Availability, Concurrent Applications, and Container Availability. For details, see Visualize Application Resources.
Alert icon: Indicates services that require attention. For details, see Track Application Incidents and Alerts.
Check Application Details
Click an Application ID in the table to view the detailed job/query analysis. For example, details about the Spark job, Hive query, etc., navigate to their respective service-level documentation.