
LLAP Dashboard
The LLAP component optimizes the performance of Hive queries. The query processing and execution in LLAP is similar to that of Hive except that LLAP caches the frequently executed queries or data for faster execution and in Hive, all query results are cached. Using Hive with LLAP speeds up query execution and overall performance of Hive.
Click LLAP --> Dashboard in the left pane to access the LLAP dashboard. The dashboard consists of summary panels, a Sankey Diagram, and charts that display information about queries and other related metrics.
Key Performance Indicators (KPI)
KPIs are user-driven analytics criteria to analyze the performance of jobs.
Creating KPIs
To create a KPI for a module, do the following.
Click Create KPI.
The Create window is displayed.
Do the following in the available indices.
In Metric, click the drop-down and choose one metric from the available list.
(Optional) For time-related or memory-related metrics, you can choose the unit of the resultant KPI value. To do so, click the drop-down that appears in the right and select a unit.
In Operator, click the drop-down and choose the operator to measure the metric you selected.
In Metric * 2.5, click the text box for available metrics or type a value in that text box.
The default text Metric * 2.5 indicates that you can perform an operation after choosing a metric to quantify the performance measure.
In Name, type a name for the KPI you are creating.
(Optional) Click the + sign to add another metric to the same KPI.
Click Save.
The KPI is created.
Summary Panel
The summary tiles display several aggregated values. You can click the number on each field to view detailed information about that metric.
The default time range is Last 24 hrs. To view statistics from a custom date range, click the icon and select a time frame and timezone of your choice.
Metric Name | Description |
|---|---|
Users | The total number of users. |
# of Queries | The number of queries being run during the selected timeframe. |
Daemons | The number of persistent LLAP daemons. |
Executors | The number of executors, that is, the JVM processes. |
Succeeded | The number of queries executed successfully. |
Running | The number of queries that are in progress. |
Failed | The number of queries that failed to execute. |
Killed | The number of queries that were killed. |
Context Metric Distributions
The Context Metric distributions panel displays the summary of jobs as a Sankey diagram. You can see the flow of the selected queue to users and to the queries.
The following screenshot is an example of a Context Metric Distributions Sankey chart of the last 24 hours displayed by Duration.
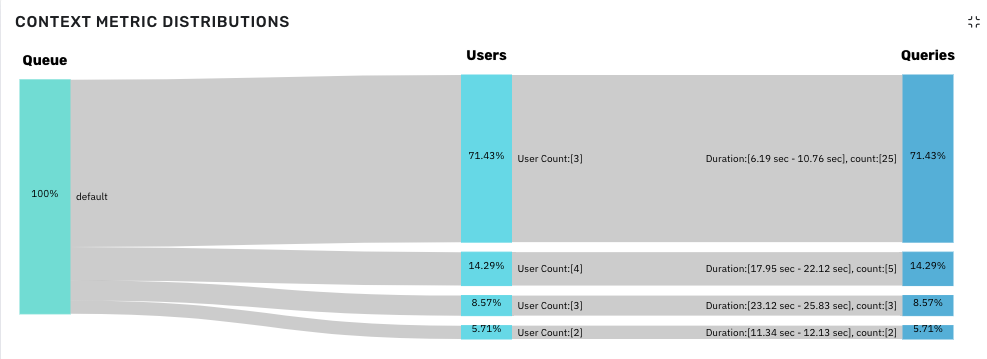
You can gather the following information from the chart.
To see the distribution in numbers, hover over the Sankey chart.
You can observe the following in Queues.
100% of queries are running in
defaultqueue.From Users category, you can gather the following.
71.43% of queries are run by 3 users.
14.29% of queries are run by 4 users.
8.57% of queries are run by 3 users.
5.71% of queries are run by 2 users.
From Queries category, you can gather the following.
25 queries (71.43%) are executed within 6.19 seconds to 10.76 seconds.
5 queries (14.29%) are executed within 17.95 seconds to 22.12 seconds.
3 queries (8.57%) are executed within 23.12 seconds to 25.83 seconds.
2 queries (5.71%) are executed within 11.34 seconds to 12.13 seconds.
Other LLAP Charts
The following charts are also displayed on the LLAP Dashboard.
Chart Name | Description |
|---|---|
Query Execution Count | The number of queries executed within a timeframe. |
Average Query Time | The average time taken to execute queries. This metric also displays the Total Execution Time. |
Top 20 Users (By Query) | The top 20 users that executed the highest number of queries. |
Top 20 Tables (By Query) | The top 20 tables that executed the highest number of queries. |
Failed LLAP Queries
This section displays the following details of LLAP queries that failed execution.
Column Name | Description |
|---|---|
ID | The ID of the failed LLAP query icon next to an ID to view the related log file. |
Queue | The name of the queue the LLAP query is part of. |
Query | The text of the query that failed. |