Snowflake Performance
The Snowflake Performance guide provides detailed monitoring and optimization tools for Snowflake data warehouses. It offers real-time monitoring of query performance, resource use, and system health, resulting in more efficient data processing.
You can leverage precise data and configurable alerts to proactively manage workloads and optimize Snowflake setups for improved performance. This section provides essential guidelines and tips to effectively use ADOC for enhancing your Snowflake data warehouse's efficiency.
The Snowflake Performance tab has the following sections:
Filters
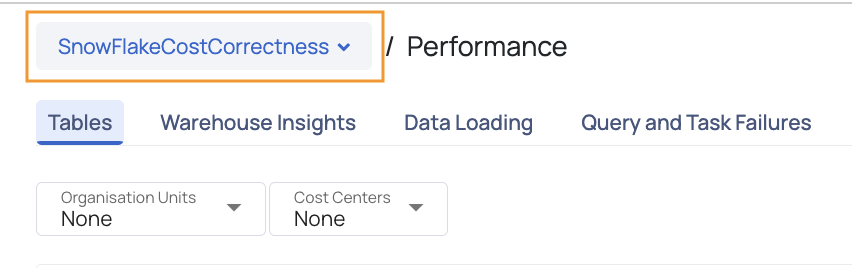
The Data Source Filter allows you to switch the Snowflake data source. This enables you to view and analyze data across various sections based on the selected Snowflake account or project, providing flexibility for monitoring and managing information across different data sources.
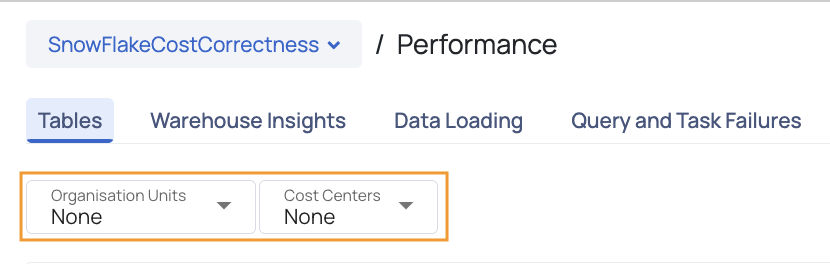
The filters on this page include Organization Units and Cost Centers, allowing you to refine your graphs, dashboards, and tables accordingly.
Tables
Tables Tab
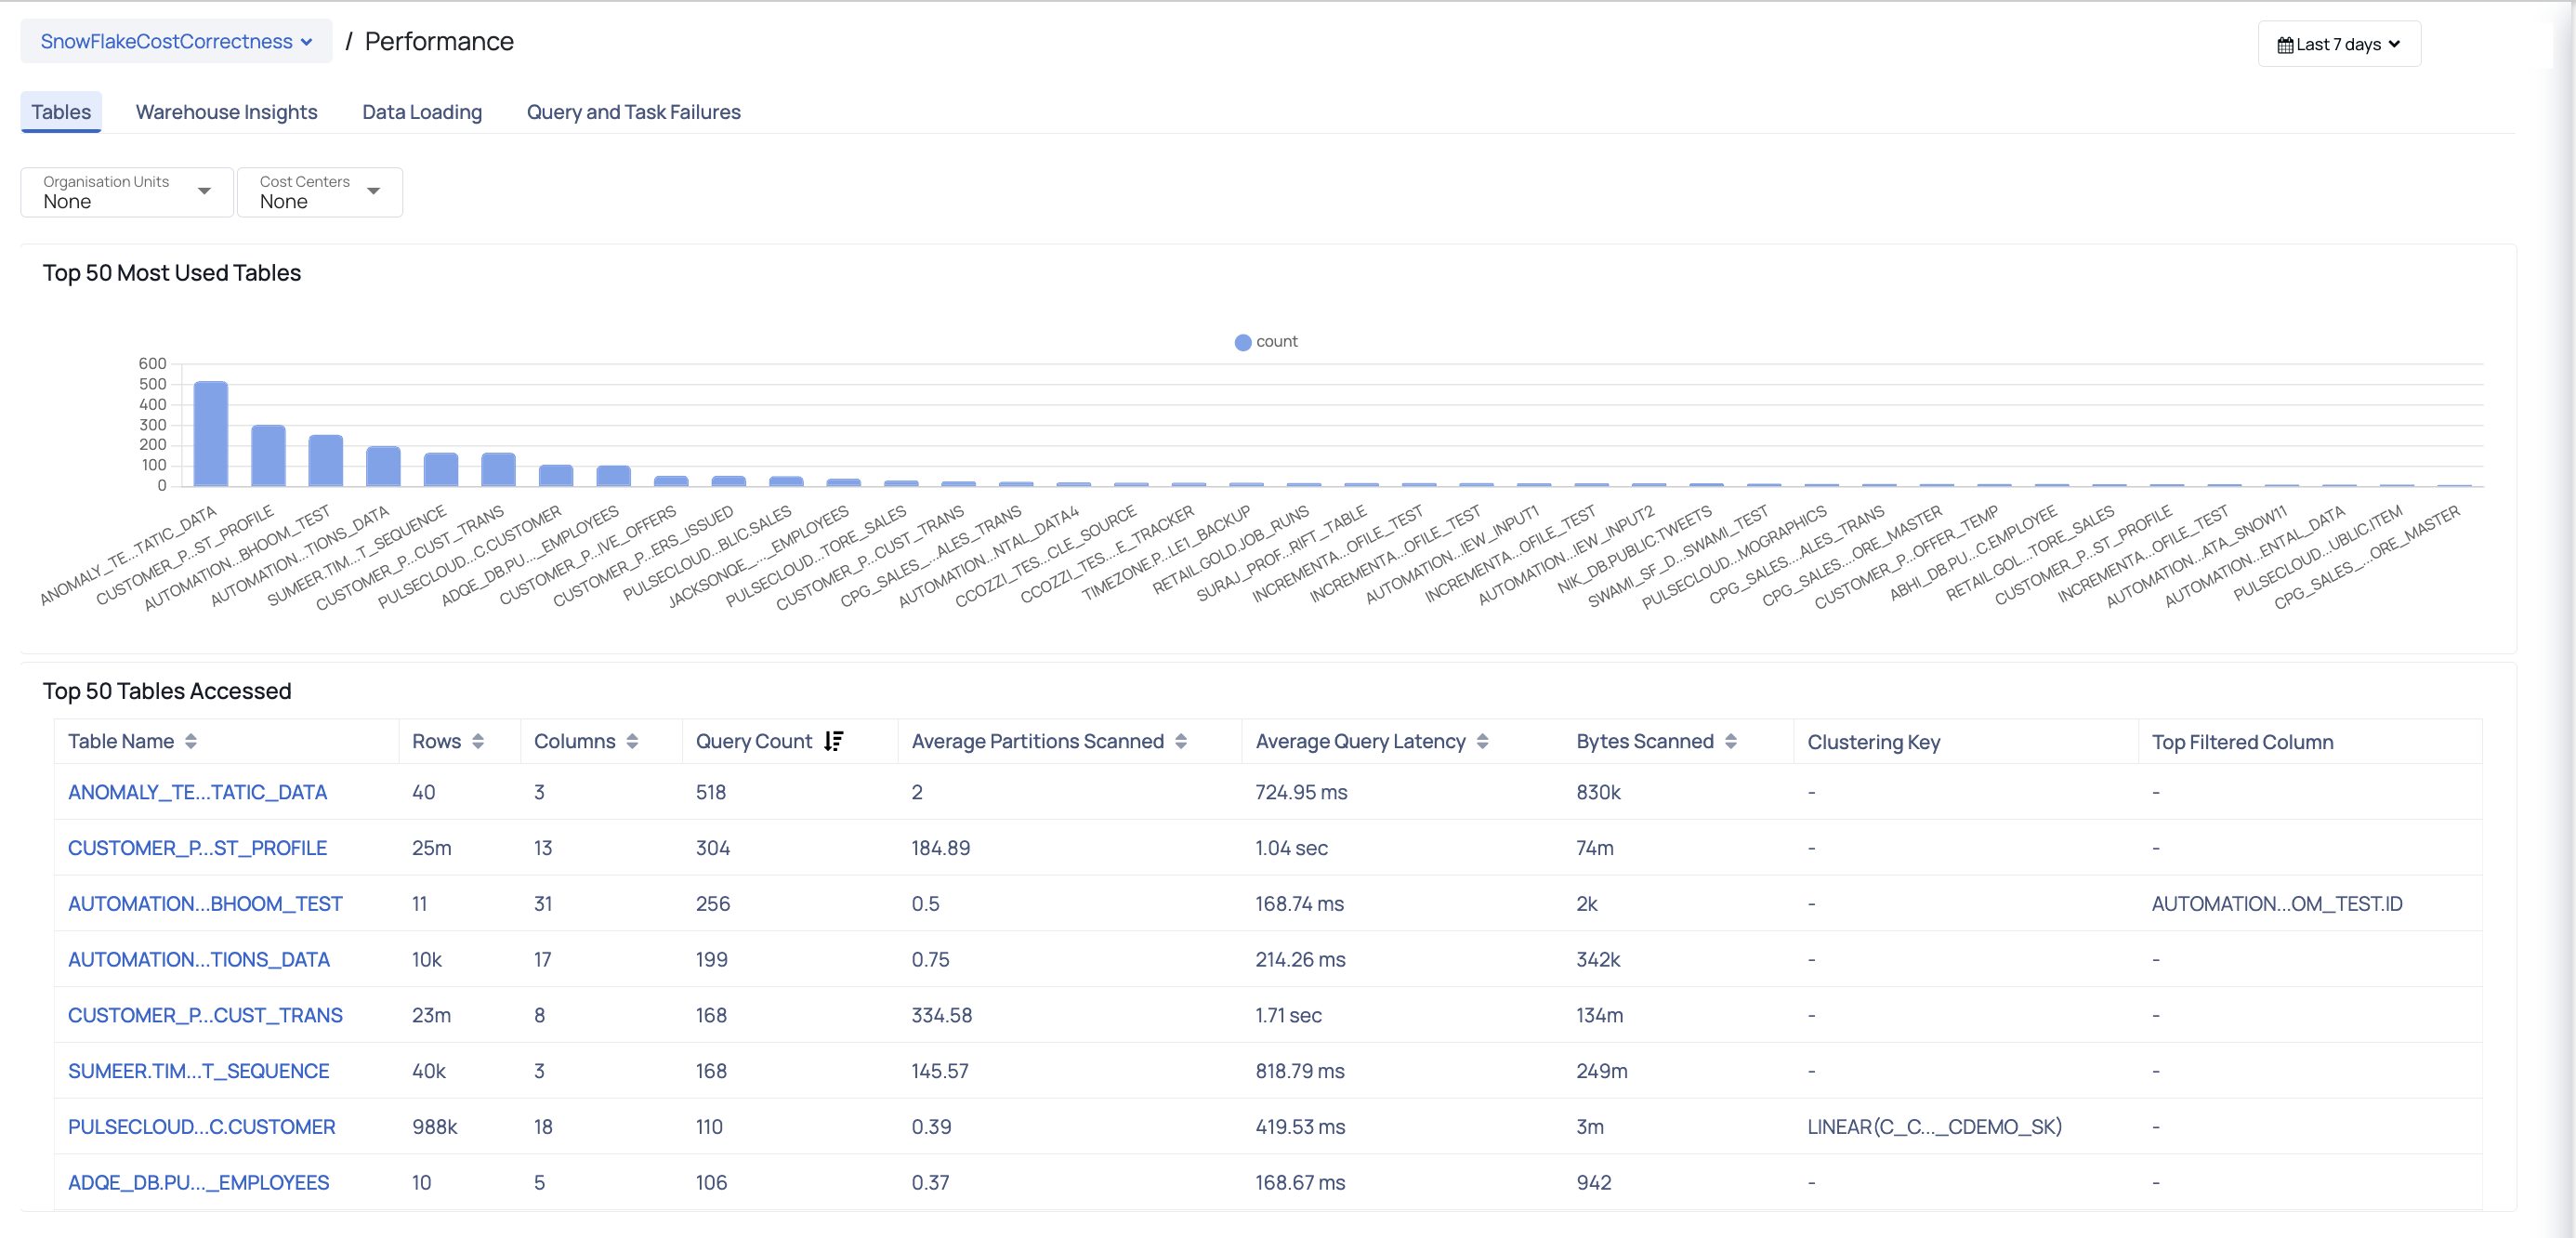
This tab provides all the details of 50 tables which are mostly accessed in your Snowflake account during the time period selected in the Global Calendar. This tab displays the Top 50 Tables Accessed widget where each bar represents a table and displays the number of times the table that was used. Apart from the visualization, you can also view a table which displays all the details of the top 50 database tables used.
| Widget | Description |
|---|---|
| Table Name | The name of the top table. |
| Rows | The number of rows in the table. |
| Columns | The number of columns in the table. |
| Query Count | The number of queries executed on the table. |
| Average Partitions Scanned | The average number of partitions scanned on the table. This value should be much less than the total number of available partitions. |
| Average Query Latency | The average latency experienced by the queries. |
| Bytes Scanned | The total amount of data scanned during query execution, indicating query efficiency. |
| Clustering Key | The clustering keys used to organize table data for improved query performance. |
| Top Filtered Key | The most frequently used keys in query filters for narrowing down results. |
Table Details
Clicking on the table name gives you access to the Details page, which provides various widgets to assess the performance of the table within your Snowflake database.
When viewing table metadata and clustering information, you gain valuable insights into table performance and column accessibility. This enables you to make well-informed decisions regarding optimization strategies. By understanding the table's characteristics and the specific columns being accessed, you can determine the appropriate optimizations to enhance query performance and overall data efficiency. This information empowers you to take proactive steps towards improving table performance and maximizing the benefits of their data analysis and processing workflows.
Warehouse Insights
Warehouse Insights Tab
The Warehouse Insights tab displays warehouse performance data. To view data for a specific time period, you must apply the Global Calendar filter. In addition to the Global Calendar, you can use the Filters section to view data specific to warehouses and databases.
This tab contains multiple charts that provide detailed performance insights. These charts also allow you to filter data for specific warehouses. If all warehouses are selected in the Filters section, you can further refine the data by selecting individual warehouses directly within the chart filters. However, if specific warehouses are already selected in the Filters section, the charts will display data only for those selected warehouses, and the chart filters cannot be applied in this case.
| Widget | Description |
|---|---|
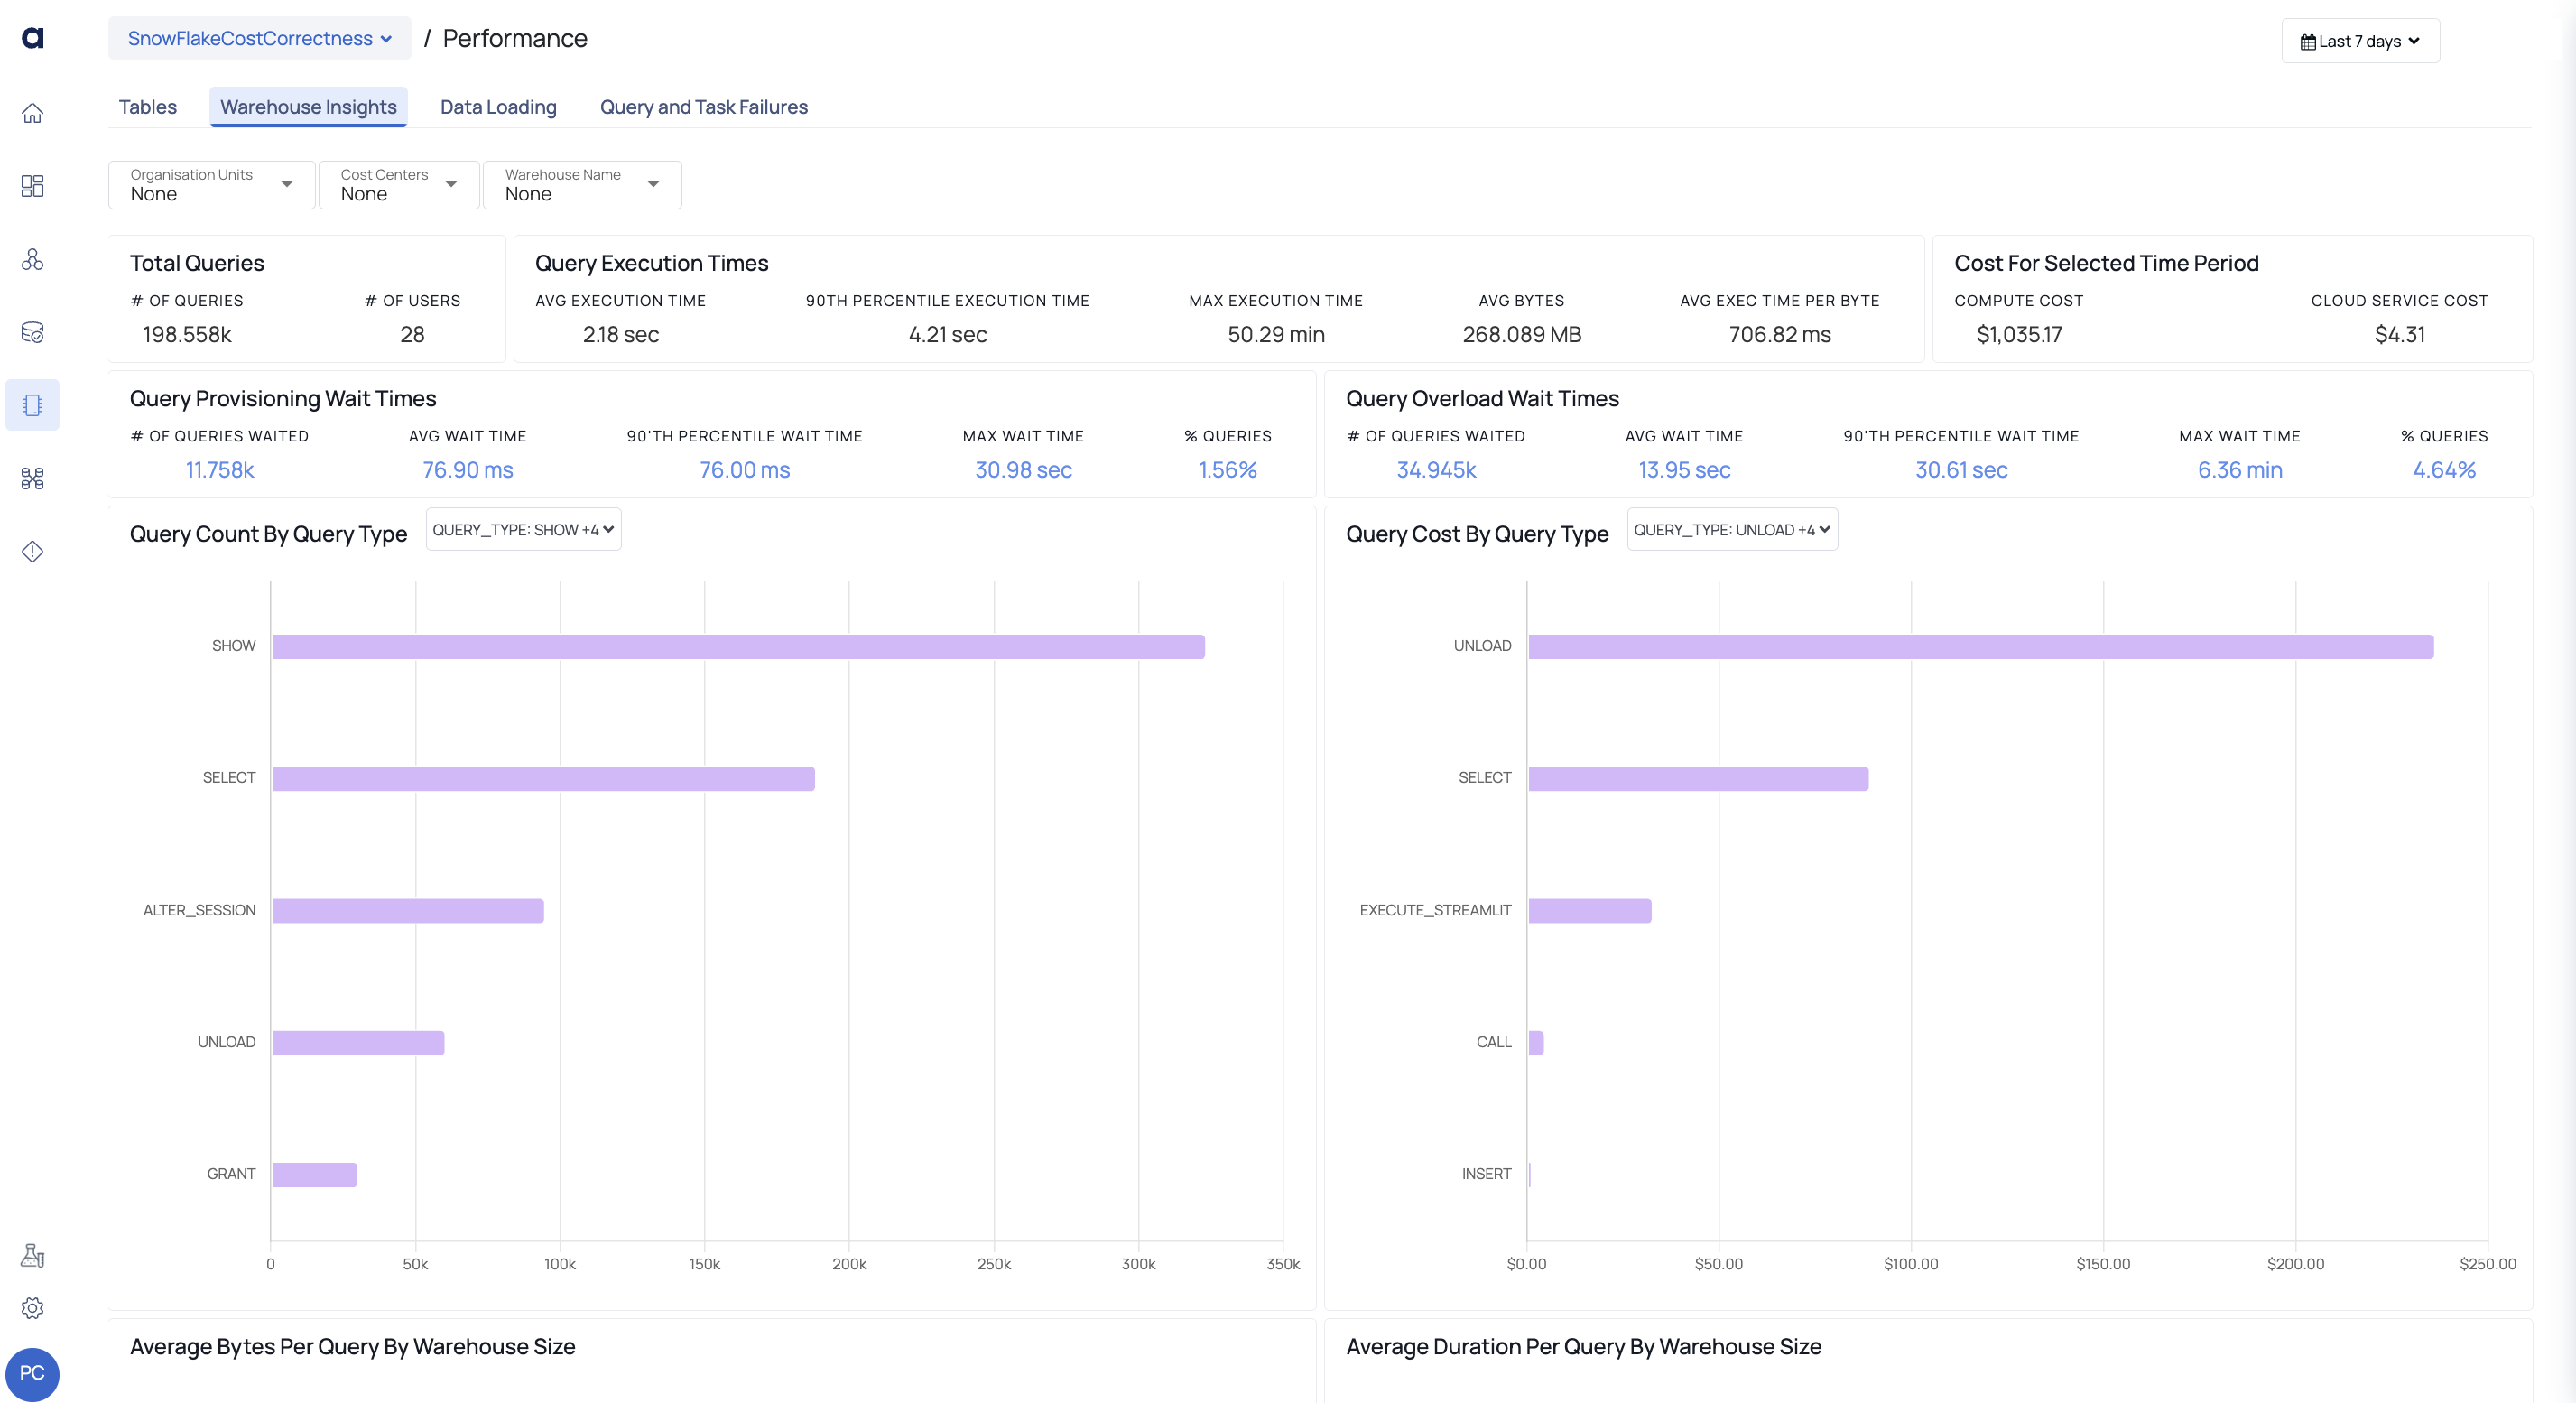
| Total Queries | This chart provides an overview of all queries executed on the warehouse. It displays the total number of queries executed and the total number of users who ran them. This gives users a clear understanding of the overall query activity and user participation within the selected time period. |
| Query Execution Times | This chart summarizes query execution performance. It includes the average execution time, 90th percentile execution time, and maximum execution time. Additionally, it displays the average size of the queries in bytes and the average execution time per byte. These values help users identify slow-performing queries and evaluate query efficiency. |
| Cost for Selected Time Period | This chart displays the cost associated with query execution within the selected time period. It breaks the cost into two components: compute cost and cloud service cost. These values help users monitor expenditures and optimize resource usage to ensure cost efficiency. |
| Query Provisioning Wait Times | This chart displays the wait times for queries during warehouse provisioning. It includes the number of queries that experienced delays, the average wait time, the 90th percentile wait time, and the maximum wait time. It also shows the percentage of queries that were affected. This information helps users identify delays caused by warehouse provisioning and assess their impact on query performance. |
| Query Overload Wait Times | This chart focuses on queries that were delayed due to warehouse overload. It provides insights into the number of affected queries, the average wait time, the 90th percentile wait time, and the maximum wait time, along with the percentage of queries impacted. This helps users understand the effect of system overload on query performance and optimize warehouse capacity. |
| Query Count By Query Type | This bar chart displays the total number of queries executed, grouped by query type. Each bar represents a specific query type, such as SHOW, SELECT, UNLOAD, or GRANT. The length of each bar indicates the count of queries executed for that type. By hovering over a bar, users can view the exact number of queries for that specific query type. This visualization helps users identify the most frequently executed query types and analyze query usage patterns |
| Query Cost By Query Type | This bar chart visualizes the cost distribution for queries based on their type. Each bar represents a query type, such as UNLOAD, SELECT, or EXECUTE_STREAMLIT, and the length of the bar indicates the total cost incurred by that query type. Hovering over a bar displays the exact cost for that query type. This chart helps users identify which query types are the most resource-intensive and take steps to optimize their execution for cost savings. |
| Average Bytes Per Query By Warehouse Size | This bar chart displays the average query size, in bytes, grouped by warehouse size. Each bar corresponds to a specific warehouse size, such as X-Small, Small, or Medium. The length of the bar indicates the average size of queries executed within that warehouse size. This chart helps users understand which warehouse sizes are processing larger queries on average. |
| Average Duration Per Query By Warehouse Size | This bar chart shows the average query execution duration, grouped by warehouse size. Each bar represents a specific warehouse size, such as X-Small, Small, or Medium. The length of the bar indicates the average time it takes to execute a query for that warehouse size. This helps users assess query performance relative to warehouse sizes and identify any discrepancies in execution time. |
| Top 15 Users | This bar chart lists the top 15 users based on the number of queries executed. Each bar represents a user, and the height of the bar indicates the total query count for that user. By hovering over the bar, users can see the exact query count for each individual user. This chart helps identify the most active users within the warehouse and analyze their query usage patterns. |
| Top 15 Frequent Queries | This table displays the 15 most frequently executed queries. It includes three columns:
|
| Warehouse Metrics | This table provides detailed metrics for individual warehouses. The table includes the following columns:
|
Data Loading
Data Loading Tab
This tab displays information about how data is loaded into your Snowflake accounts. You can apply the Global Calendar filter to view data for a specific time period. Additionally, you can use filters to refine the data displayed for specific Databases, Schemas, or Tables.
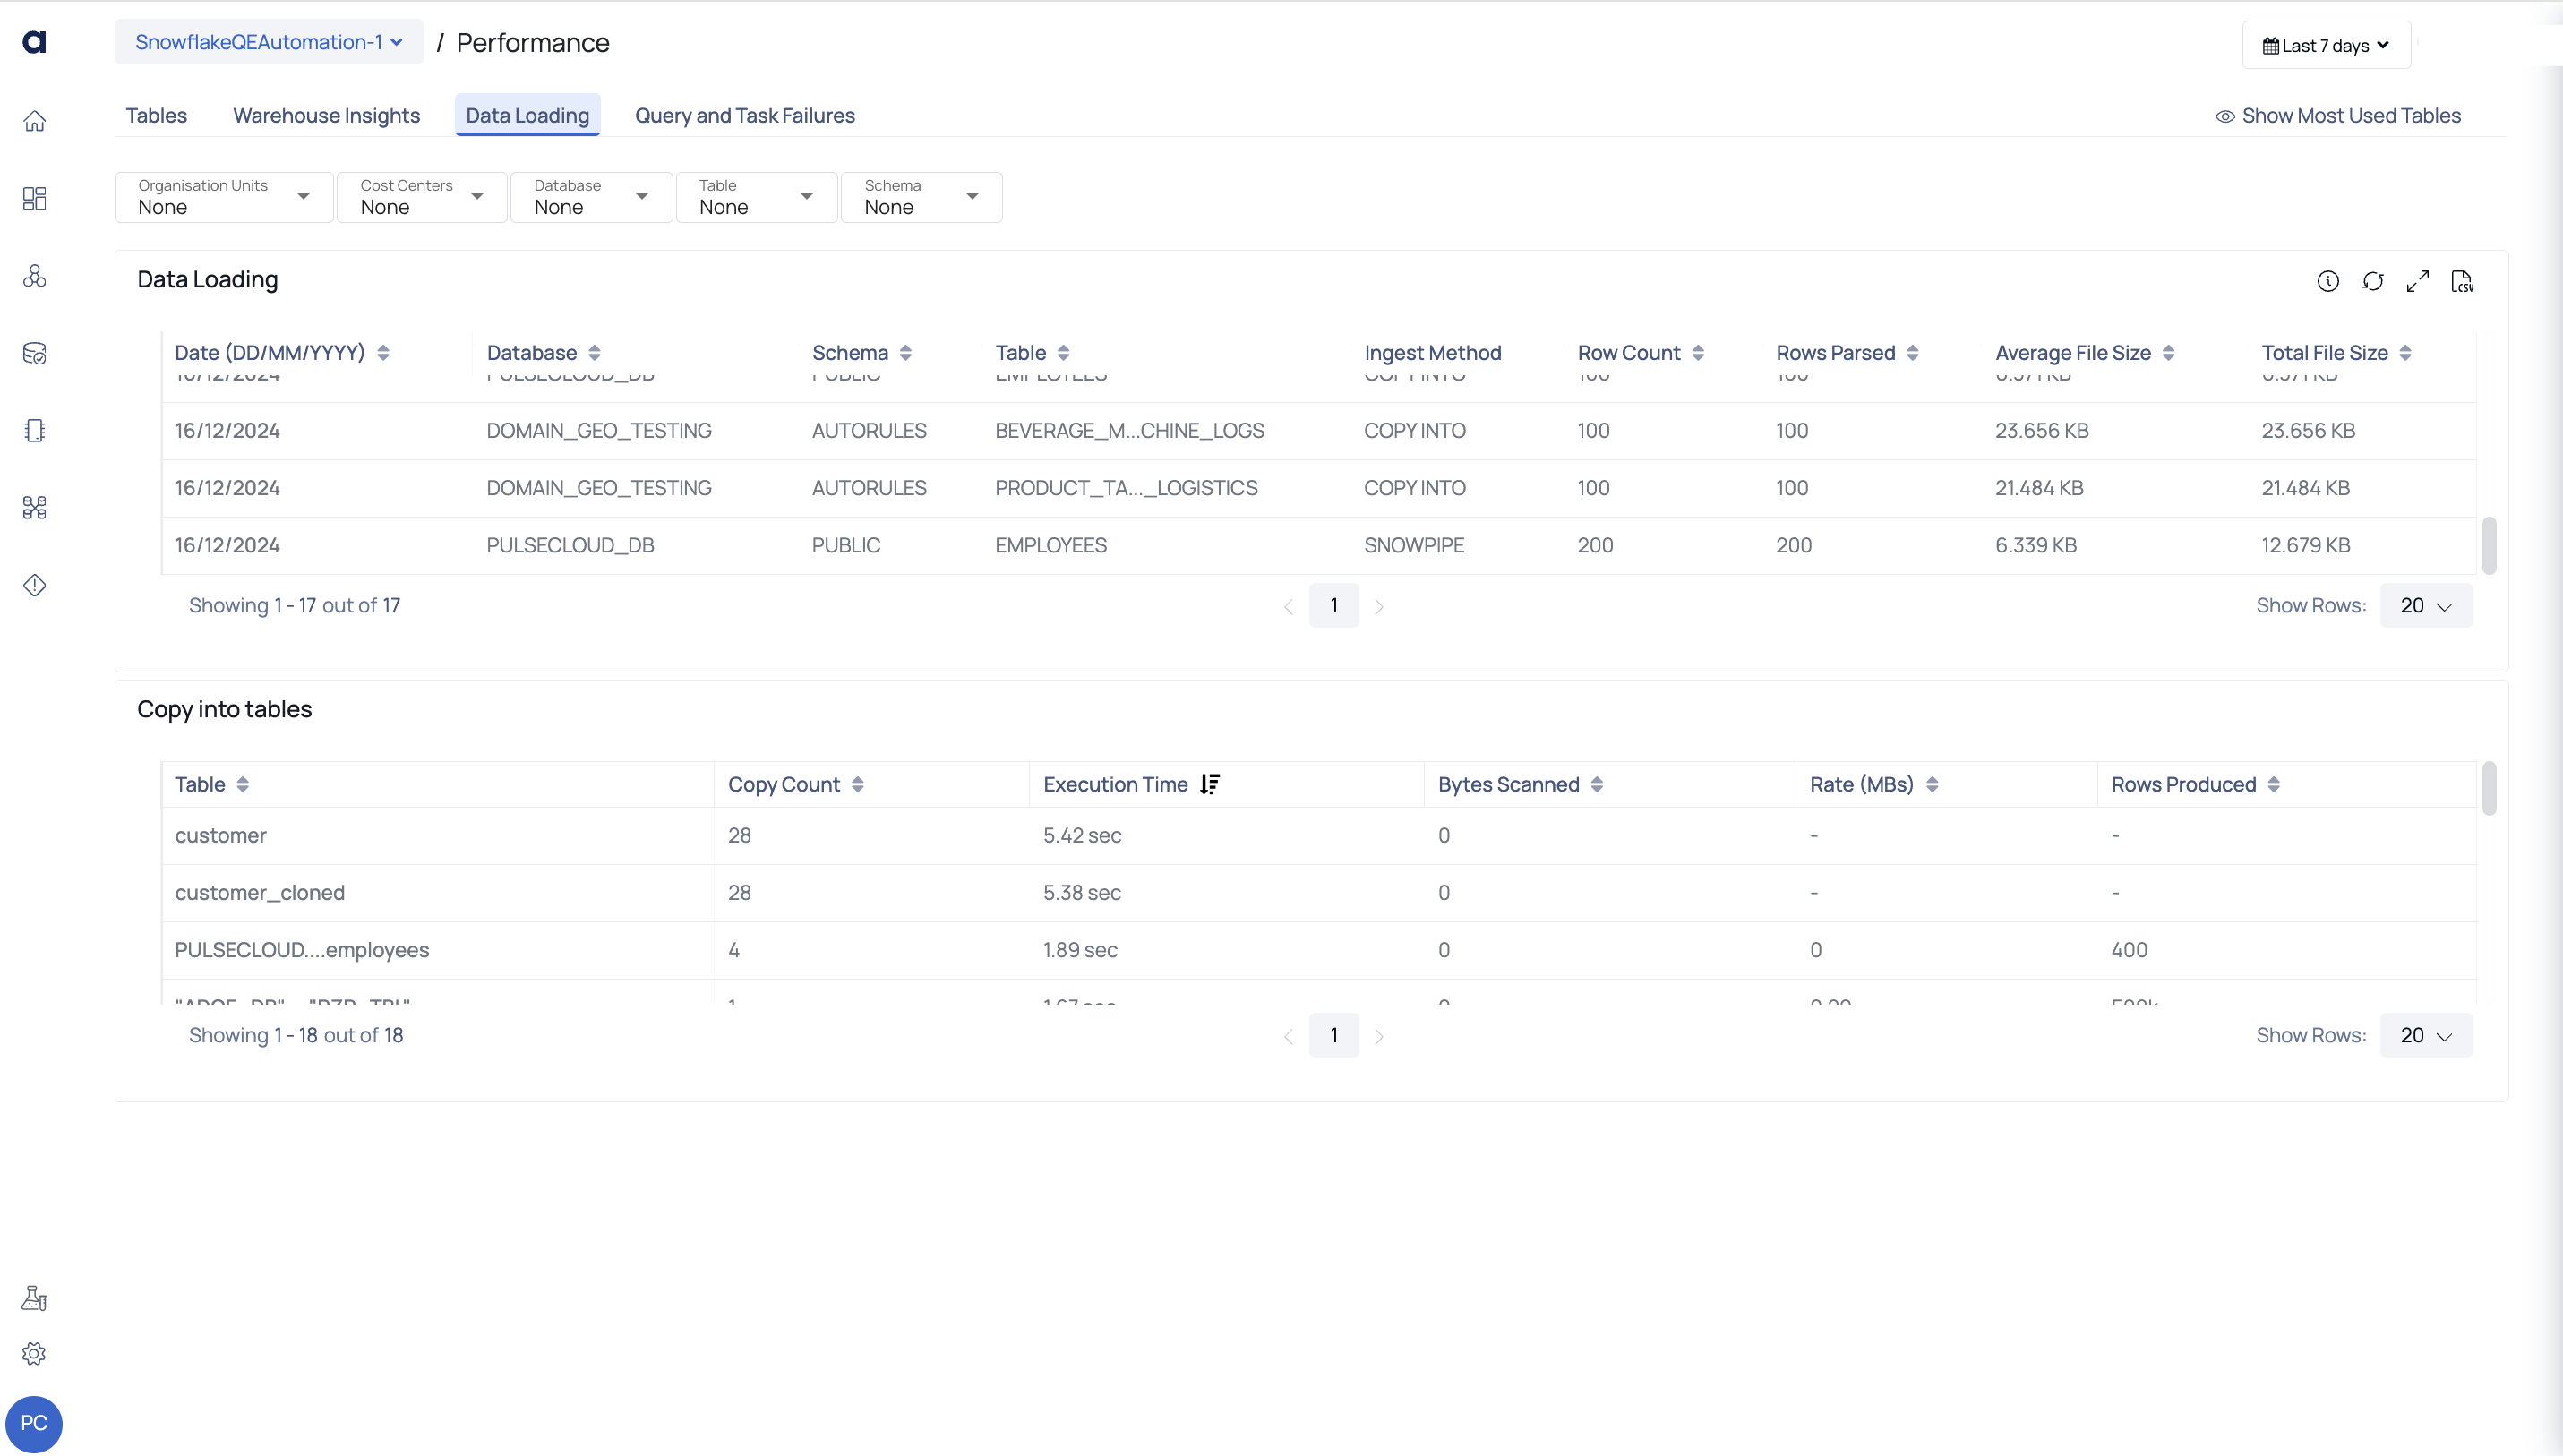
The Data Loading section provides details such as the date of data loading, database and schema names, table names, ingest methods, row counts, rows parsed, average file size, and total file size.
The Copy into Tables section shows insights on data copied into tables, including table names, copy count, execution time, bytes scanned, rate in megabytes per second, and rows produced.
| Widget | Description |
|---|---|
| Data Loading | This table displays the details of data loaded into Snowflake, during the time period selected in the Global Calendar. In this table, you can view details of all the data ingestion methods used to ingest data to Snowflake. You can filter the data on this table by Ingestion method, Rows count, or Rows Parsed. |
| Date | The date on which data was loaded into Snowflake. |
| Database | The database into which data was loaded. |
| Schema | The schema into which data was loaded. |
| Table | The table into which data was loaded. |
| Ingest Method | The ingestion method used to ingest data. |
| Row Count | The number of rows added during the ingest. |
| Rows Parsed | The number of rows parsed during the ingest. |
| Average File Size | The average value of size of all the ingested files. |
| Total File Size | The total size of all the ingested files. |
| Copy Into Tables | This table displays all the details of data ingested to Snowflake through the Copy Into method. You can filter the data on this table to view data specific to a Table, number of copy operations performed, execution time, and number of rows produced. |
| Table | The name of the table. |
| Copy Count | The number of times copy into operation was executed on the table. |
| Execution Time | The total execution time to complete the copy into operation. |
| Bytes Scanned | Bytes of data scanned during the copy into operation. |
| Rate (MBs) | The rate of data transfer (in Mega bytes) in the copy into operation. |
| Rows Produced | The number of rows produced during the copy into operation. |
Query and Task Failures
This tab displays the errors caused in various snowflake operations. You can apply filters in the Global Calendar to view data specific to a time period.
Query and Task Failures Tab
| Widget | Descriptions |
|---|---|
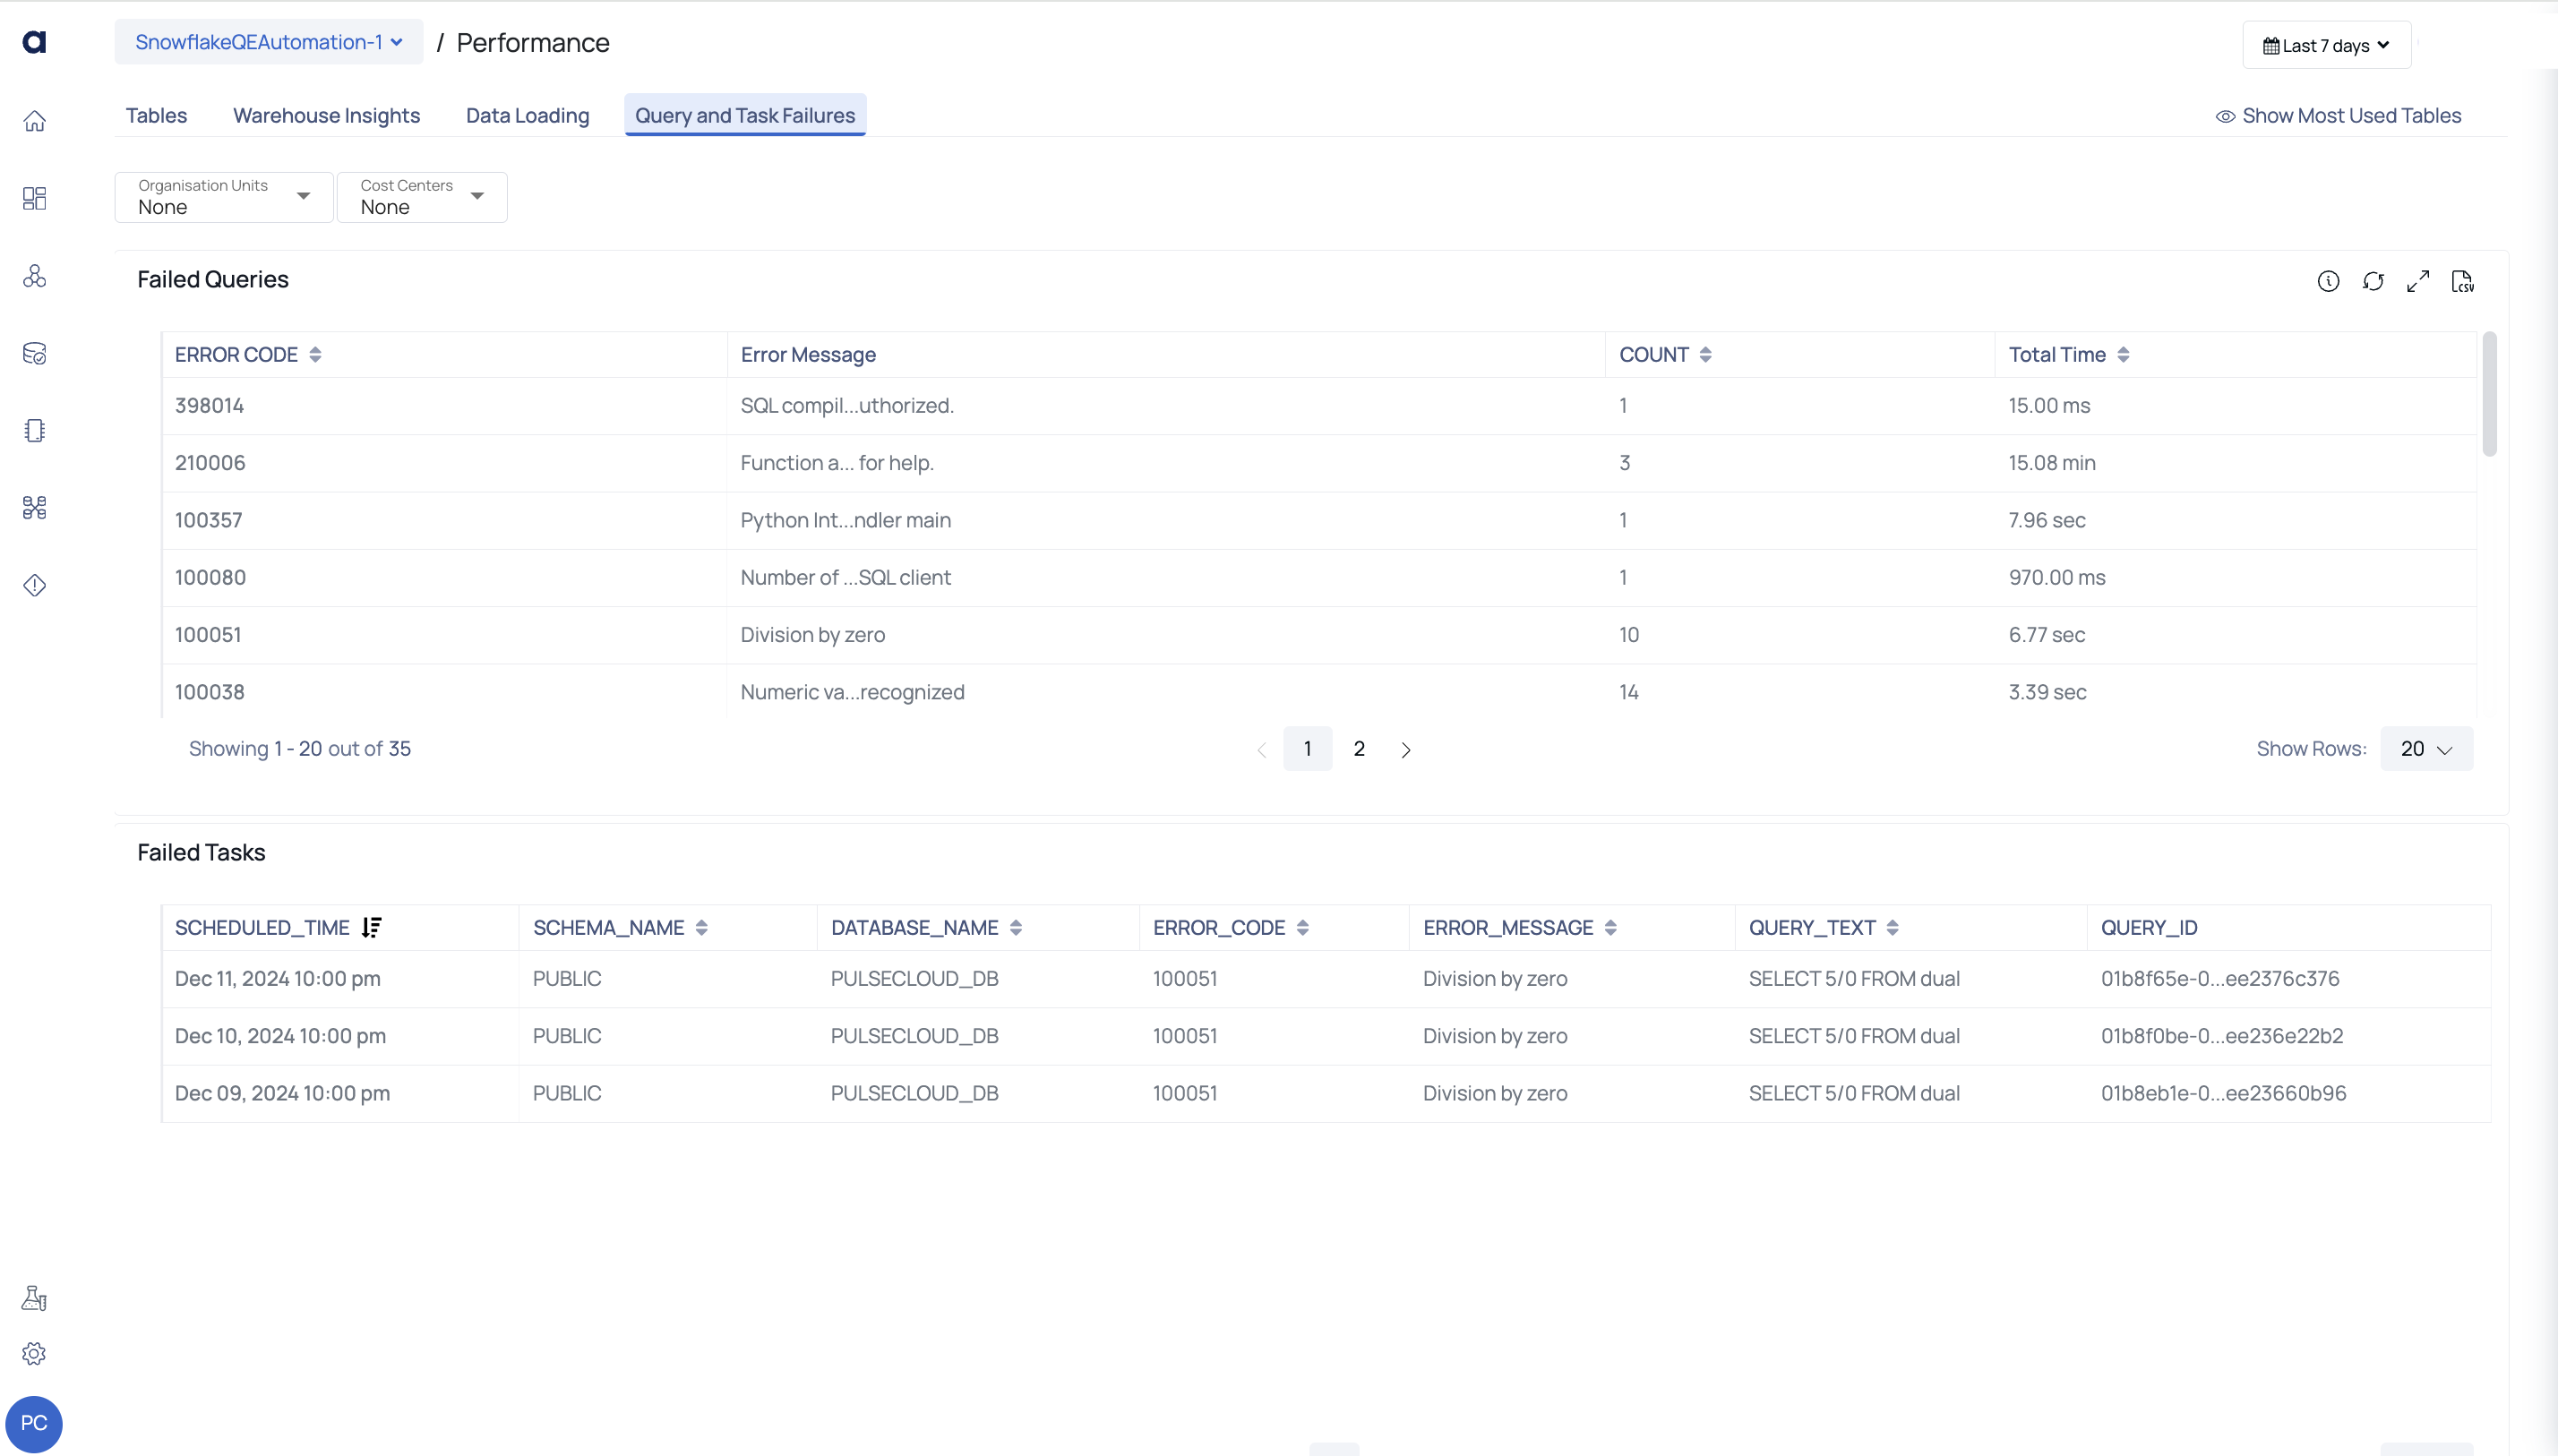
| Failed Queries | This table displays all the details of the Queries whose execution failed. You can filer the data by Query error codes. |
| Error Code | The error code assigned to the failed query. |
| Error Message | The error message recorded for the failed Query. |
| Count | The number of times the Query failed. |
| Total Time | The total time during the which the error existed. |
| Failed Tasks | This table displays the details of Snowflake tasks that failed. |
| Long Running Tasks | This table displays the details of Snowflake tasks that take a lot of time to complete. |
| Stale Streams | This table refers to outdated or irrelevant data sources that no longer provide accurate insights for analysis. |
Additional Support
Warehouse
The Warehouse tab displays the warehouse performance data. To view data specific to a time period, you must apply Global Calendar filter. Apart form Global Calendar, you can also apply filters in the Filters section to view data specific to Warehouses and Databases.
This tab has multiple pie charts. The pie charts also allow you to filter data for specific Warehouses. If you have selected all the Warehouses in the Filters section, then you can select individual Warehouses in pie chart filters. However, if you have selected specific Warehouses in the Filters section itself, the data in all the pie charts is displayed only for the selected Warehouses and you cannot apply pie chart filter in this case.
Credits Used
This pie chart displays the total number of Snowflake credits used by the Warehouses. Each section of the pie chart is represents a Warehouse. When you hover on a section of the pie chart, you can see the number of credits consumed by that Warehouse.
Warehouse Load
This bar graph represents the percentage of load on each Warehouse. The three category of load are Suspended, Less Load, and High Load. The x axis displays the Warehouse names (based on the filters applied in the filter section) and the y axis displays the percentage of load. Each bar represents a Warehouse. Each bar is divided into different types of load (Suspended, Less Load, and High Load). When you hover over a bar, you can see the different types of loads on that Warehouse.
Top 10 Queries with Spillage
This table displays all the details of 10 queries which have spilled the largest amount of data. The list of queries depend on the filters applied in the Global Calendar.