Stock Monitors
Monitors Store contains a set of predefined monitors that are shipped along with ADOC. These monitors are created on critical metrics which are highly important and need to be monitored. Since the monitors are pre-defined by ADOC, you need not create them again. You can just import them from this page. The imported monitors appear on the Monitors and Alerts page. If you delete an imported monitor, the deleted monitor is moved back to the Monitor store page.
To navigate to the Monitor Store, perform the following:
- From the left pane, click Compute and select Monitors.
- Click the Monitors Store button. The Stock Monitors page is displayed.
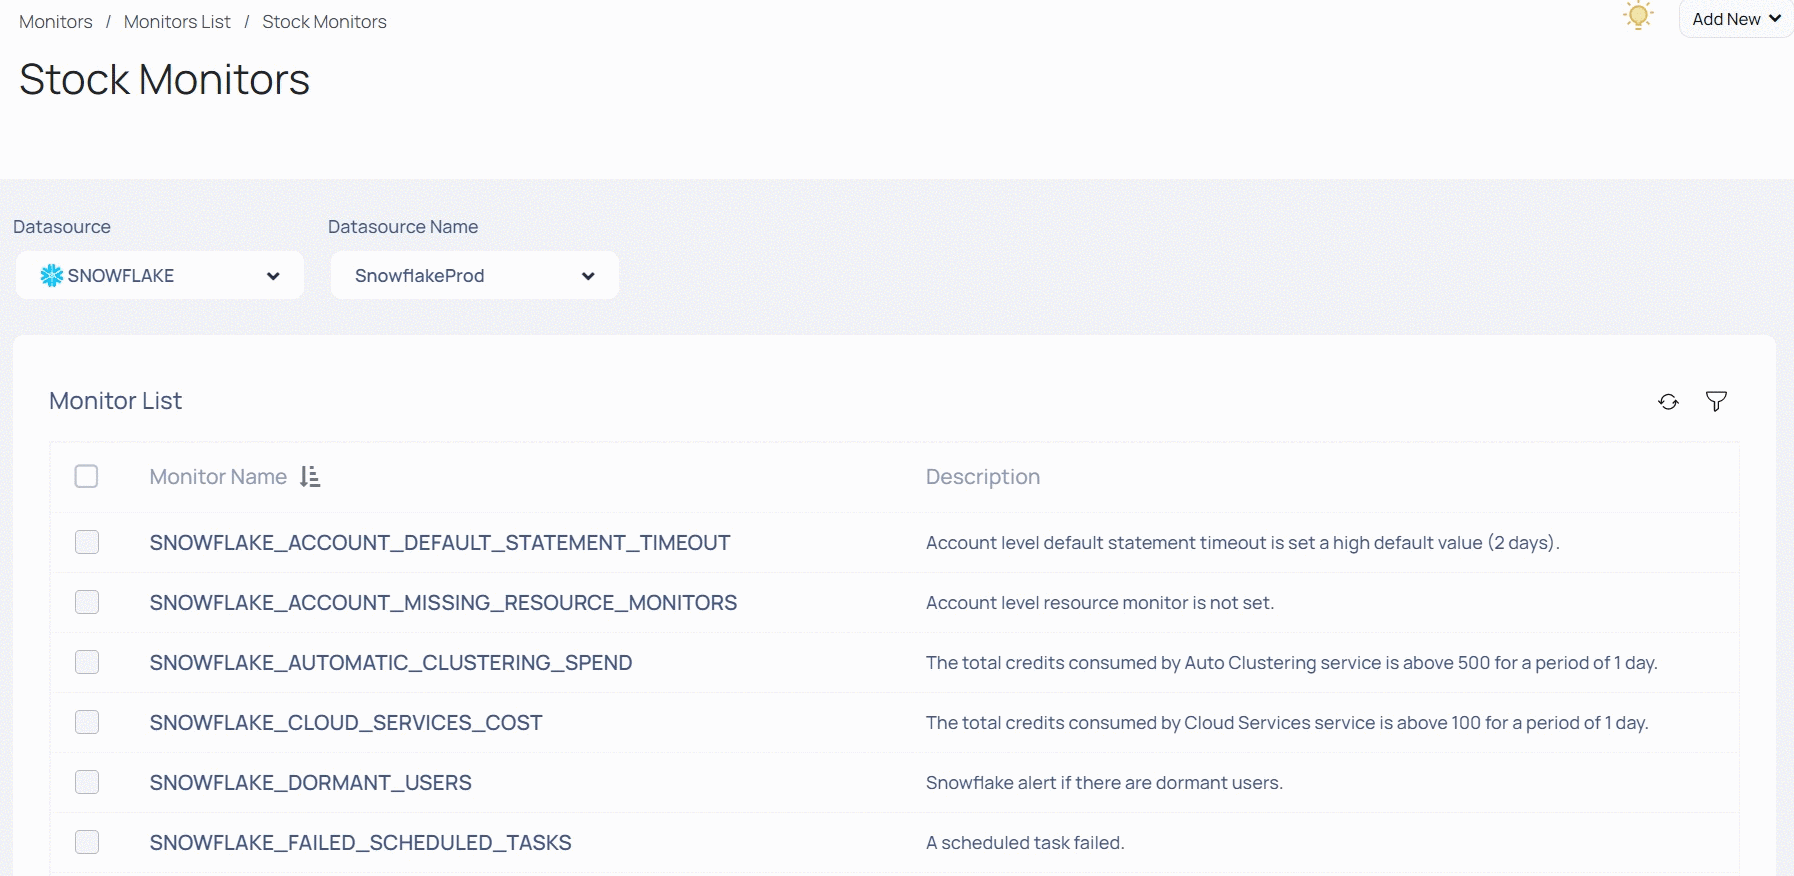
To import a monitor from the Monitors Store, perform the following:
- Select the type of datasource from the Datasource field.
- Select the name of the datasource from the Datasource Name field. Stock monitors for the selected datasource are displayed.
- Select the monitors to import by clicking the check box for the monitor.
- Click Import Stock Monitor. The monitor is imported to the Monitors List page and you are redirected to the Monitors list page.
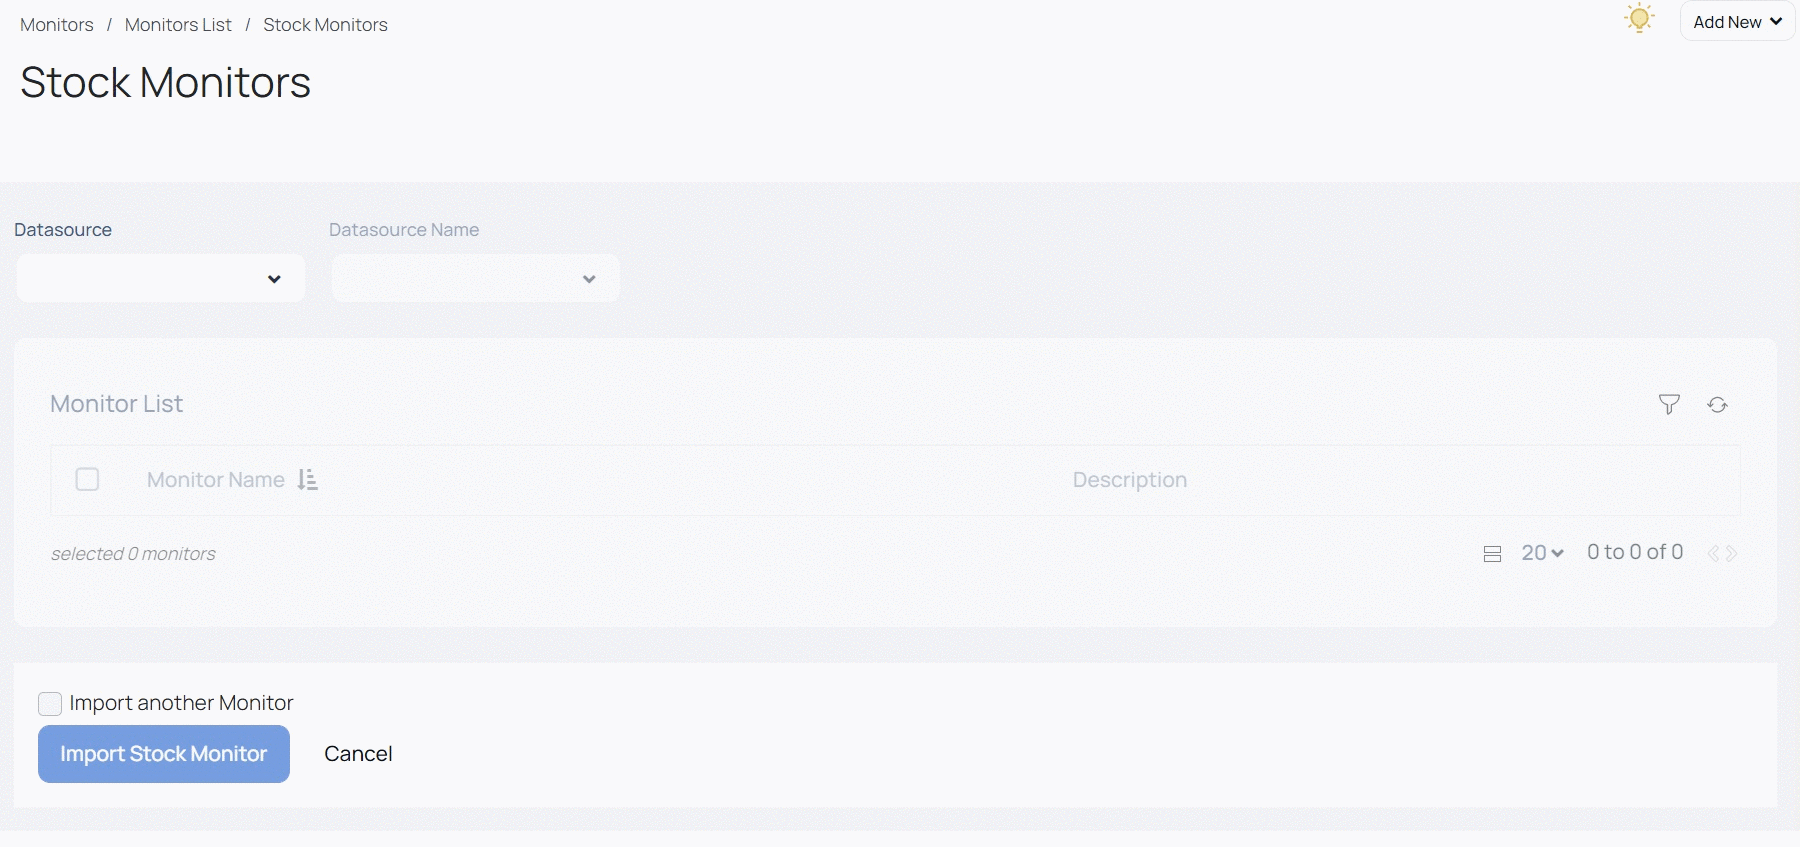
To import multiple monitors from various datasources, select the Import another Monitor check box before you click the Import Stock Monitor button. When you select the Import another Monitor check box before you click the Import Stock Monitor, you are not redirected to the monitors page. You are on the Monitors Store page and you can select another data source from which you want to import the Stock monitors.

Data Source Monitors
The list of stock monitors for the following data sources are present below:
Snowflake
| Display Name | Description | Parameters | Severity (User Editable) |
|---|---|---|---|
| Account Statement Timeout | The alert is raised when the account statement timeout is either set to null or defaulted to 178,000 seconds (2 days). | Default Statement Timeout (in Sec): Set the default statement timeout parameter in seconds. Execute query in every (in Days): Set the query execution frequency in any preferred unit, such as Days, Hours, Minutes, or Seconds. | |
| Account Resource Monitor | The Account Resource Monitor alert monitors the account to ensure that the resource monitor is configured. It raises an alert if the resource monitor is not properly set up for the account. | NA | |
| Deprecated Driver Usage | Monitor if the connectors are not using the latest drivers to query data. | NA | |
| Automatic Clustering Spend | Monitor the clustering cost for the tables, ensuring it does not exceed the default threshold of 5 credits per day. | NA | |
| Cloud Service Cost | Monitor the cloud service cost for the warehouse and alert if it exceeds the default threshold of 10%. | NA | |
| Contract Overage | Monitor the contract credit consumption and raise an alert when it reaches the default threshold of 80%. | NA | |
| Cost Alert | Monitor the weekly spend and trigger an alert if it exceeds the default threshold of 20%. | Time In Days: Set the comparison period's length in days. For example - 7 days | |
| Dormant Users | Monitor user activity and identify users who have not used the application for a period exceeding the default threshold of 30 days. | NA | |
| Failed Scheduled Tasks | Monitor and detect any failed scheduled tasks within the account. | Task Data: Set a numerical parameter to determine the look back time for the failed tasks. For example- 60. Execute query in every: Set the query frequency in Seconds, Mins, Hours, or Days. | |
| Long Running Queries | Monitor queries that exceed the predefined threshold of 30 minutes in duration. | Query Timeout (In Min): In minutes, specify the query timeout period. Example -30 mins Specify Warehouses to Exclude: Specify the warehouses that should be set aside. Example - WH1, WH4. Execute query in every: Set the query frequency in Seconds, Mins, Hours, or Days. | |
| Materialize View Cost | Monitor materialized views that exceed a daily spending threshold of 5 credits. | NA | |
| Snowpipe Cost | Monitor snowpipes that exceed a daily spending threshold of 10 credits. | NA | |
| Queries External File Listing Time | Monitor queries that exceed the default threshold of 30 seconds while listing external files. | External Files Time Parameter(in Milliseconds): Set the threshold limit time for listing external files in milliseconds. Example: For 30 sec set the time to 30000 milliseconds. Time In Minutes: Set the time for alert in minutes. Execute query in every: Set the query frequency in Seconds, Mins, Hours, or Days. | |
| Queries Queued | Monitor queries that remain queued in the warehouse for more than the default threshold of 5 seconds within a one-hour timeframe. | Queue Time(in Seconds): Set the time in seconds after which the alert will be activated. Queue Data(in Minutes): Set the time for which the data will be held in the queue. Specify Warehouses to Exclude: Specify the warehouses that must be excluded. Example - WH1, WH4. Execute query in every: Set the query frequency in Seconds, Mins, Hours, or Days. | |
| New Account Role | Monitor the new roles created in the account. | NA | |
| User Updates | Monitor the account if a sensitive update(ex. role grant, password reset, etc) is made to the user. | NA | |
| User Login Failure | Monitor the account for failed login attempts exceeding the default threshold of 3 times. | NA | |
| Unused Tables | Monitor the tables that are not used for a long time defaulted to 90 days. | Table Unused For(in Days): Set the number of days after which the alert will be generated. Execute query in every: Set the query frequency in Seconds, Mins, Hours, or Days. | |
| User Created | Monitor the account for any new user additions. | NA | |
| Users Multi Factor Auth Not Enabled | Monitor the account to raise an alert if the users have not enabled MFA. | NA | |
| Warehouse Activity Monitor | Monitor for events triggered on the warehouse such as resizing of a warehouse, add a new warehouse or drop a warehouse. |
| |
| Warehouse Auto Suspend Time | Raise an alert for the warehouse where the auto-suspend timeout is not set or exceeds 5 minutes. | Auto Suspend Time (In Sec): Set the number of seconds that the timer will run for. Execute query in every: Set the query frequency in Seconds, Mins, Hours, or Days. | |
| Warehouse Missing Resource Monitor | Monitor the warehouses with missing resource monitors. | NA | |
| Warehouse Statement Timeout | Monitor the warehouses with default statement timeout set to 2 days. | Default Statement Timeout (In Sec): Set the default statement timeout parameter in seconds. Execute query in every: Set the query frequency in Seconds, Mins, Hours, or Days. | |
| Detect High Churn Tables | This monitor identifies tables in Snowflake storage that experience a high frequency of data changes or updates, indicating a significant level of churn. | NA | |
| Detect Auto Clustering for High Churn Tables | This monitor identifies tables that have auto clustering enabled and experience a high churn rate. | NA | |
| Snowflake Usages | This will monitor Snowflake Usages against provided threshold. | Time in Days: Set the comparison period's length in days. For example - 7 days | |
| Snowflake Old Tables | This monitor detects tables created within a specified number of days. By default, it flags tables created in the last 30 days, with the option to modify this timeframe in the Edit Monitor page. | Specify Database.schemaName(s): Enter a comma-separated list of Table Creation Back Days: Defines the number of days to look back for table creation. The default value is 30 days, but this can be adjusted as needed. Execution Frequency: Determines how often the monitor runs. Use the dropdown to select the desired frequency interval (e.g., days, hours, minutes, or seconds). |
Databricks
| Display Name | Description | Parameters | Severity |
|---|---|---|---|
| Global Init Script Disable | Monitor to alert when global init script is disabled. | NA | |
| Total Clusters Running | Monitor the account if the number of clusters running is more than the threshold defaulted to 50 clusters | NA | |
| Application CPU Time | Monitor the health of the applications if the CPU time is more than the threshold defaulted to 1 hour | NA | |
| Application File Write Bytes | Monitor the application writing to file system more than the threshold defaulted to 1MB | NA | |
| Application JVM Garbage Collection Time | Monitor the health of the applications if the JVM Garbage Collection time is more than the CPU time defined in the threshold defaulted to 10% | NA | |
| Application Shuffle Write | Monitor the health of the application if the shuffle write is more than the threshold defaulted to 1MB | NA | |
| Application Local Shuffle Read | Monitor the health of the application if the shuffle read is more than the threshold defaulted to 1MB | NA | |
| Application Remote Shuffle Read | Monitor the health of the application if the shuffle read from the remote file location is more than the threshold defaulted to 1MB | NA | |
| Application Driver High CPU Usage | Monitor the Application which uses CPU more than the threshold defaulted to 70% | NA | |
| Application Executor CPU Wastage | Monitor the application running more than 5 mins with CPU usage less than the threshold defaulted to 10% | NA | |
| Application Executor File Read | Monitor the Application where file reads are high defaulted to 1GB | NA | |
| Application Executor Low CPU Usage | Monitor the Application where usage is less defaulted to 10% | NA | |
| Total Failed Cluster | Monitor the account if the number of clusters failed is more than the threshold in an hour defaulted to 2 clusters | NA | |
| High DBU Consuming Cluster | Monitor the application with high DBU consumption in an hour defaulted to 25 DBUs |
| |
| Long Running Clusters | Monitor the cluster which runs more than threshold defaulted to 60 Minutes |
| |
| Application Executor Memory Usage | Monitor if the average memory usage by executor is more than the threshold defaulted to 50% | NA | |
| Total Submitted Clusters | Monitor the account if total submitted clusters is more than the threshold defaulted to 10 for in 1 hour | NA | |
| Application Driver Memory Usage | Monitor the application drivers with high memory usage defaulted to 50% | NA | |
| Total All Purpose Cluster | Monitor the account if total all purpose clusters exceeds the threshold defaulted to 50 in an hour | NA | |
| New Expensive Query | Monitor the new queries running longer than threshold time defaulted to 120 seconds. |
| |
| Repeated Expensive Queries | Monitor the repeated queries running longer than threshold time defaulted to 120 seconds. |
| |
| New Heavy Scan Query | Monitor the new queries if bytes scanned is greater than threshold defaulted to 10KB. |
| |
| Repeated Heavy Scan Queries | Monitor the repeated queries if bytes scanned is greater than threshold defaulted to 10KB. |
| |
| Query History | This entity contains the history of all Databricks queries executed on your Databricks workspace. | ||
| Frequent Cluster Termination | Alert if clusters are terminated frequently due to spark error, default look back time is 15 minutes. |
| |
| High Cluster Cost | Monitor to check running clusters cost. |
| |
| Databricks Workspace Cost | This will monitor Databricks Workspace cost against provided threshold. |
| |
| Running Heavy Scan Query | Monitor the running queries if bytes scanned is greater than threshold defaulted to 1GB. |
| |
| Running Expensive Query | This monitor raises an alert when a running queries duration is longer than the provided duration. |
| |
| Running Queries Cost | This monitor raises an alert when the queries cost is more than the provided cost. |
| |
| Running Clusters after Work Hours | Monitor the clusters which are running after work hours, defaulted to Before 10 AM and Post 5 PM IST. |
|
Azure Data Factory
| Monitor Name | Description | Parameters |
|---|---|---|
| Failed Activity | Monitor the activities for failure with specific look back defaulted to one hour. |
|
| Factory Cost | Monitor the factory cost with specific look back time defaulted to one day. |
|
| Pipeline Cost | Monitor the cost of specified pipeline with specific look back time defaulted to one hour. |
|
Snowflake Stock Monitors with Recommendations
Three Snowflake stock monitors have built in recommendations provided by ADOC. You can choose to enable or disable the recommendation. When you enable the recommendation, you set the auto trigger option. The auto trigger option automatically performs the required action when the monitor reaches its threshold level and there is no requirement to create an alert. Hence ADOC allows you to disable alert creation for these three Stock alerts which have a recommendation that auto triggers the action. If you disable alert creation, and if the monitor exceeds its defined thresholds, you can see the alert as a recommendation on the Snowflake Warehouse page.
The three Monitors which have recommendation are:
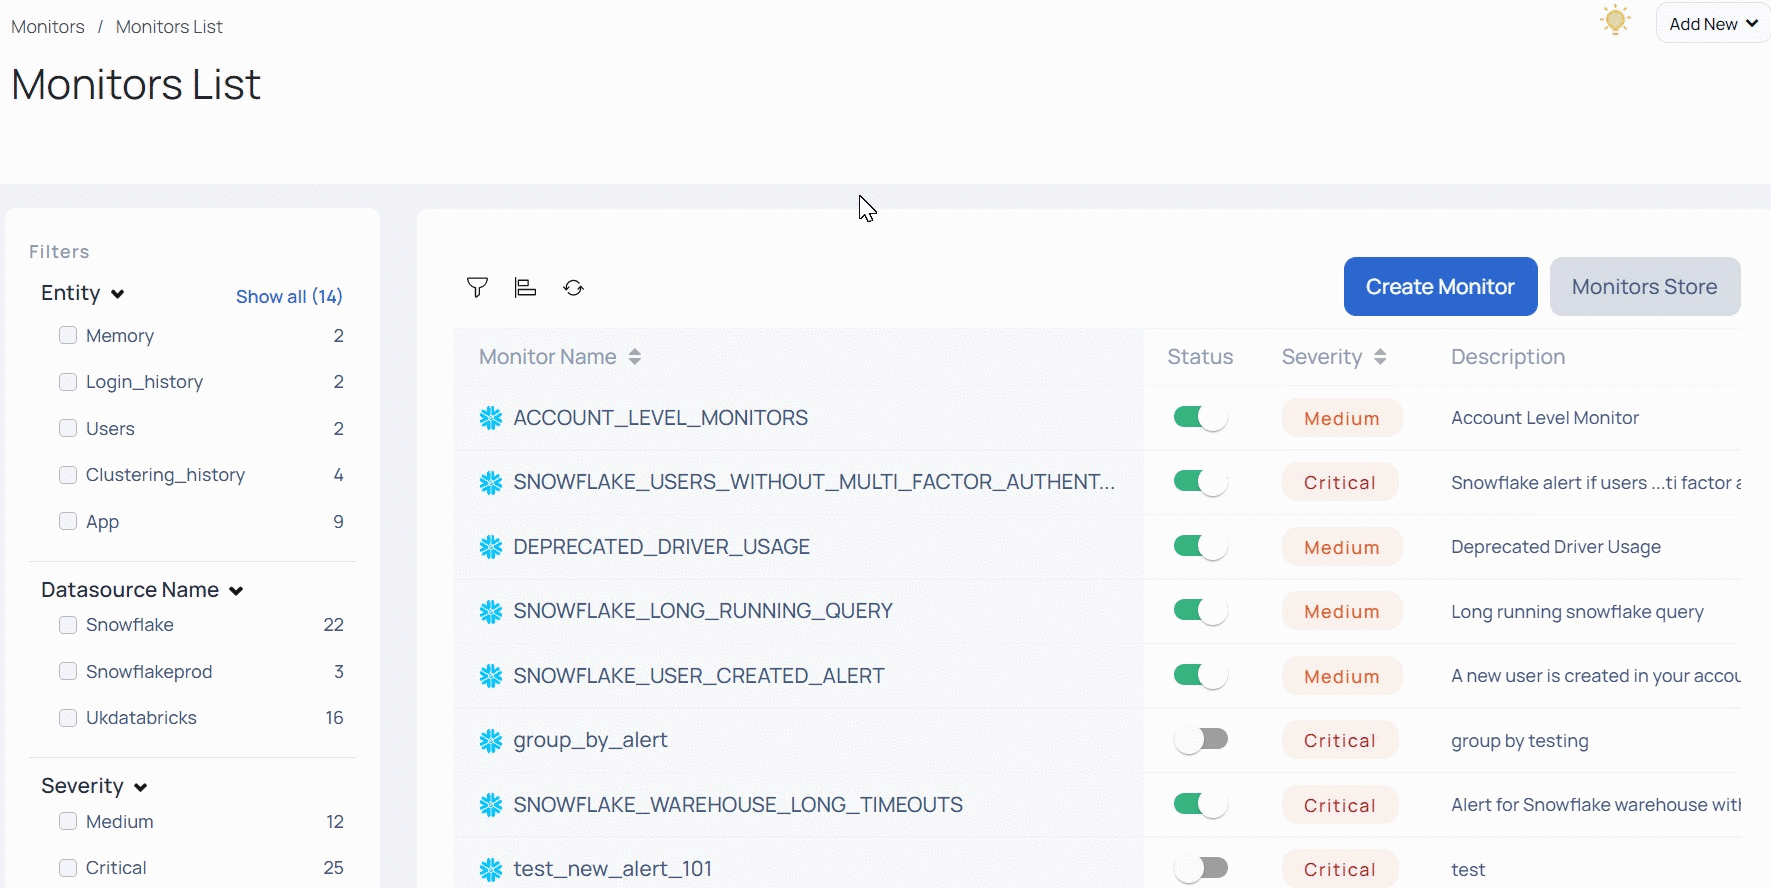
- ACCOUNT_LEVEL_MONITORS: This monitor recommends you handle account level settings.
- DEPRECATED_DRIVER _USAGE: This monitor recommends you to navigate to Snowflake and update the drivers.
- SNOWFLAKE_LONG_RUNNING_QUERY: This monitor allows you to abort the long running query from within ADOC.
To execute the Abort Query operation, you must provide the Operate privilege for the role assigned to ADOC (generally integration user), for each warehouse.
The syntax to provide the Operate privilege is as follows.
GRANT OPERATE ON WAREHOUSE <WH_NAME> TO ROLE <ROLE_NAME>;Features of Monitor Store
- Multiple Selection: You can select multiple monitors at once, or you can select all the monitors together.
- Sort Alerts: To sort the column values, click the icon
to sort in ascending , or descending order. - You can customize the number of alerts that appear on the screen.
- Filter Alerts: You can filter stock monitors by clicking
icon on the top right corner of the table. You can filter the stock monitors by their name.