Reporting
ADOC's reporting page provides a comprehensive single-page dashboard that allows you to dive down into your assets and obtain vital insights on the accuracy of your data. You can use this tool to evaluate an asset's data accuracy, consistency, and general quality.
To access the Reporting page, navigate to Data Reliability from the left navigation menu, and select Reporting under the Reports section. The Reports window is displayed.
On this page, you can view your existing reports. Use the Type filter to display reports based on the selected type, such as Data Reliability Reports, or use the Search bar to find a report by its name.
How to Create a New Report?
To create a new report, click the New Report button on the top right. This redirects you to the Reliability Explorer page.
This page allows you to visualize and assess the reliability of various data assets through customizable widgets movement.
Each widget on the Reliability Explorer page is independent, allowing you to rearrange or remove them to suit your preferences. Widgets provide detailed metrics on asset reliability, such as reliability scores, policy executions, and performance trends.
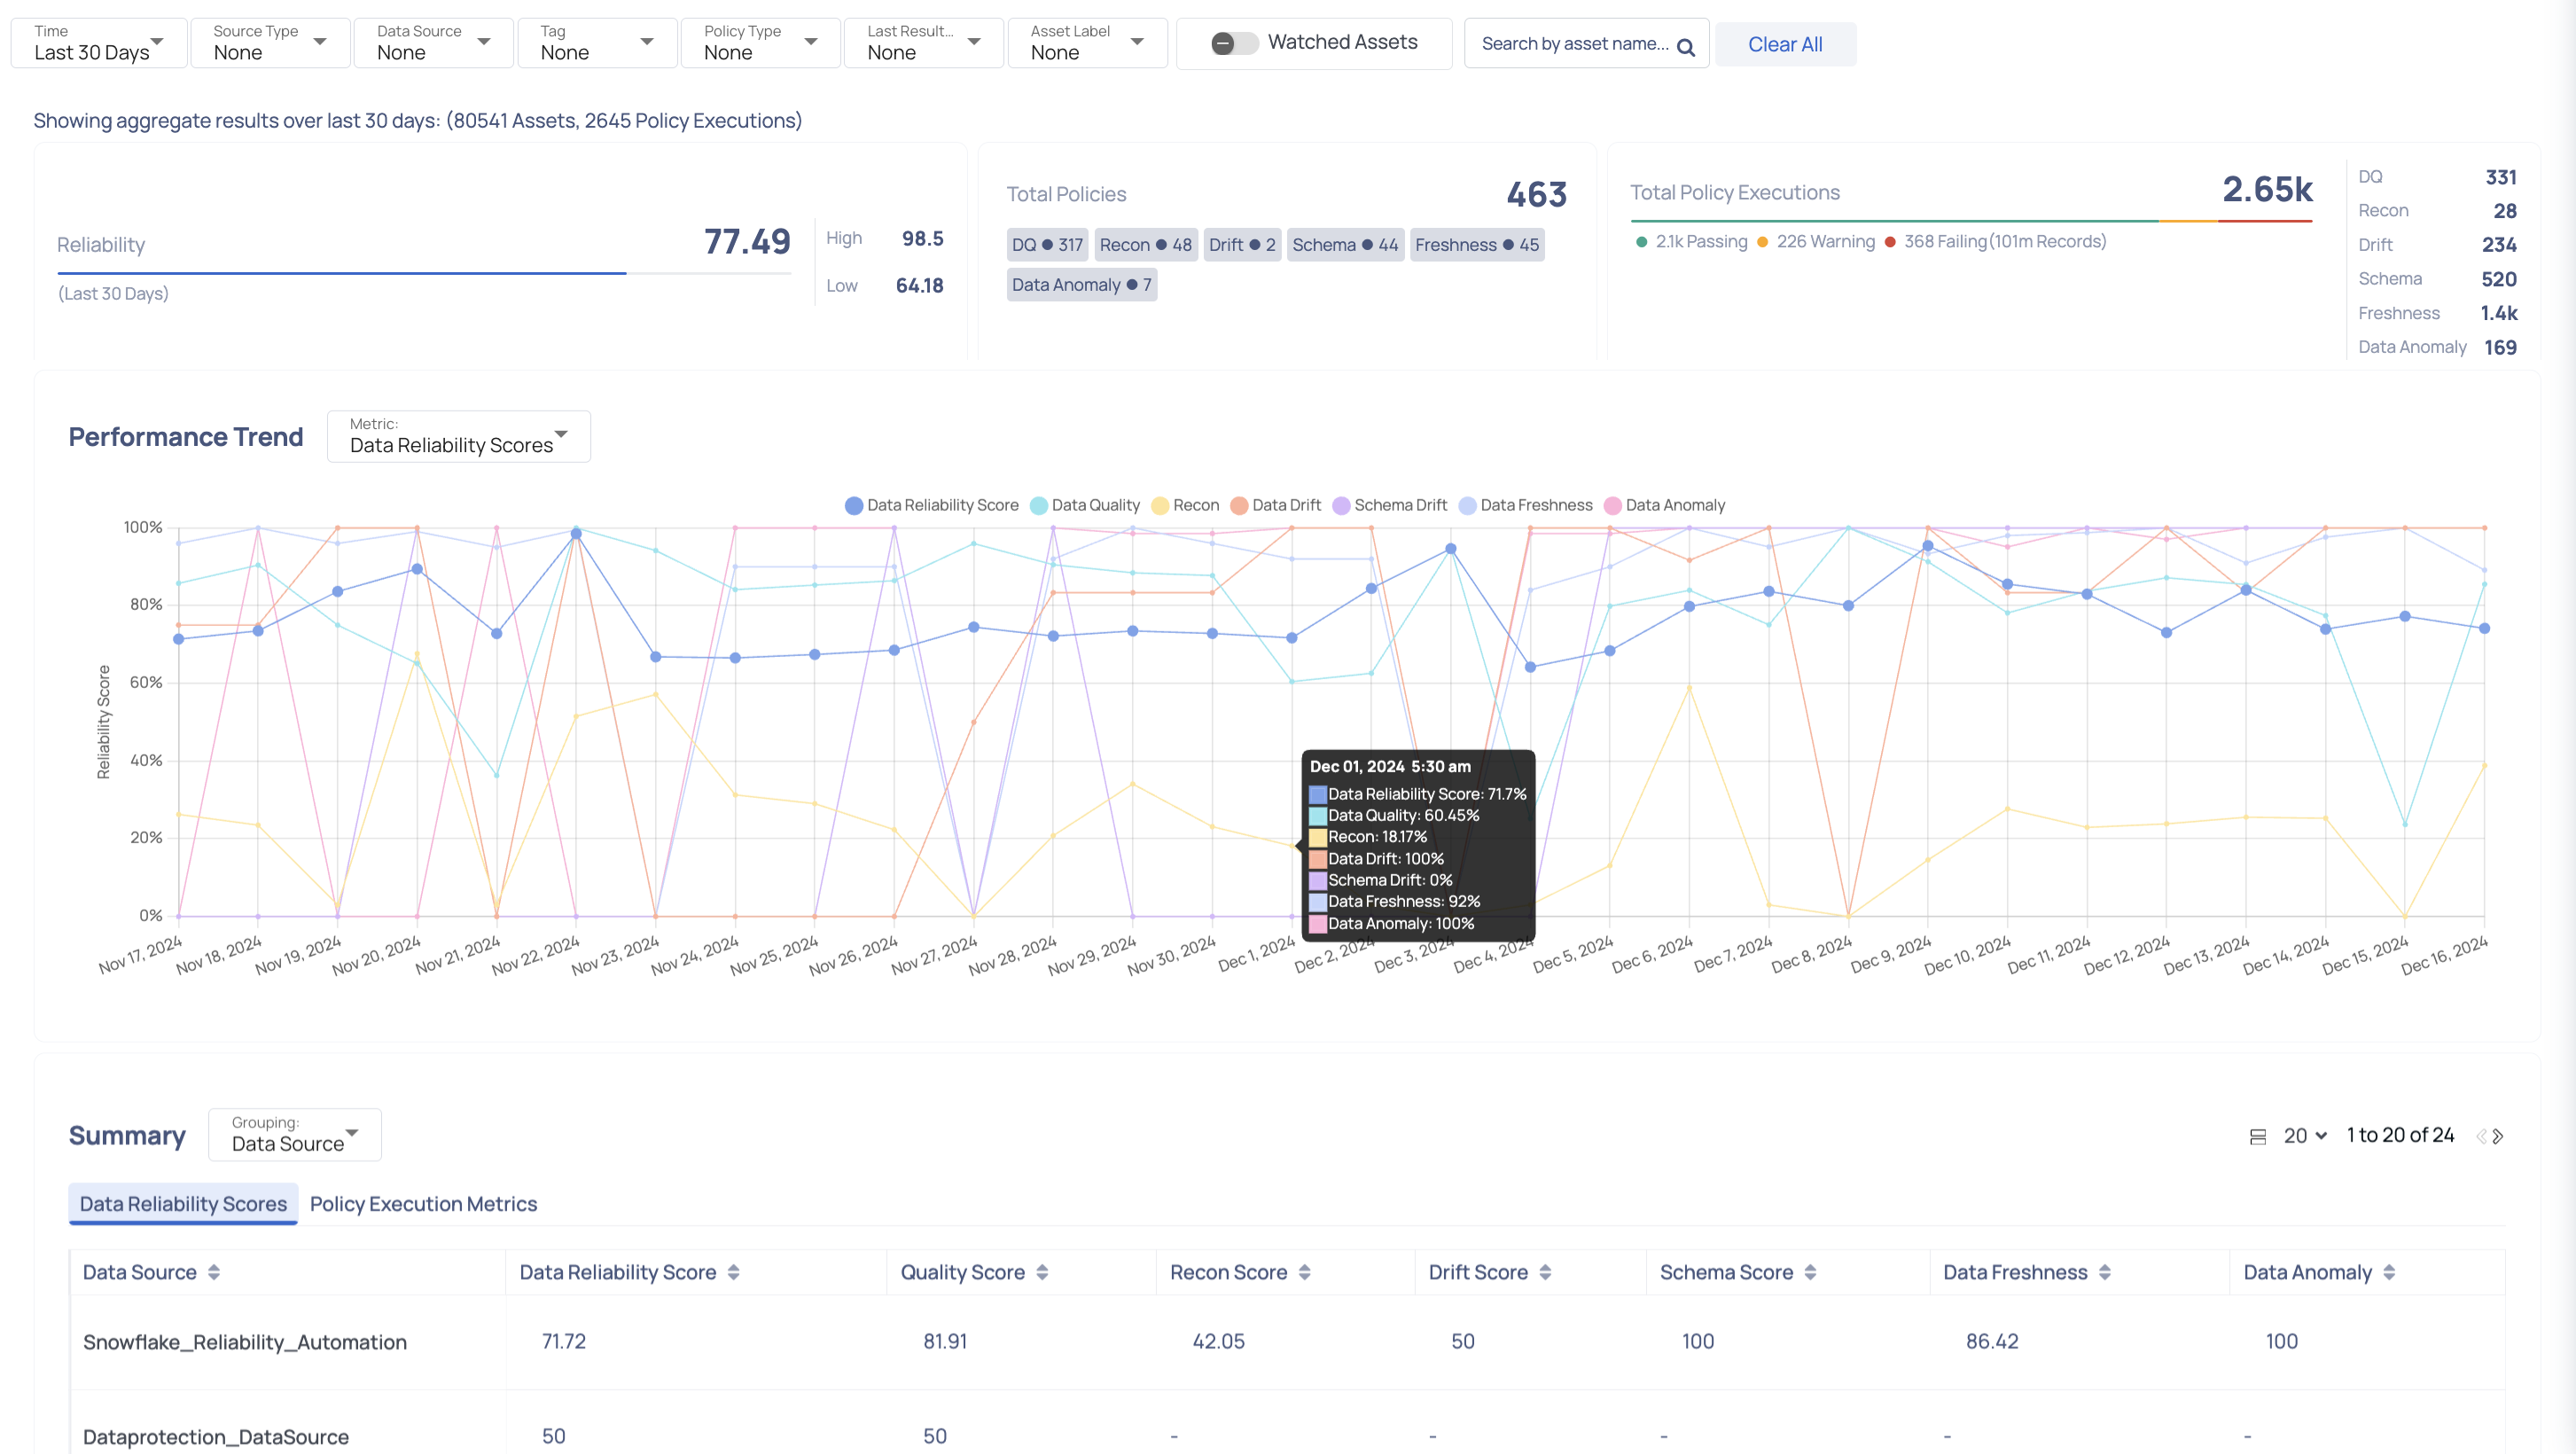
To tailor the displayed data to your needs, you can apply various filters to adjust the view, including time range, data source type, specific data sources, tags, policy types, and the status of the last recorded result.
| Filter | Description |
|---|---|
| Time | A specific time range for the data. |
| Source Type | The type of data source being analyzed. For example, you can filter by sources such as Snowflake for data warehousing or Kafka for real-time data streaming. |
| Data Source | Name of the data source. |
| Tag | The tag associated with the asset. |
| Policy Type | Type of profiling. Example: Data Quality, Reconciliation, etc. |
| Last Result Status | The status of the last recorded result. |
| Asset Label | Label assigned to the asset. |
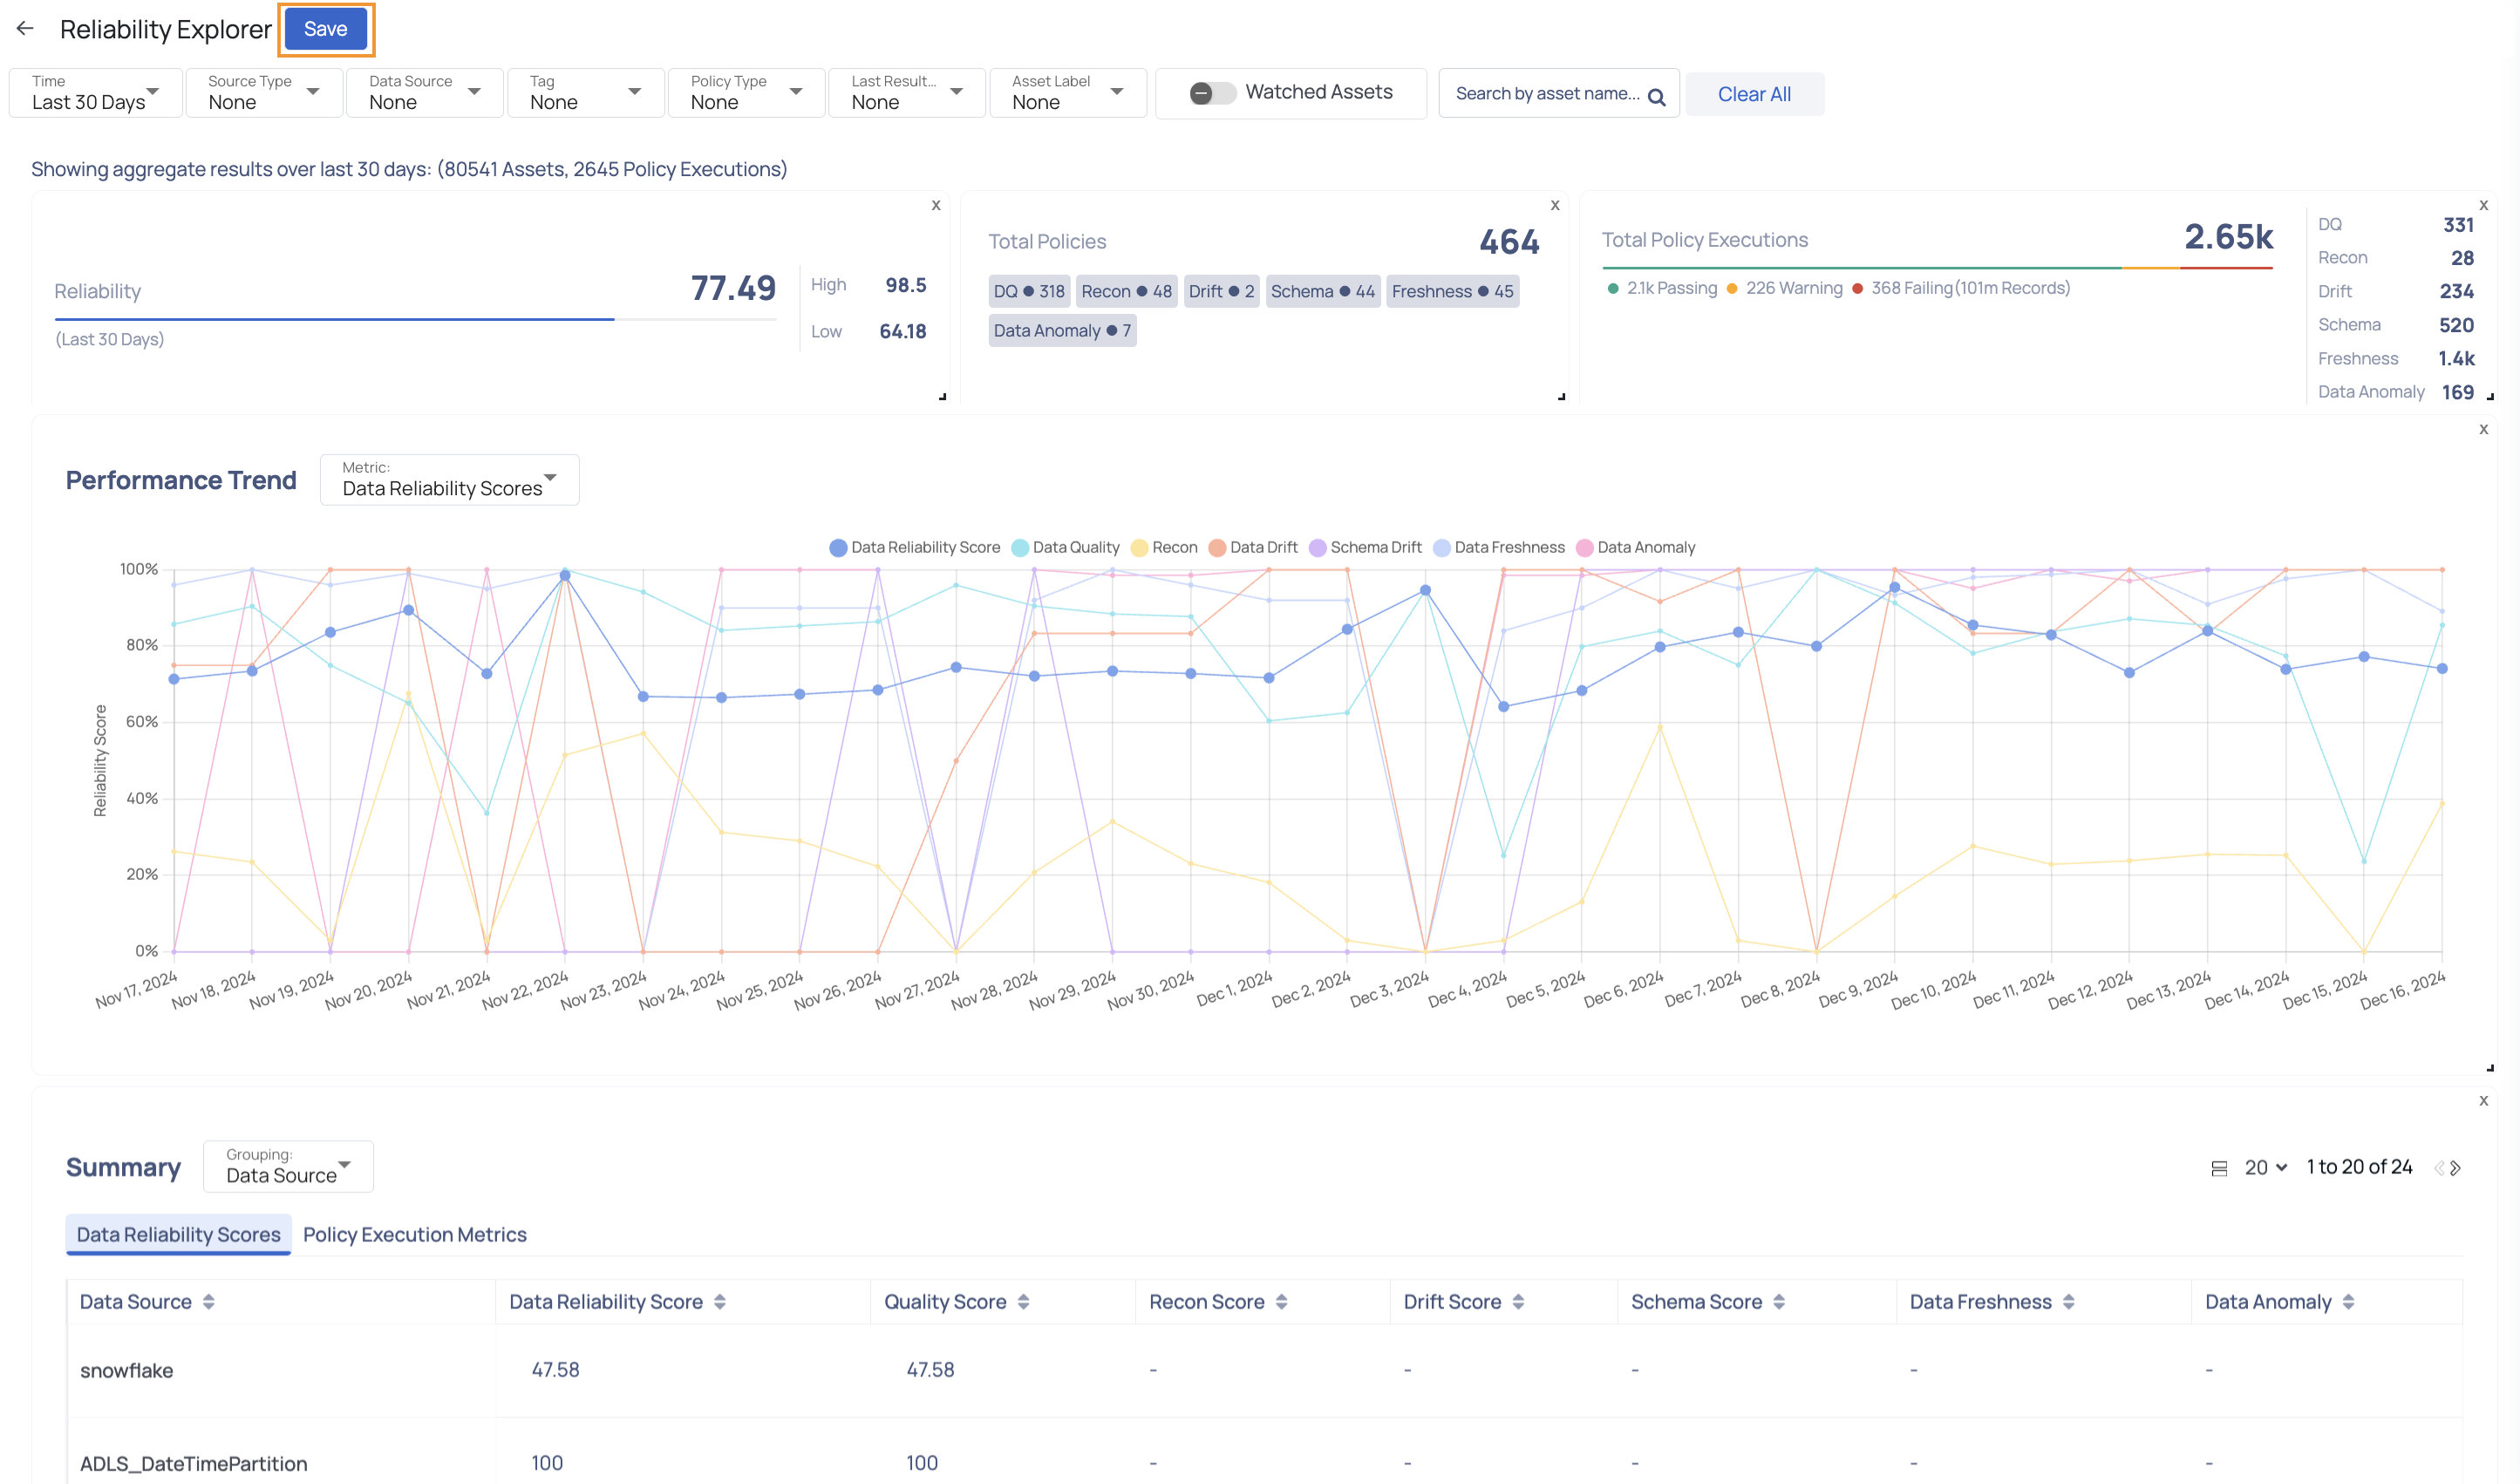
Enabling the Watched Assets toggle displays assets that are under watch. You can find specific assets by entering their names in the Search bar. You can utilize the Clear All button to remove all previously applied filters.
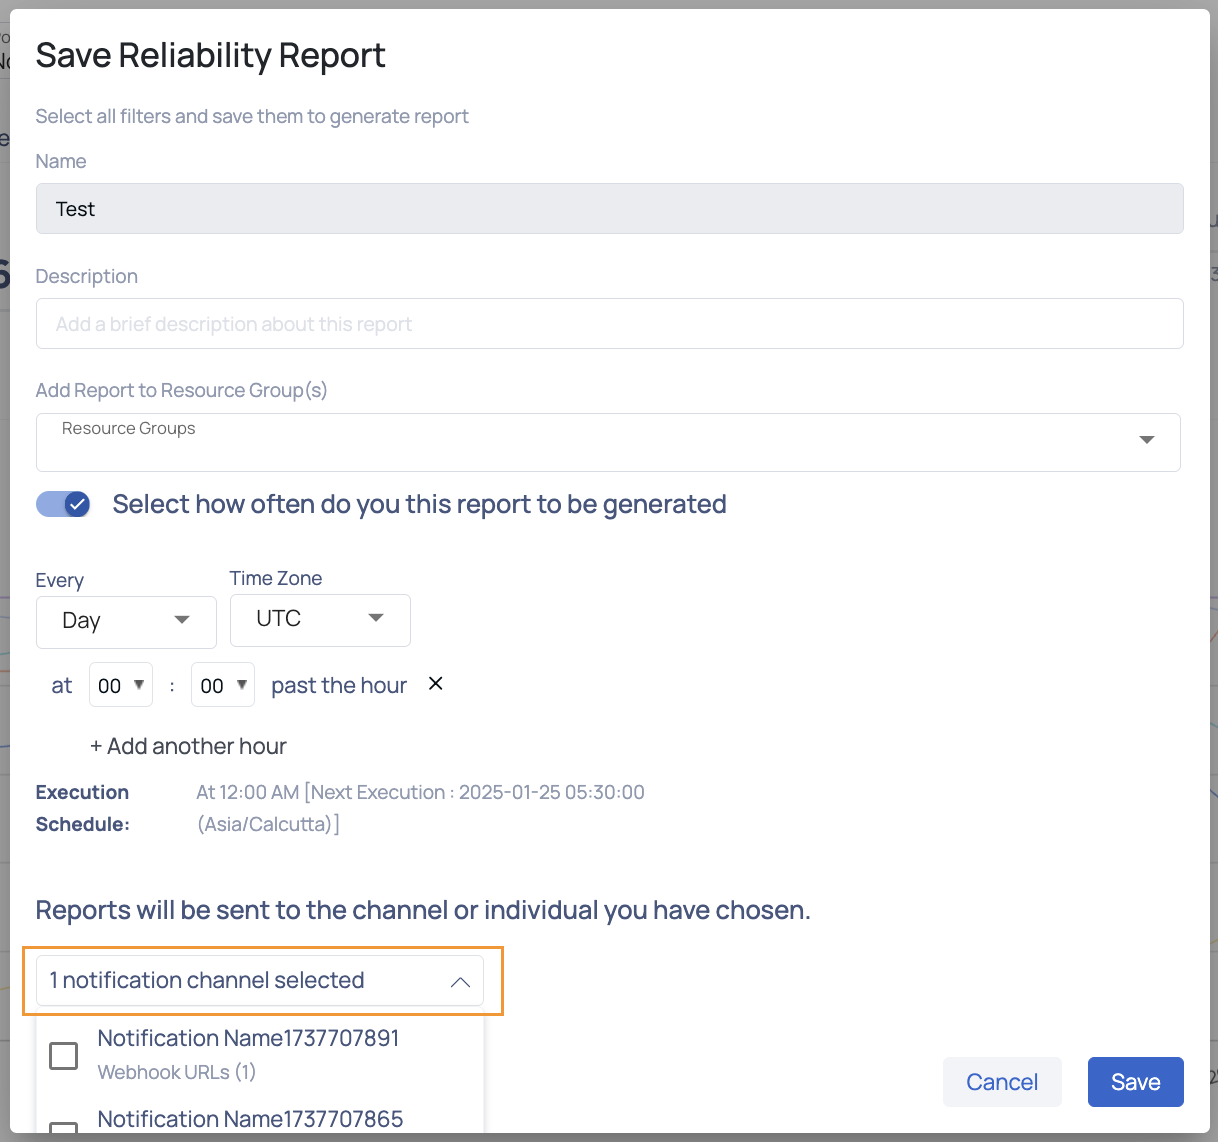
After adjusting the widgets and applying the necessary filters for a specific report, click the Save button to save the report. Reports can also be scheduled on this page. Clicking the Save button opens a dialog box where you need to enter specific information.
Any reports created in Reliability Explorer will be available to all users of your organization's Acceldata Data Observability Cloud application.
Steps to Save and Schedule a Report
To save and schedule a report, perform the following steps:
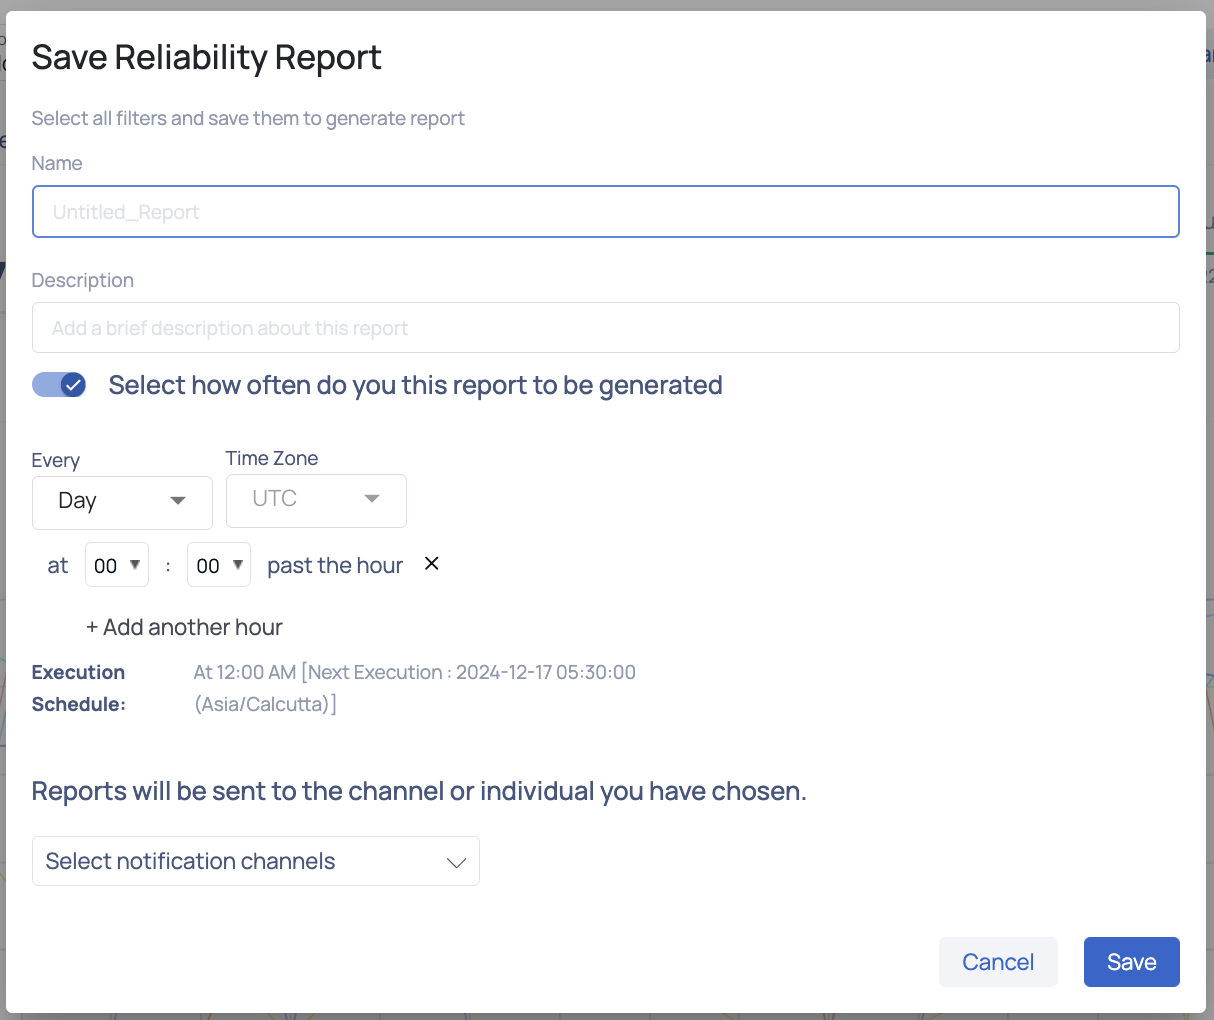
- Enter a name for the report.
- (Optional) Enter a description for the report.
- (Optional) Enable the Select how often you want this report to be generated toggle to schedule the report.
- Select the frequency from the Every dropdown menu.
- Select the time zone for the Time Zone dropdown menu.
- Select the specific time by selecting the minutes and hours from the respective dropdown menus.
- You can add another time to generate the report by clicking the + Add another hour button.
- Select the notification channel or individual to whom you want to send the report.
Currently, the report can only be sent via email.
- Click Save.
If you have scheduled the report and selected a notification channel during the save process, an email will be sent to the selected notification channel.
The View Report button will take you to the Reliability Explorer page of the generated report within the ADOC platform.
How do I edit notification channels for a report?
To edit the notification channel assigned to a report, follow these steps:
- Navigate to Reliability > Reports from the left-hand menu.
- On the Reports page, click the
vertical ellipsis icon next to the report you want to update and select Edit. The report window opens. - Click the Save drop-down and select Edit Schedule. The Save Reliability Report modal appears.
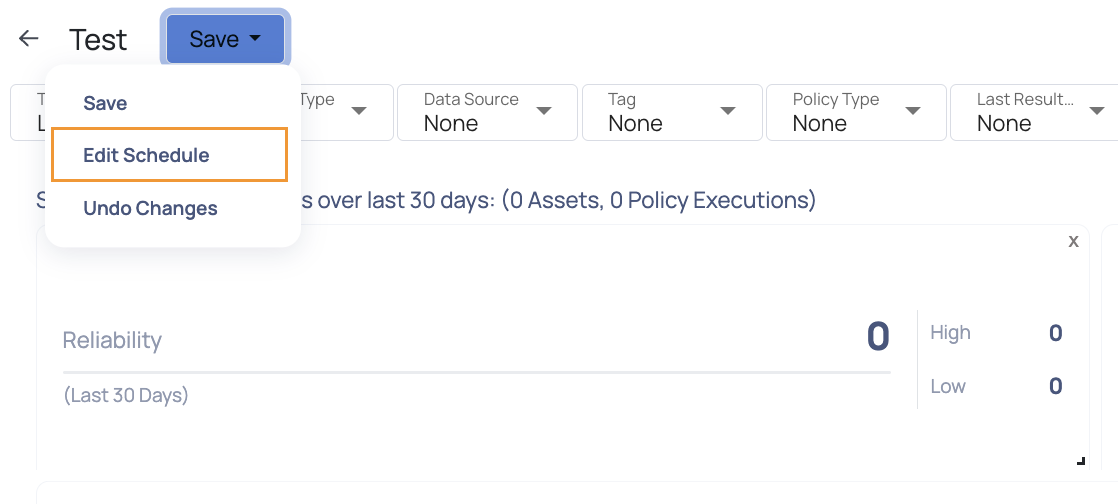
- Choose the new notification channel and click Save. The Data Reliability Report is successfully updated.
How do I view, clone, or delete a report?
To access your saved reports, you can navigate to the Reports page. All the reports are presented in a table format, providing details such as Name, Description, and Last Modified.
For each report, you have several actions available by clicking the
- View: Clicking on View will take you to the Reliability Explorer page corresponding to the selected report.
- Clone: Clicking on Clone, you can create a duplicate of the report. You can then make any necessary modifications on the Reliability Explorer page and save the changes.
- Delete: If you choose to Delete the report, it will be permanently removed from the Reports dashboard. A confirmation dialog box will appear, where you can proceed by clicking Ok or cancel by clicking Cancel.