Discover Assets
The Discover Assets page in ADOC is designed to help users efficiently explore, monitor, and manage data assets across their organization. It provides a centralized view of assets, along with critical insights such as policy mappings, data quality scores, and alert statuses. By using this page, you can streamline asset discovery and ensure proactive management of data quality.
This guide explains the functionalities available on the Discover Assets page, providing step-by-step instructions for a user-friendly and effective experience.
Key Interface Elements
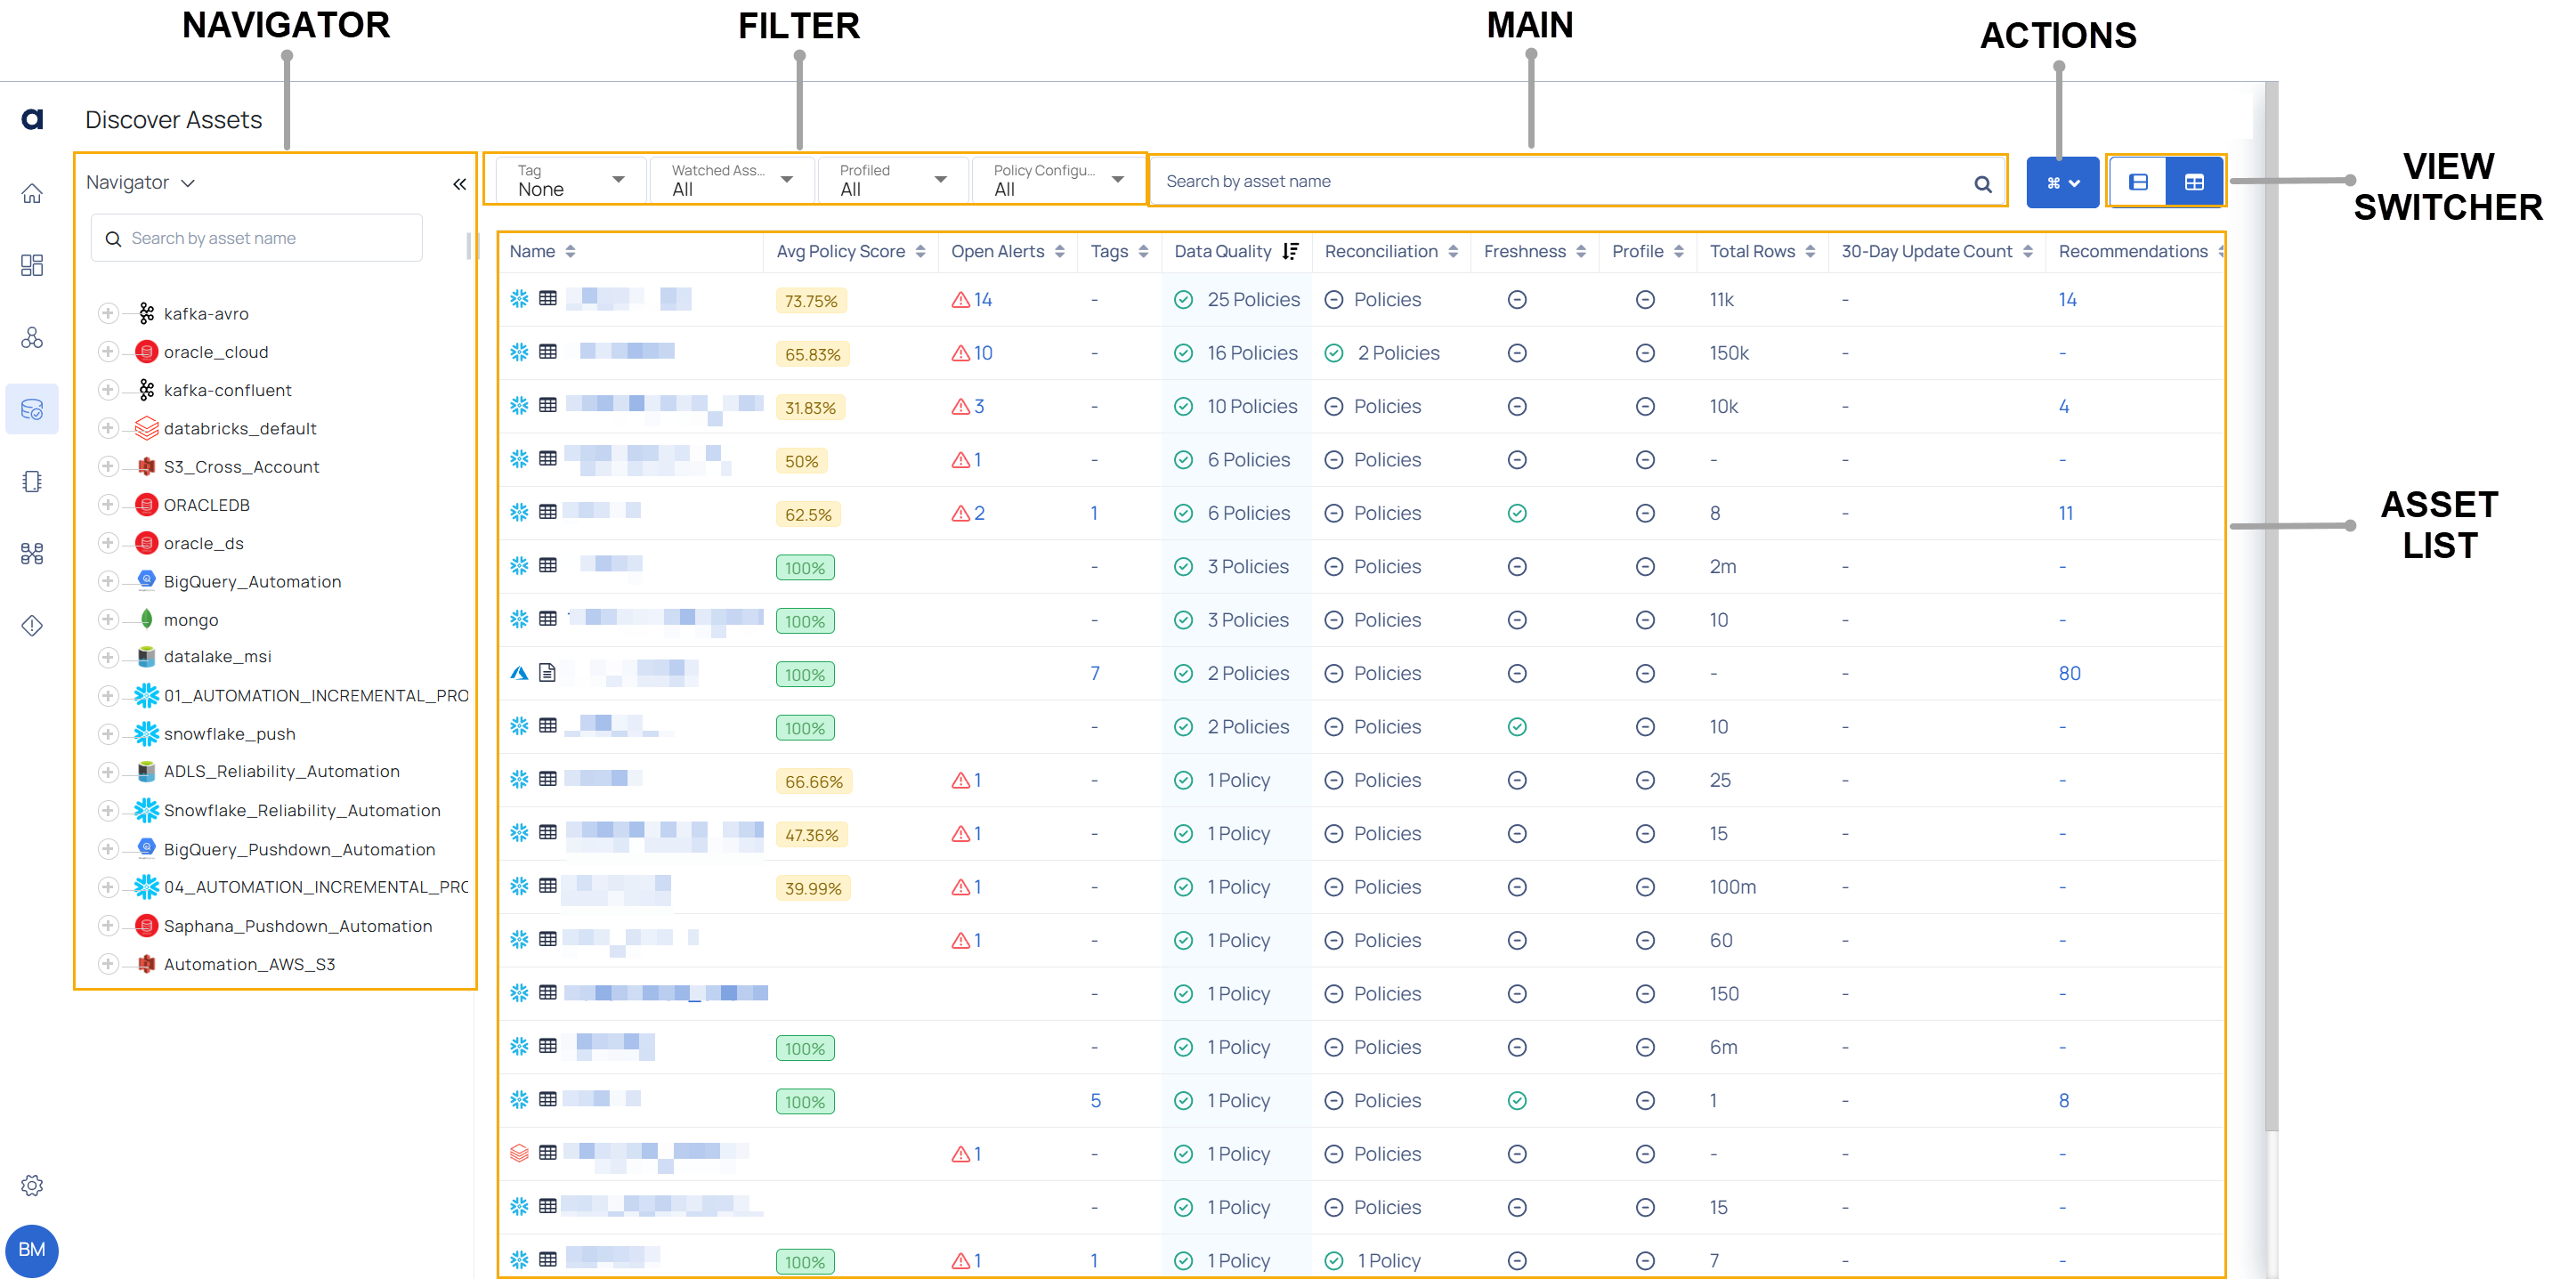
Navigator (Left Panel)
- Data Source List: Browse through connected data sources (e.g., databases, file systems, or streaming platforms).
- Expand/Collapse Controls: Click the + or - icons next to a data source to view or hide its associated assets.
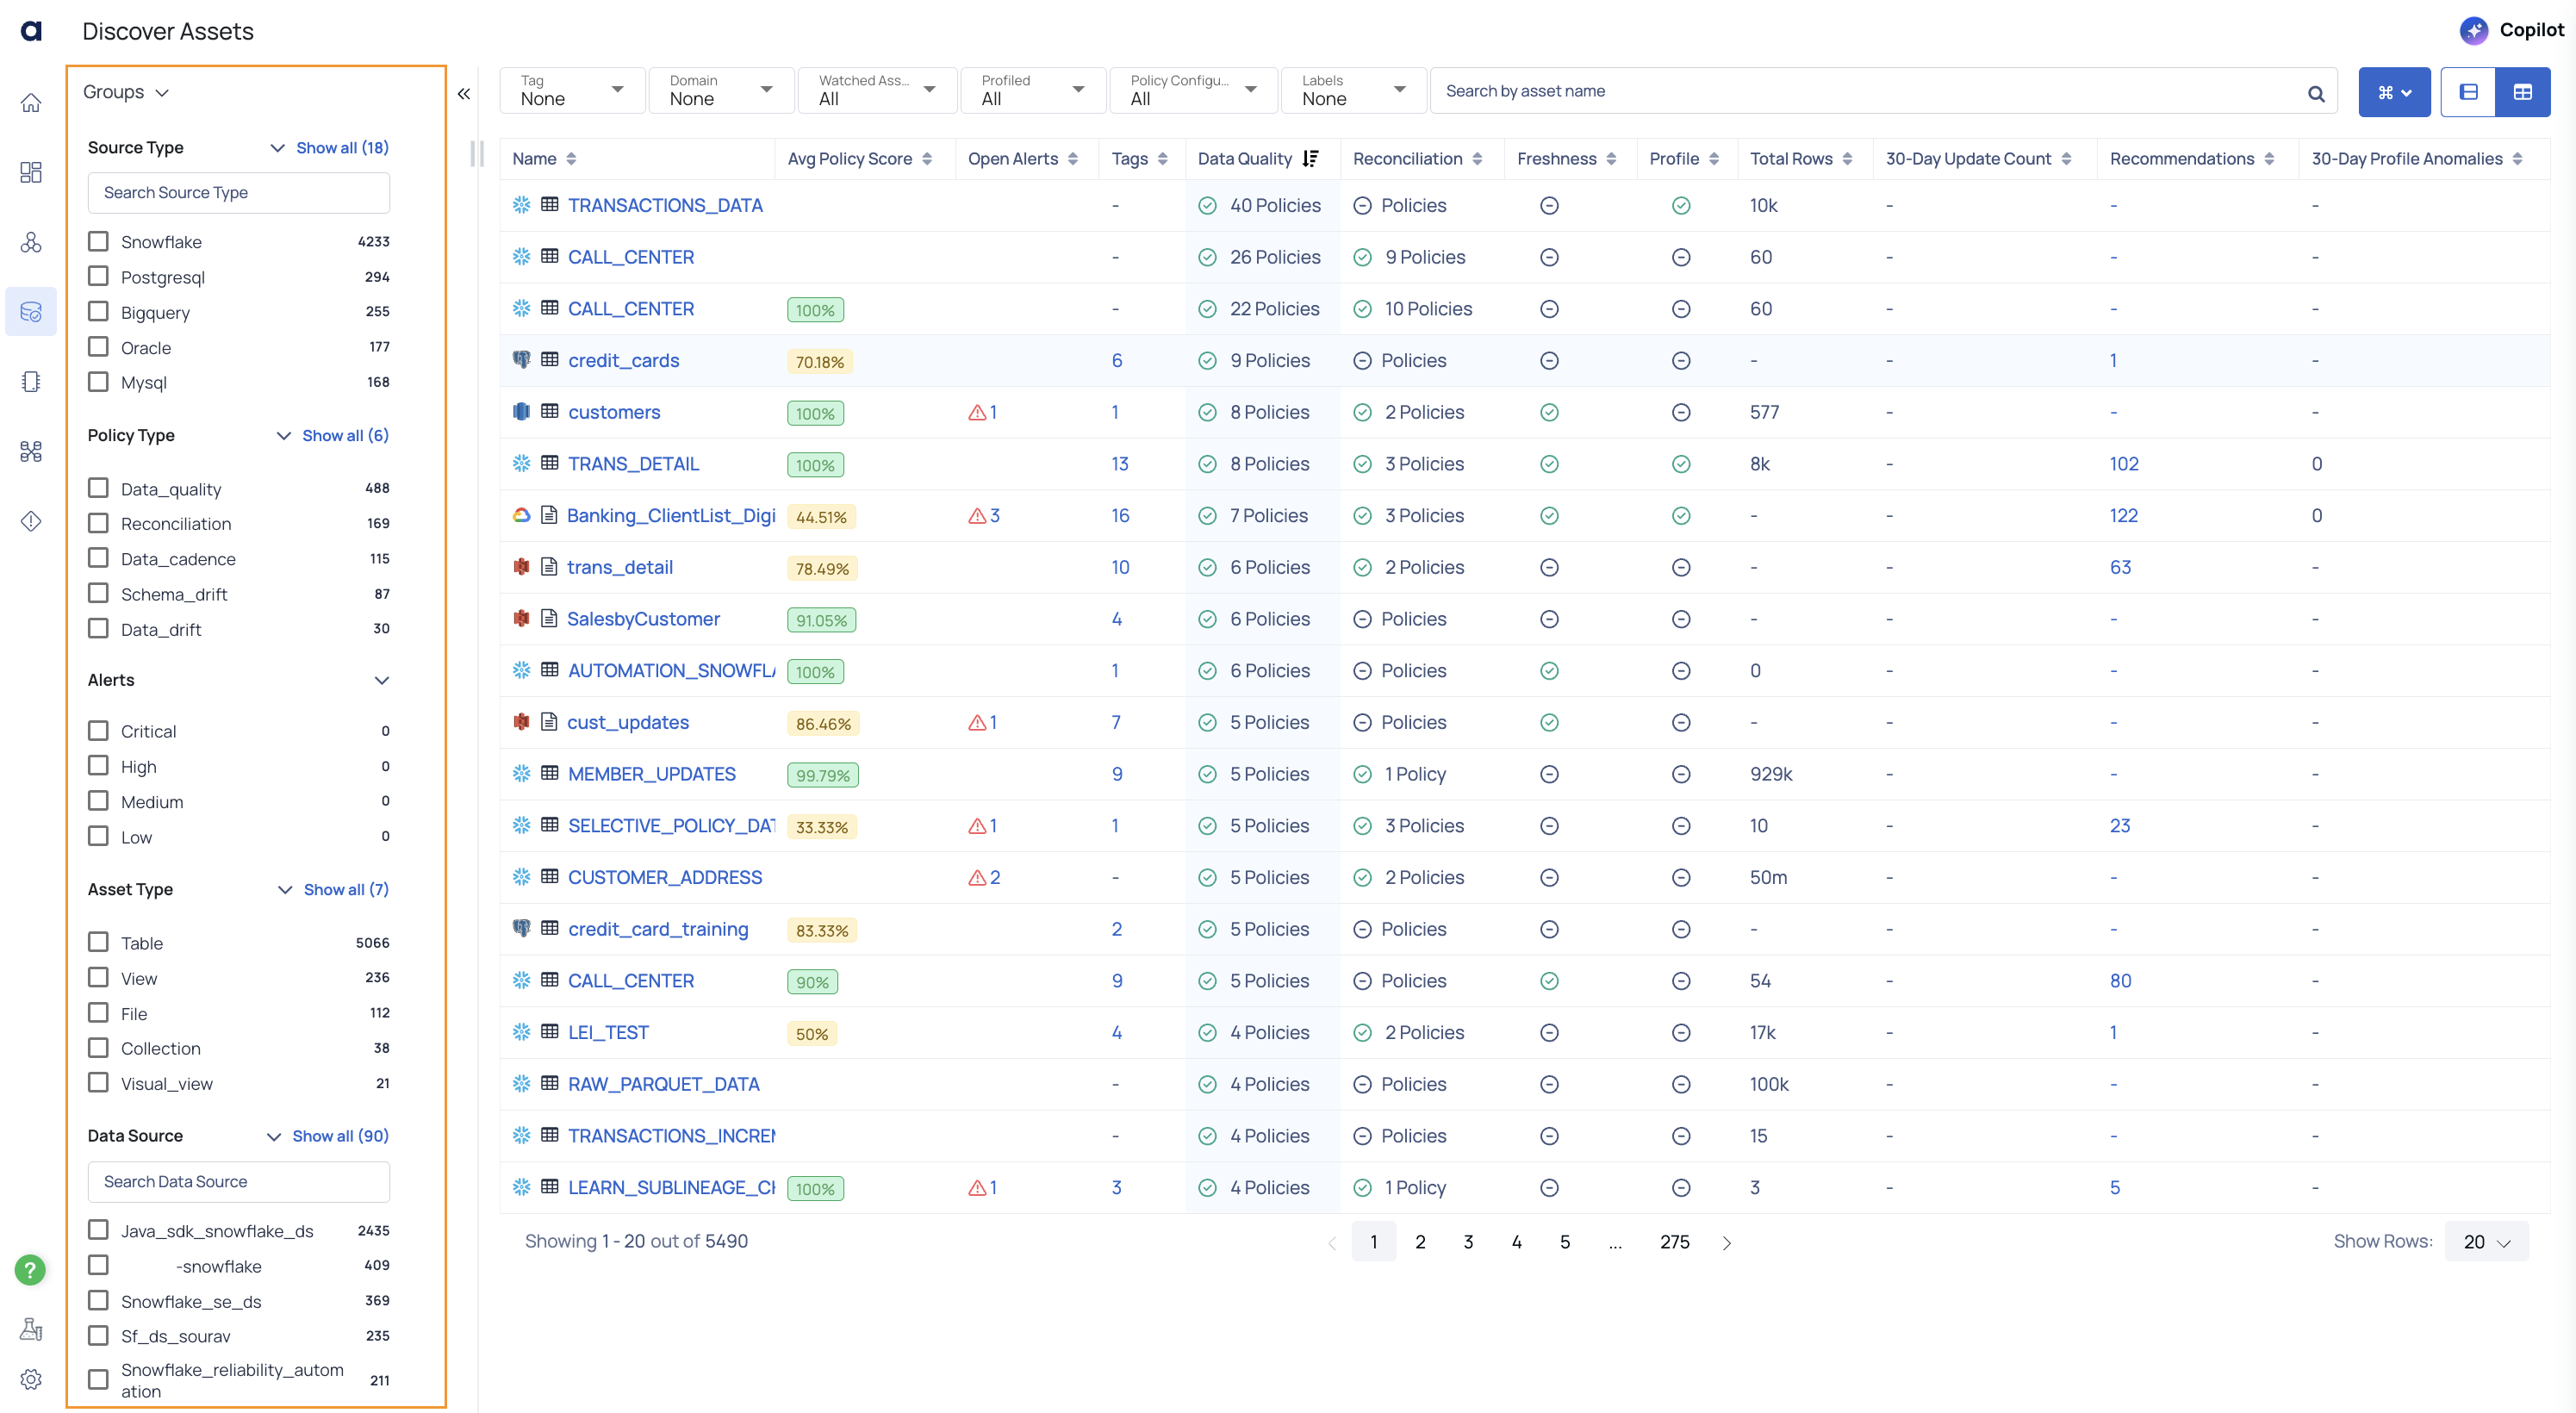
Groups (Left Panel)
To filter the assets table by groups, follow these steps:
Click the Navigator menu in the left panel.
From the dropdown, choose the Groups option.
- This replaces the Navigator's data source list with the following filters:
- Source Type
- Policy Type
- Alerts
- Asset Type
- Data Source
- This replaces the Navigator's data source list with the following filters:
View Asset/Policy Counts: Beside each filter option, a count of existing assets or policies is displayed. This count dynamically updates based on your filter selections, providing a better understanding of the distribution of assets or policies for the selected criteria.
Example:
- Selecting the Snowflake checkbox under the Source Type filter displays the count of Data Quality policies specific to Snowflake next to the Data Quality Policy filter under Policy Type.
- This allows you to quickly see how many Data Quality policies are applied to the Snowflake source type, simplifying navigation and filter interactions.
Main Search and Filter Bar (Top)
- Search by Asset Name: Quickly locate an asset by typing its name.
- Tag, Watched Assets, Profiled, and Policy Filters: Narrow results to focus on assets that meet specific criteria, such as those tagged or monitored, or assets with policies applied.
If filters are applied and the user navigates to the asset details page by clicking the asset name, the filters will remain applied when returning to the Discover Assets page using the back arrow button.
Assets Table (Center Panel)
Each row represents an asset with key metrics:
| Field | Description |
|---|---|
| Name | Asset name and source icon. Click to view details. |
| Avg Policy Score | Indicates the asset’s compliance with defined policies. |
| Open Alerts | Shows the number of issues or warnings for the asset. Click to investigate alerts. |
| Data Quality | Displays how many data quality policies apply and their status. |
| Reconciliation, Freshness, Profile: | High-level indicators of data consistency, update frequency, and statistical profiles. |
| Total Rows, 30-Day Update Count | Provides an idea of data volume and recent changes. |
| Recommendations | Suggestions to improve data quality or compliance. |
Actions Menu (Top-Right)
Use the Actions menu to:
- Add SQL View: Create a virtual SQL-based view of the selected asset.
- Add Visual View: Generate a visual representation or dashboard-like view.
- Query Lineage: Trace the data’s origin and downstream dependencies.
View Switcher (Top-Right)
Toggle between different layout (e.g., Discover Assets or Data Catalog) to find the display that best suits your needs.
When you switch to Data Catalog page, the layout remains similar to the previous Discover Assets view but without the left-side Navigator panel. You will still see the same filters and asset details at the top and in the main area, just without the source hierarchy tree. This provides a cleaner view if you already know the assets you are looking for.
Common Operations
- Locate an Asset: Use the search bar or filters to pinpoint the asset you’re looking for.
- Check for Alerts or Quality Issues: Review the “Active Alerts” or “Quality Error” filters, then open the asset to find root causes and recommended fixes.
- Understand Data Sources at a Glance: View the asset’s type, schema count, and last crawl time to gauge its complexity and freshness.
- Perform Actions on Assets: Use the Actions menu to add SQL or visual views and understand lineage, enabling advanced data analysis and troubleshooting.
- Hover your cursor over specific fields or icons to view additional tooltips.
- Clicking an asset name often provides more detailed information, including data quality scores and lineage details.
- Combine filters to narrow down large numbers of assets efficiently (e.g., “Profiled” + a specific source type).