Dashboard
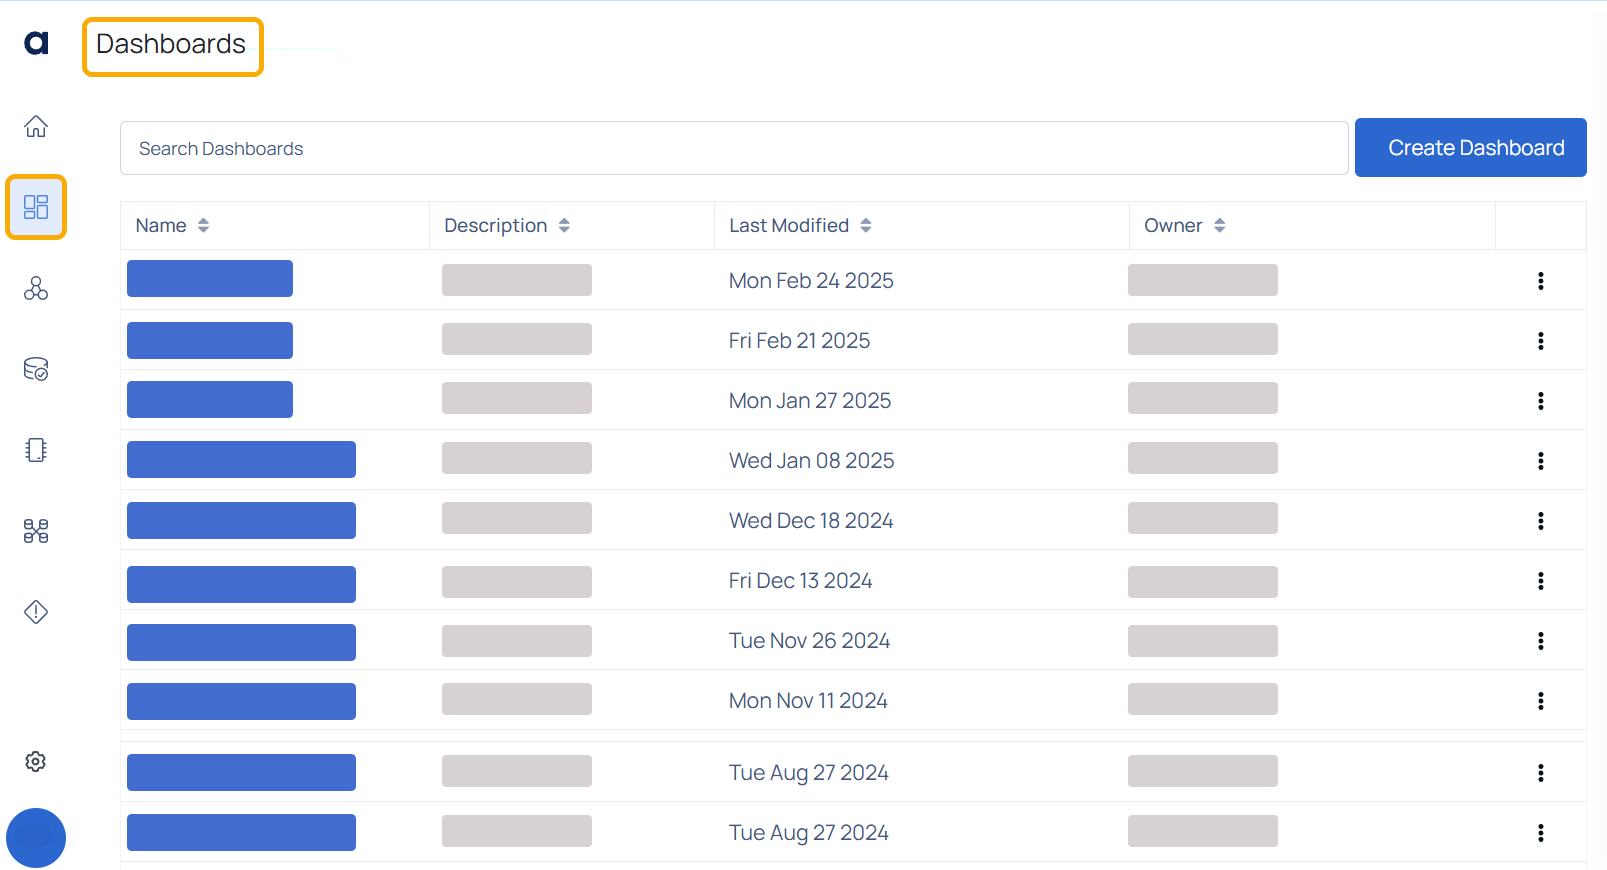
The Dashboards page allows you to create, customize, and manage your own dashboards to suit your specific needs. You can add and arrange widgets to display relevant information, set personalized dashboards as the default view and create multiple dashboards for different purposes such as Cost Summary or Data Quality. With an intuitive framework for building and managing widgets, you can efficiently tailor your dashboard experience and easily access critical insights.
Create a Dashboard
To create a dashboard, perform the following:
- Navigate to the dashboards page from the left menu.
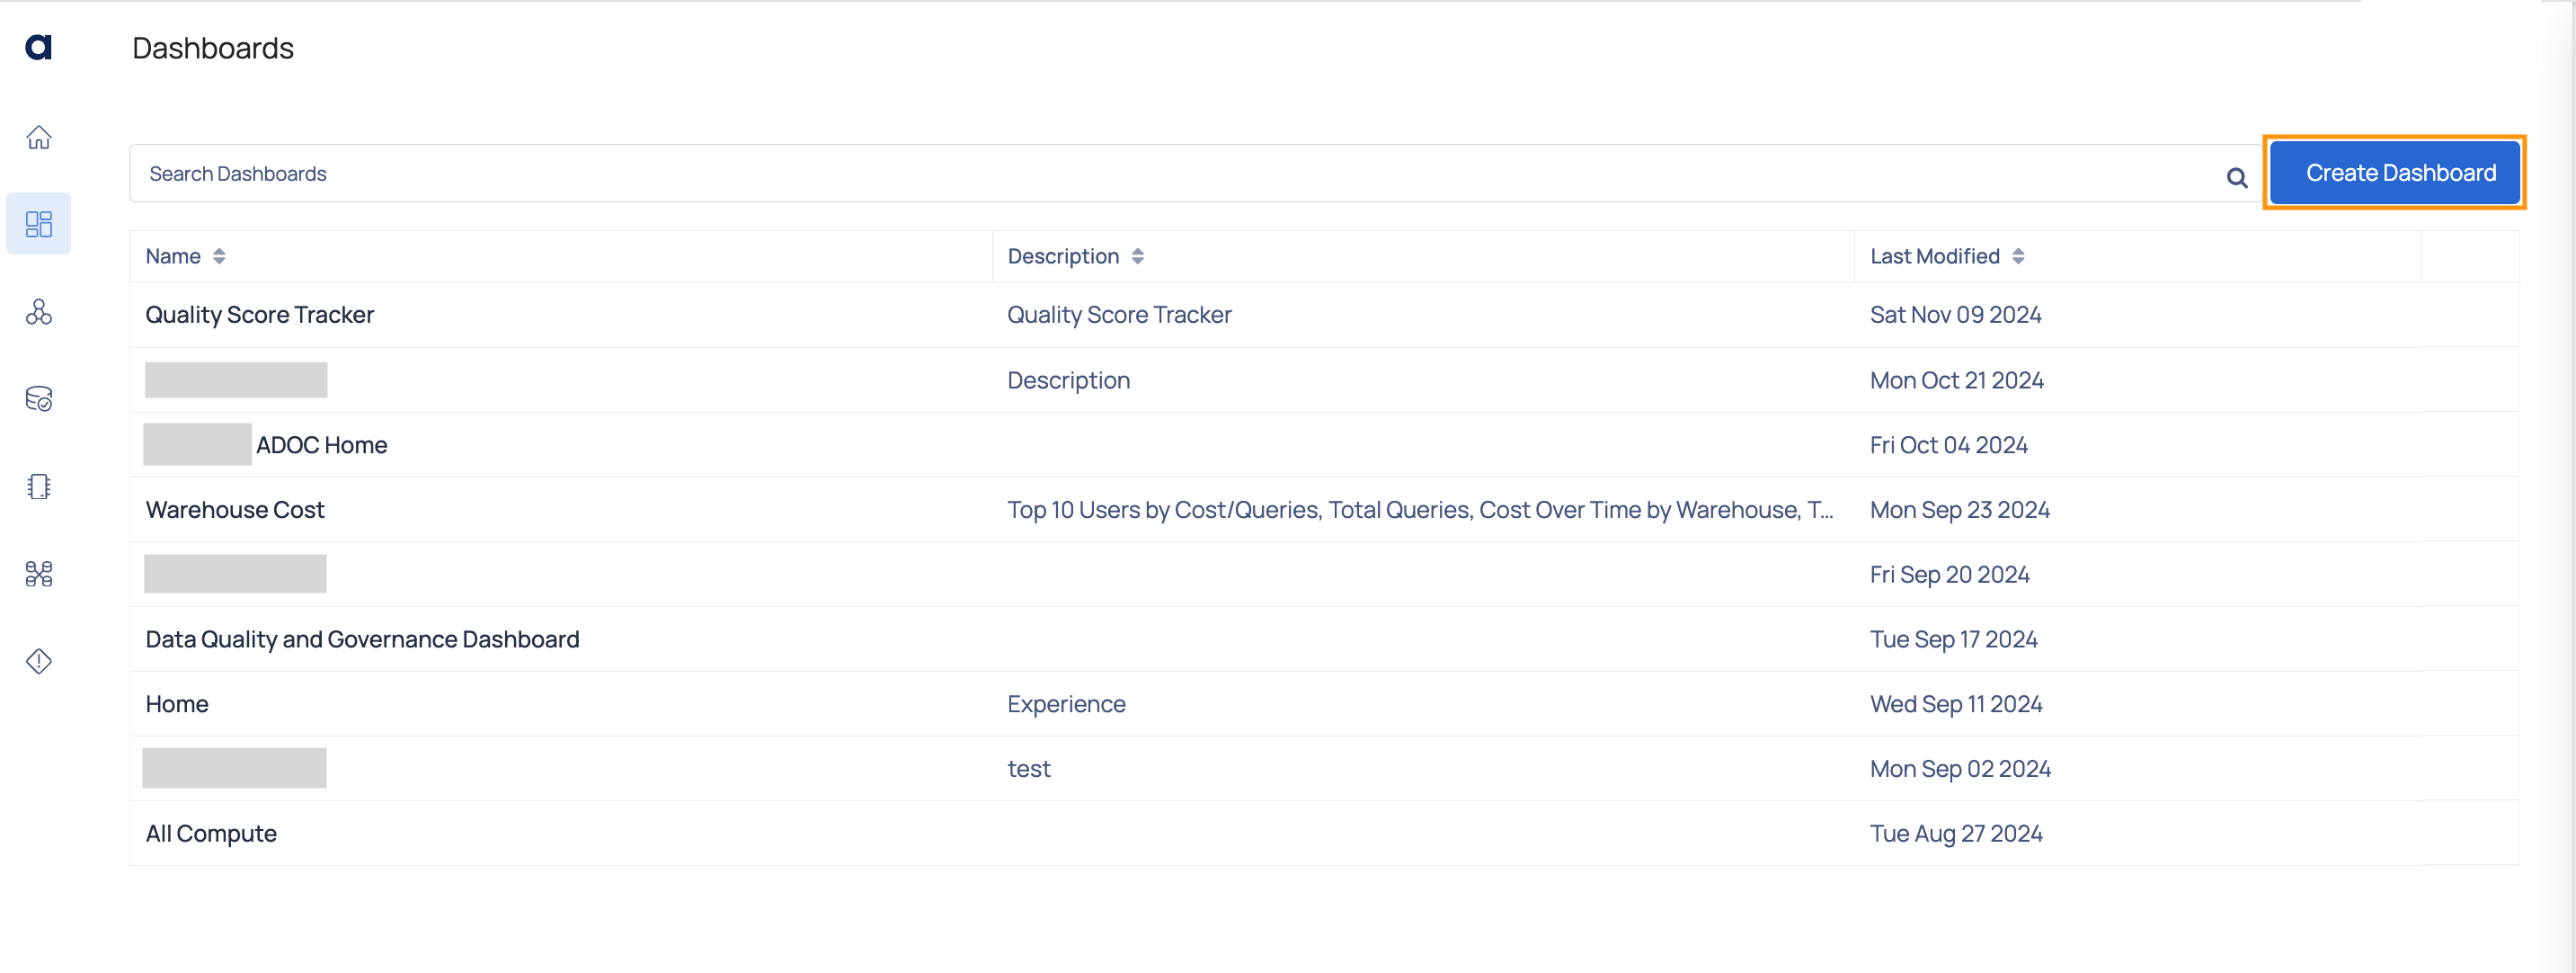
- Click the Create Dashboard button.
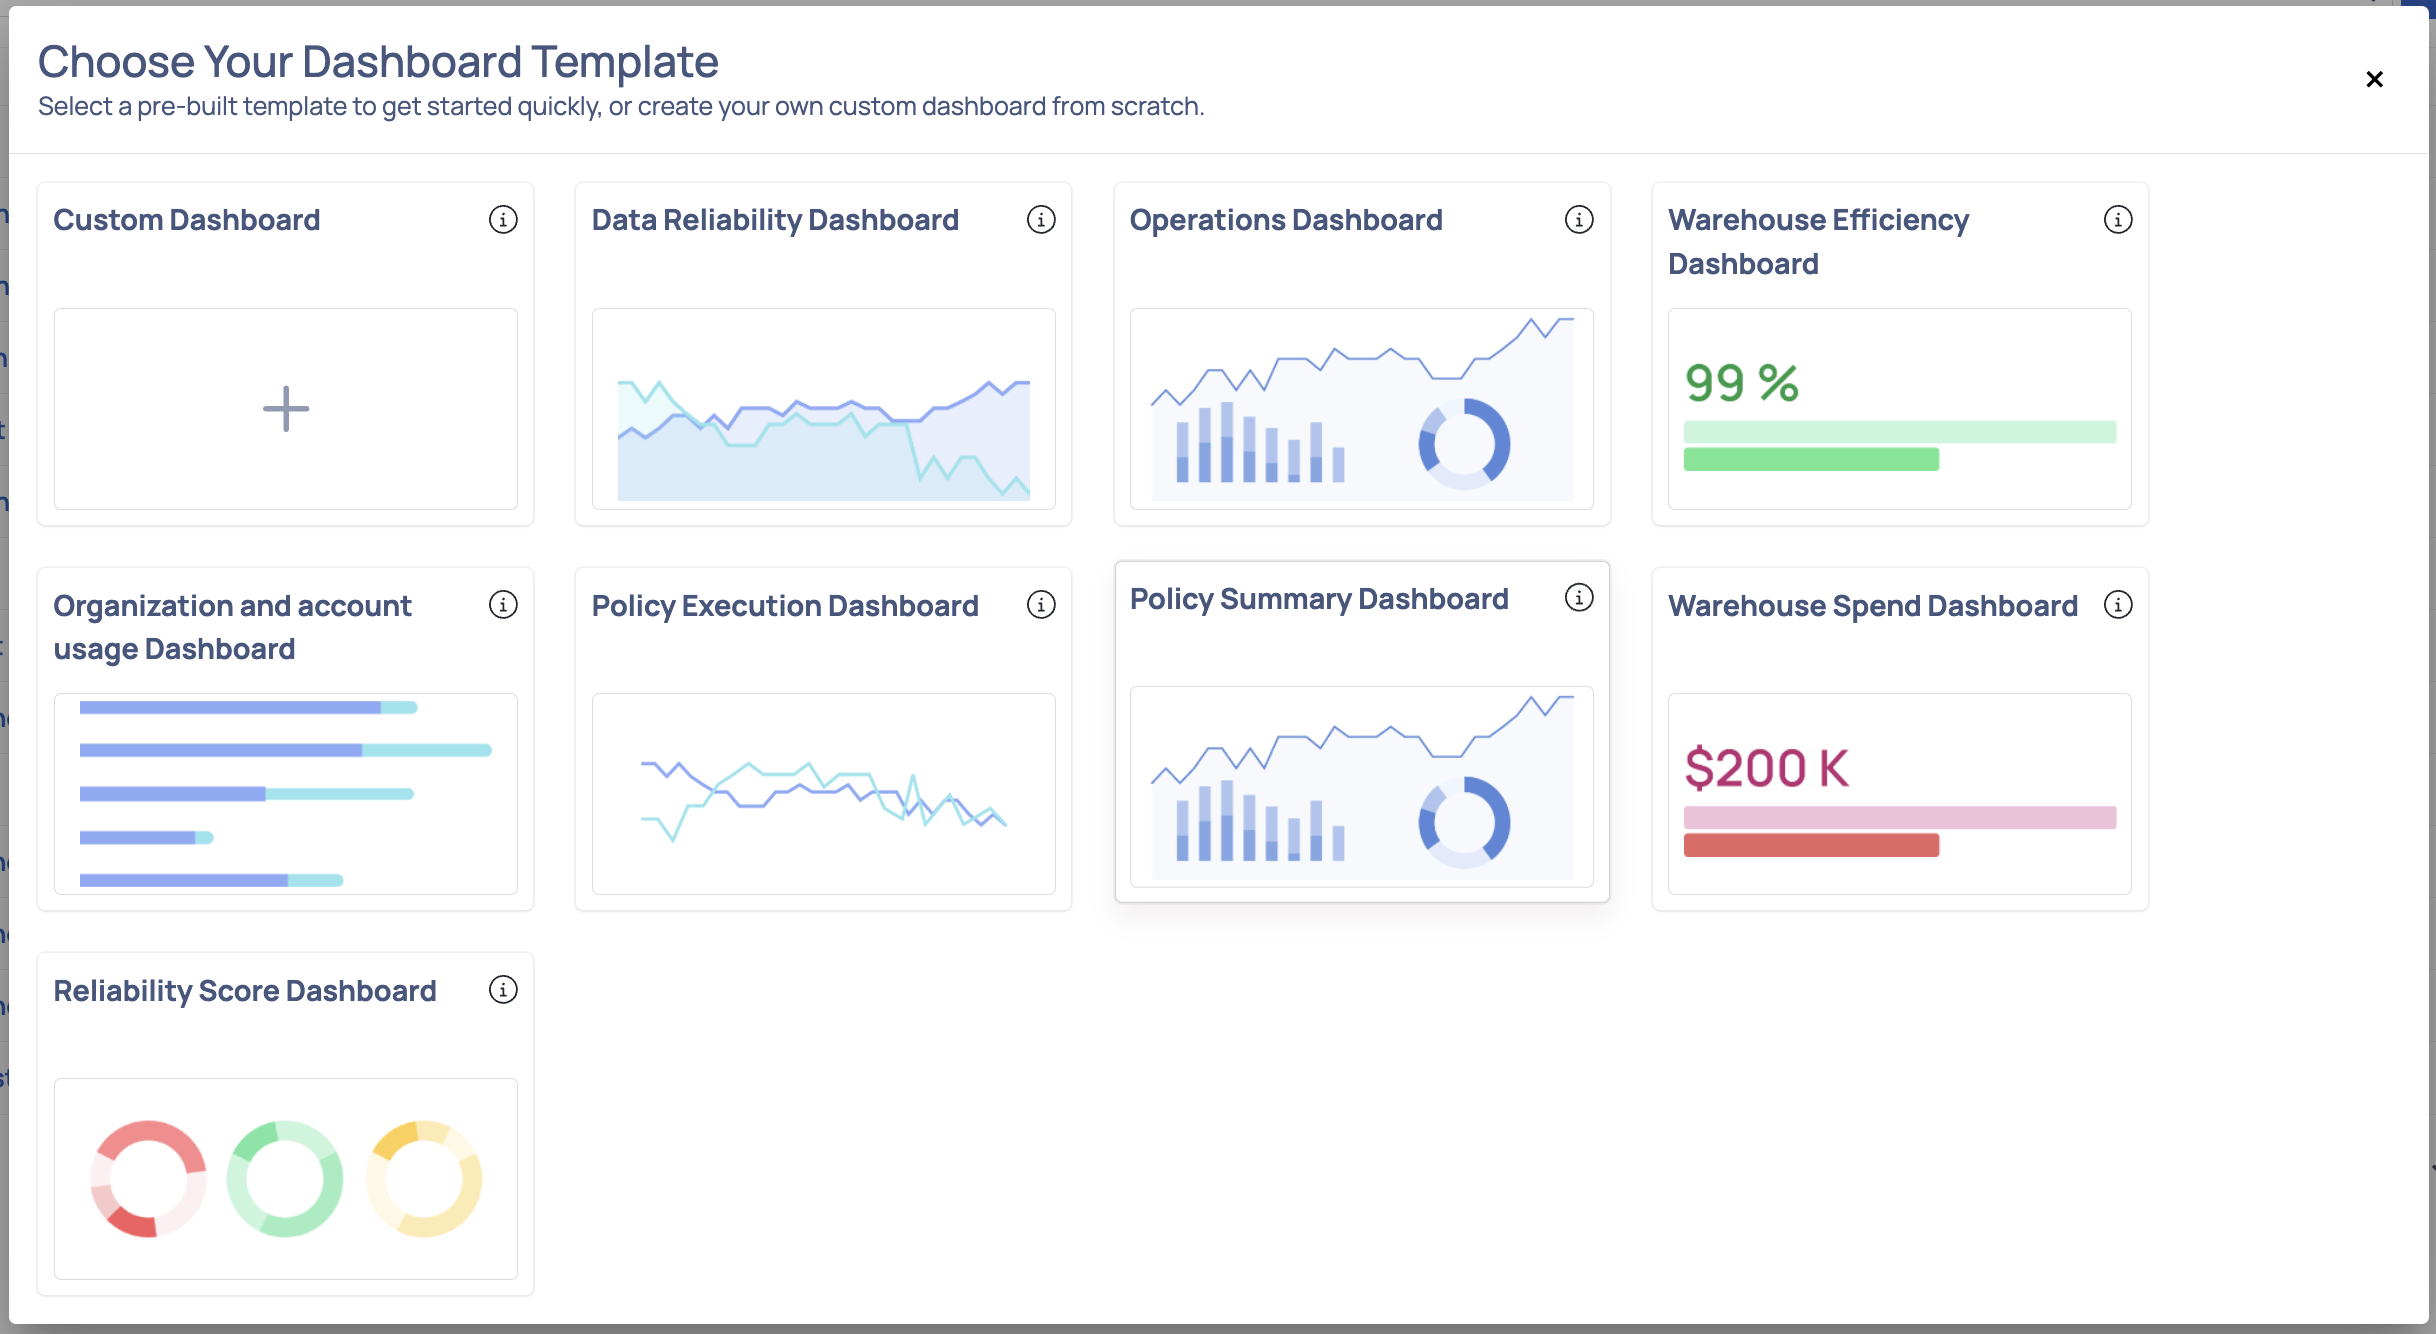
- Select the Dashboard Template: Users now have access to pre-built default dashboards for quick setup.
Available Widgets include:
| Dashboard Widgets | Description |
|---|---|
| Score by Asset and Policy | Shows current vs. average execution scores per asset to track performance trends and deviations |
| Reliability Score Card | Displays the Data Reliability Scores, providing a quick overview of data integrity and accuracy metrics. |
| Reliability Score by Source Type | Displays detailed breakdown of various data reliability dimensions per asset |
| Reliability Policy | Provides policy counts by reliability dimension for easy monitoring and coverage assessment |
| Policy Executions - Schema Drift | Execution Summary of Schema Drift policies |
| Policy Executions - Reconciliation | Execution summary of Reconciliation policies |
| Policy Executions - Profile Anomaly | Execution Summary of Profile Anomaly policies |
| Policy Executions - Data Quality | Execution summary for data quality policies. |
| Policy Executions - Data Freshness | Execution Summary of Data Freshness policies |
| Policy Executions - Data Drift | Execution summary of Data Drift policies. |
| Policy Execution | Shows the total number of policy executions and provides a detailed breakdown by execution status. Offers quick insights into policy performance |
| Warehouse Metrics | Table of Warehouse Metrics |
| Users per Warehouse | This widget displays the number of users for each warehouse. |
| Users per Database | This graph displays the number of users for each database. |
| Users | This table displays all the user data. You can check important data like default role assigned to each user, warehouse assigned for each user, |
| User Roles Audit | This table displays a list of users, their assigned roles, and the roles that the user has but hasn't been assigned (as a result of role hierarchy). |
| User Privileges | This graph displays a list of the privileges assigned to each user for the mentioned resource. To view data specific to a user, role, resource, etc. |
| User Adoption Summary | Provides insights for the user adoption for Snowflake platform. |
| User adoption ratio | User adoption ratio compared to total number of users |
| Unused Views | Displays views untouched by DDL/DML statements in the last 90 days |
| Unused Tables | Displays tables untouched by DDL/DML statements in the last 90 days |
| Unused Roles | The widget displays the roles not assigned to any users |
| Total Users and Default Roles | This Widget displays the number of users for each role created in Snowflake. |
| Total Spend Per Service - All Accounts | This widget shows the cost incurred per service across all Snowflake accounts of your organization. |
| Total Spend Per Account | This widget shows incurred cost across organization's Snowflake accounts |
| Total Roles and User Count | Displays the count of users granted access to each role |
| Total Queries | Total Queries over selected date range |
| Total Cost For Selected Date Range | This widget displays the total Cost For Selected Time Period |
| Top 5 Storage Cost by Tables | The top 5 tables which incur the highest amount of storage cost. |
| Top 5 Storage Cost By High Churn Tables | The top 5 churn tables which incur the highest amount of storage cost. High churn is the ratio between fail safe and active bytes. |
| Top 5 Storage Cost by Databases | The top 5 databases which incur the highest amount of storage cost. |
| Top 5 Materialized Views Cost | Top 5 Materialized Views Cost |
| Top 5 Cost By Databases | Top 5 Databases which incur the highest cost of Materialized View |
| Top 5 Bytes Re-clustered by Table | Top 5 Bytes Re-clustered by Table when Auto-Clustering was switched ON |
| Top 5 Bytes Re-clustered by Database | Top 5 Bytes Re-clustered by Database |
| Top 50 Tables Accessed | Details of the top accessed tables in your account. |
| Top 50 Most Used Tables | This visualization lists the top accessed tables in the selected time period |
| Top 15 Users | Top 15 Users by Total number of Queries over selected date range |
| Top 15 Frequent Queries by Warehouse | Top 15 Frequent Queries over selected date range |
| Top 10 Users By Cost & Queries | Top 10 Users by cost & queries |
| Storage Cost Summary (Last 12 Months) | Storage Cost Insights for last 12 months |
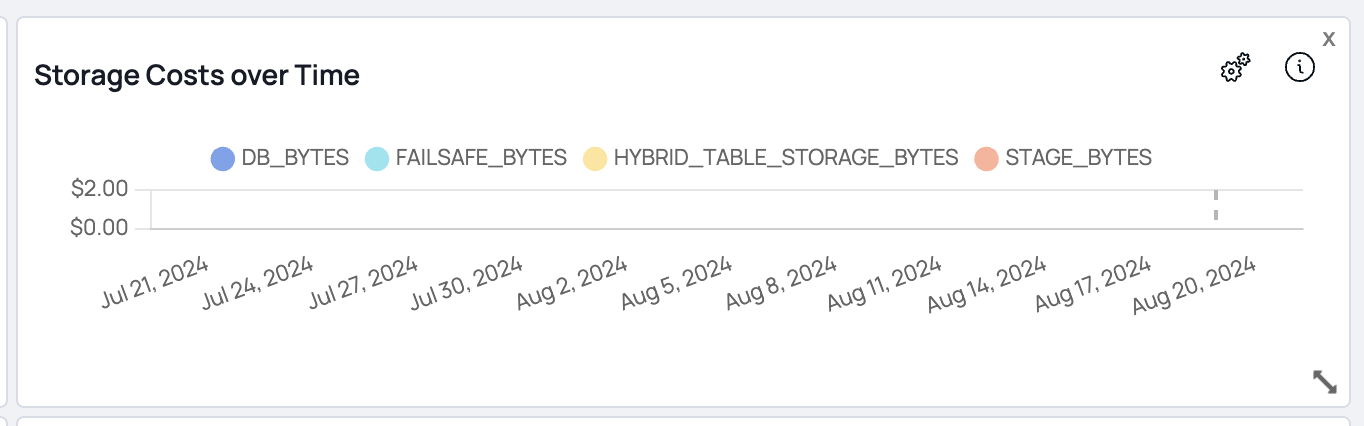
| Storage Cost over Time | This graph displays the database and fail safe cost during selected date range |
| Spend Tracking Summary | This widget shows the actual dollars spent and percentage basis the contract amount |
| Spend Forecast | Displays predicted potential overspend or underspend on the total contract amount |
| Services Cost - Over Time | Shows the cost incurred for all the services over time for the selected date range |
| Services Cost - Aggregated | Shows the aggregated cost incurred on each service during the selected time period. |
| Rule Success By Data Dimension Scores | This chart provides the performance trend of rule success by data dimension scores over time. |
| Query Time Over Time | Displays the median value of time taken for various query operations (compilation time, execution time) |
| Query Time By Warehouse Size | This graph displays the median value of time taken for various query operations (like compilation time, execution time ), for each warehouse size |
| Query Time By Warehouse Name | This graph displays the median value of time taken for various query operations (like compilation time, execution time ), for each warehouse. |
| Query Time By Database | Displays the median value of time taken for various query operations (like compilation time, execution time ), for each database. |
| Query Provisioning Wait Times | This widget displays Query Provisioning Wait Time for selected date range |
| Query Overload Wait Times | Displays summary of Query Overload Wait Times for selected date range |
| Query Execution Times | Summary of Query Execution Times for selected date range |
| Query Count Per Warehouse | This widget displays query count per Warehouse |
| Query Count By Query Type | This widget displays the Query Count By Query Type |
| Query & Cloud Services Costs per Warehouse | Estimated cost of each query vs the cloud services charge for each query grouped by warehouse |
| Queries Summary | This widgets displays the Query summary details for the selected data source |
| Queries per warehouse size | This graph displays the queries executed in each warehouse. |
| Performance trend - Reliability Scores | Displays the performance trend of data reliability scores over a selected period of time |
| Performance trend - Policy Execution By Type | Shows the performance trend of policy executions by policy type over a selected period of time. |
| Performance trend - Policy Execution By Status | Displays the performance trend of policy executions by policy status over a selected period of time. |
| Monthly Costs for Compute (Last 12 Months) | Cost Insights for Compute for the last 12 months. |
| Materialized View Cost Summary (Last 12 Months) | Cost summary of materialized view over the last 12 months. |
| Long Running Tasks | Tasks with execution time greater than 1 hour during the selected time period. |
| Logins Over Time | This graph displays the comparative data between the number of successful logins and unsuccessful logins, during the selected time period. |
| Logins By Versions | This bar graph shows the various Snowflake client versions from which users logged into Snowflake. |
| Logins by User/IP | Displays the IP addresses from which users logged into Snowflake along with the number of times the user logged in from an address. |
| Logins by Client Type | This bar graph shows the various login mediums used by users to log in to Snowflake. |
| Frequent Login Failures | This table displays all the data related to login failure. |
| Forecast Per Service - All Accounts | Displays forecasted costs per service across all Snowflake accounts |
| Forecasted Per Account | Shows incurred vs. forecasted costs across your organization's Snowflake accounts |
| Failed Tasks | This table displays information about the failed tasks during the selected time period. |
| Failed Queries | Displays the count of error codes across queries, their corresponding error messages, and the total execution time associated with them. |
| Dormant Users | The widget displays the Users who have either not logged in during the past 90 days or users created more than 30 days ago who never logged in |
| Dormant Users Percentage | This pie chart displays the percentage of dormant users as compared to total users. Users who have not logged in during the past 90 days. |
| Deprecated Driver Usage | This widget provides details of deprecated driver used by different users during selected time range. |
| Daily and Cumulative Monthly Cost | Displays a comparative trend of cost incurred on warehouses, based on the selected time period. |
| Cost Per Warehouse | Shows the cost incurred on each warehouse. |
| Cost over Time | Shows comparative costs for each warehouse over the selected time period |
| Cost & Bytes Re-clustered over time | Cost & Bytes Clustered over time. Applies when auto clustering is enabled for Tables & Views |
| Contract Details | This widget shows the Snowflake contract's start date, end date, and total amount |
| Compute Cost For Selected Date Range | Displays the compute cost incurred for selected date range |
| Cloud Services Estimated Cost by Query Type | This pie chart displays the estimated cost of a cloud service query, grouped by query type. View can be filtered on query type. |
| Average Duration Per Query By Warehouse Size | This widget displays the average duration per query by warehouse size |
| Average Bytes Per Query By Warehouse Size | Average Bytes Per Query By Warehouse Size |
| Auto Clustering Cost Summary (Last 12 Months) | Displays summary of the auto clustering cost (Over the last 12 months) |
| Account Admins | Users with Account Admin access |
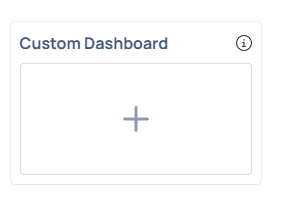
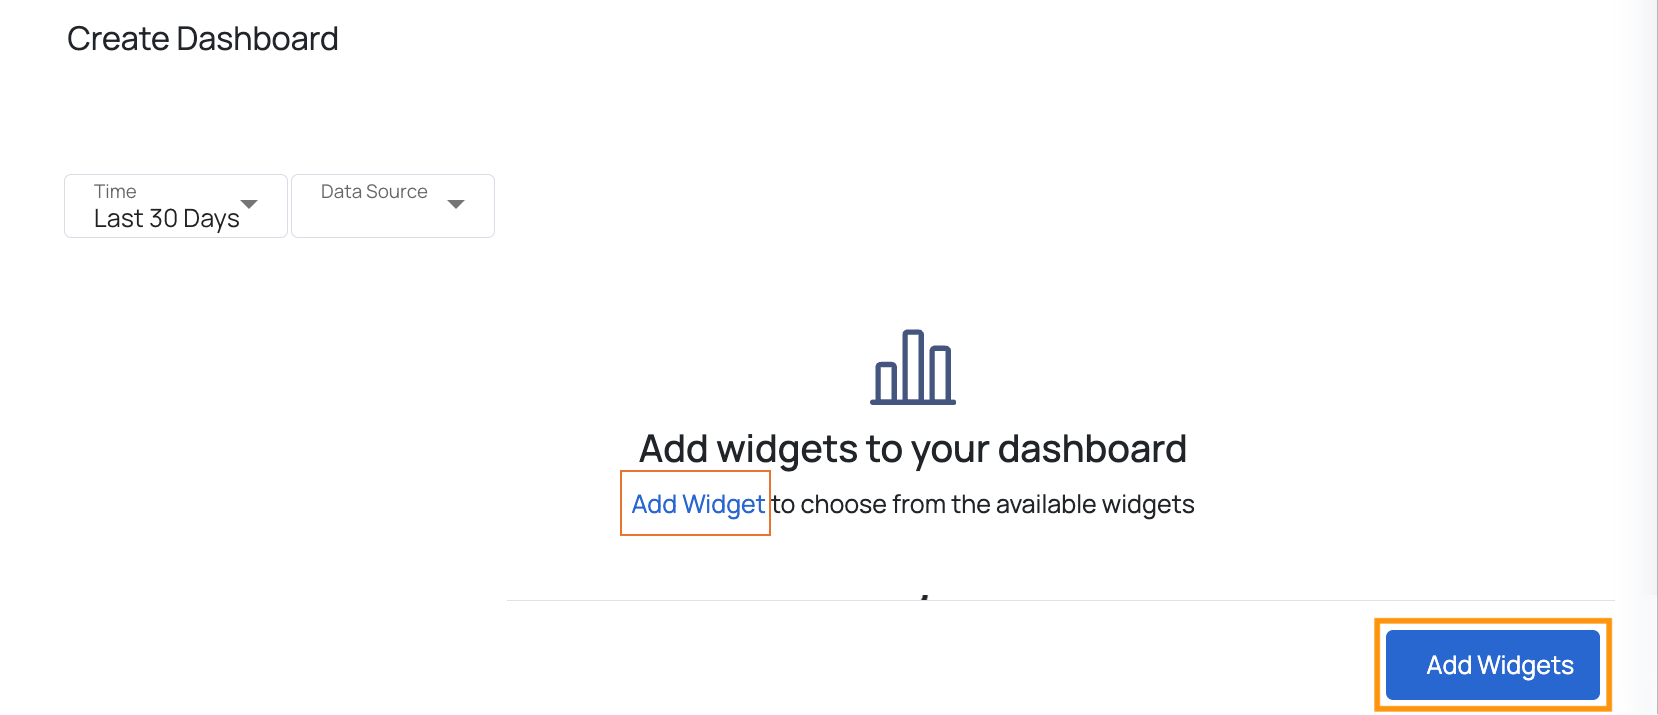
Add Widgets : To create a fully customized dashboard, select the Custom Dashboard option.
A dashboard cannot contain widgets of different types. Ensure that all selected widgets belong to the same category (e.g., Compute or Data Reliability). For example, if you add a Data Reliability widget, you cannot include a Compute widget in the same dashboard. This restriction helps maintain data consistency and ensures accurate visualization.
a. On the Create Dashboard page, click the Add Widgets button. A pop-up window will appear with widget options
b. Select up to 10 widgets for a specific data source.
c. After selecting the widgets, click Done at the bottom of the pop-up window.
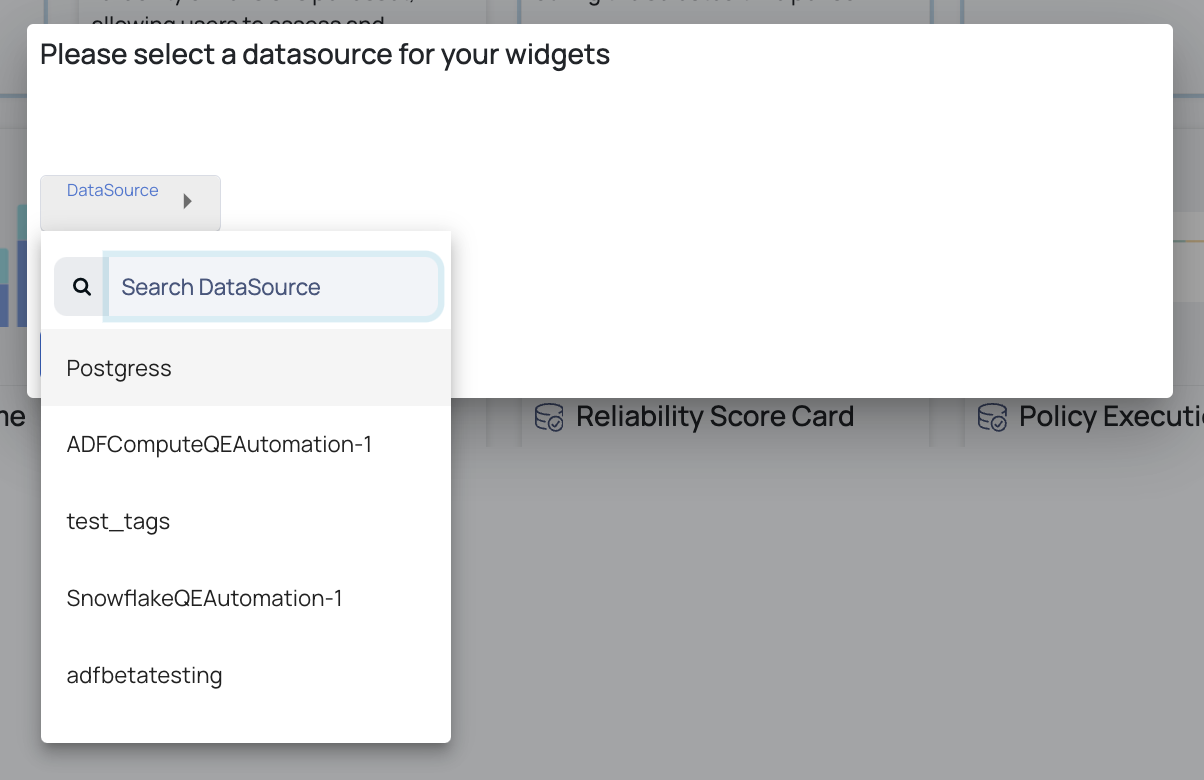
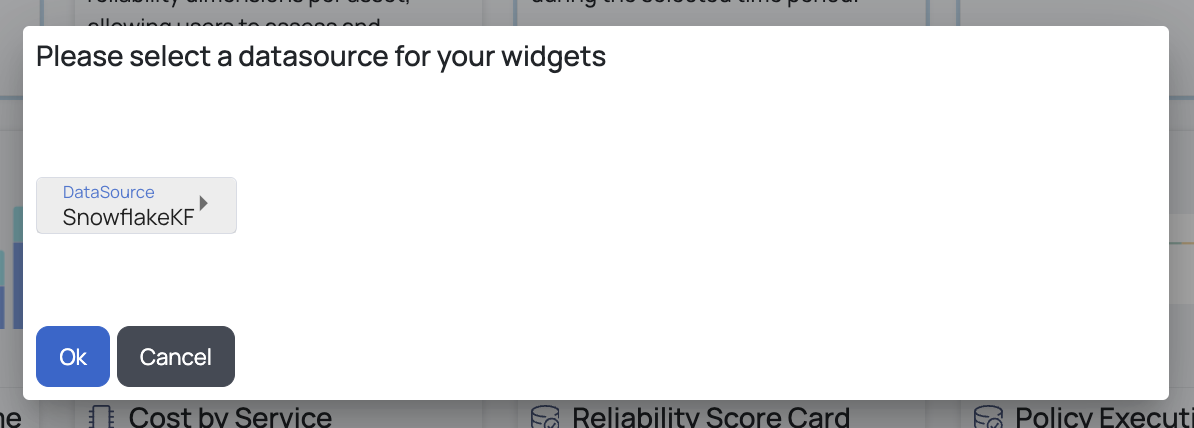
- Select Data Source
- Choose a data source for which you want to create the dashboard and add widgets.
- Click OK to confirm.
Enhanced Widget Library & Selection
The widget library now offers new filtering options and streamlined descriptions for easier navigation and selection.
Filter Widgets by Type & Tags:
- Use the Widget Type filter to narrow down widget categories (e.g., Compute, Data Reliability).
- Use the Tags filter to refine selections based on cost, database, forecast, or operations.
- Click Apply Filter to update the widget list.
Improved Widget Metadata:
- Widget descriptions now offer clearer insights into their functionality and data representation.
- Updated metadata ensures users can quickly identify the most relevant widgets for their dashboards.
Customizing Your Dashboard
Once a dashboard is created, users can modify it to fit their needs:
Add More Widgets: Click the Add Widgets button to include additional widgets.
Delete Widgets: Remove a widget by clicking the X icon.
Resize Widgets: Adjust size by dragging the resize icon in the bottom-right corner.
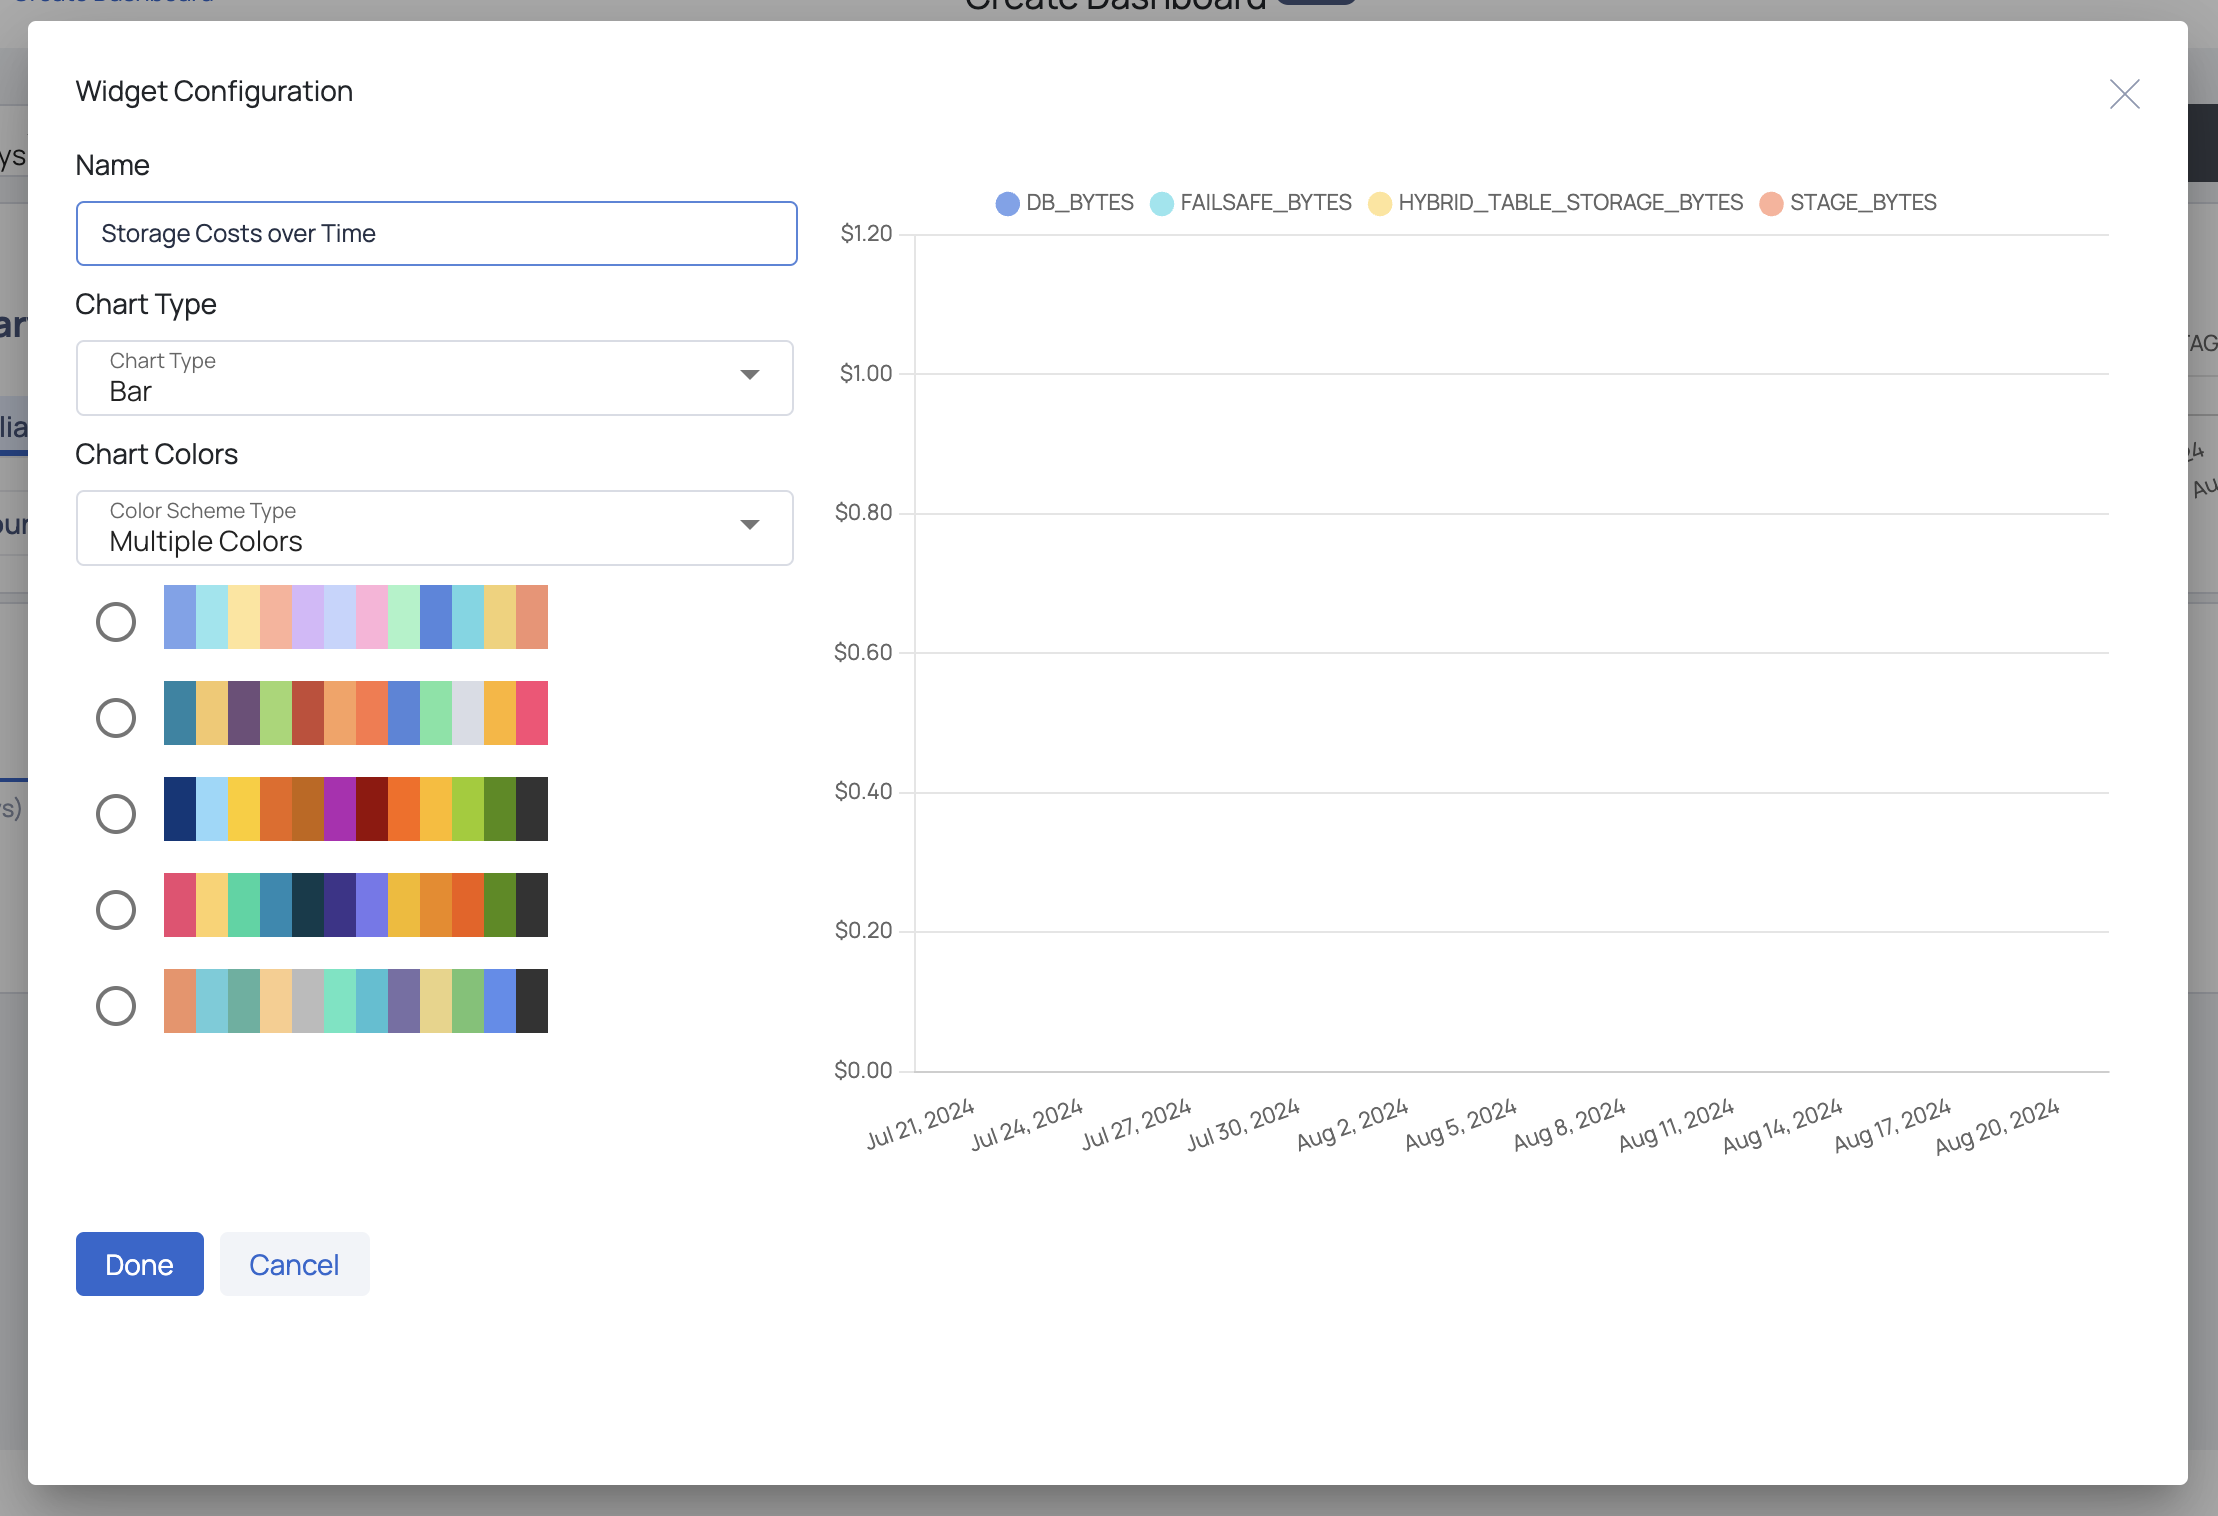
Edit Widget Configuration:
- Click the Settings icon on a widget.
- Modify the name, chart type, and colors.
- Preview changes before clicking Done.
- Apply Filters: Use policy type, tags, or last result status to refine displayed data.

.
Saving & Managing Dashboards
Save Your Dashboard
- Click the Save button.
- In the pop-up window, enter a unique Report Name and a brief Report Description.
- Click Submit to save your dashboard.
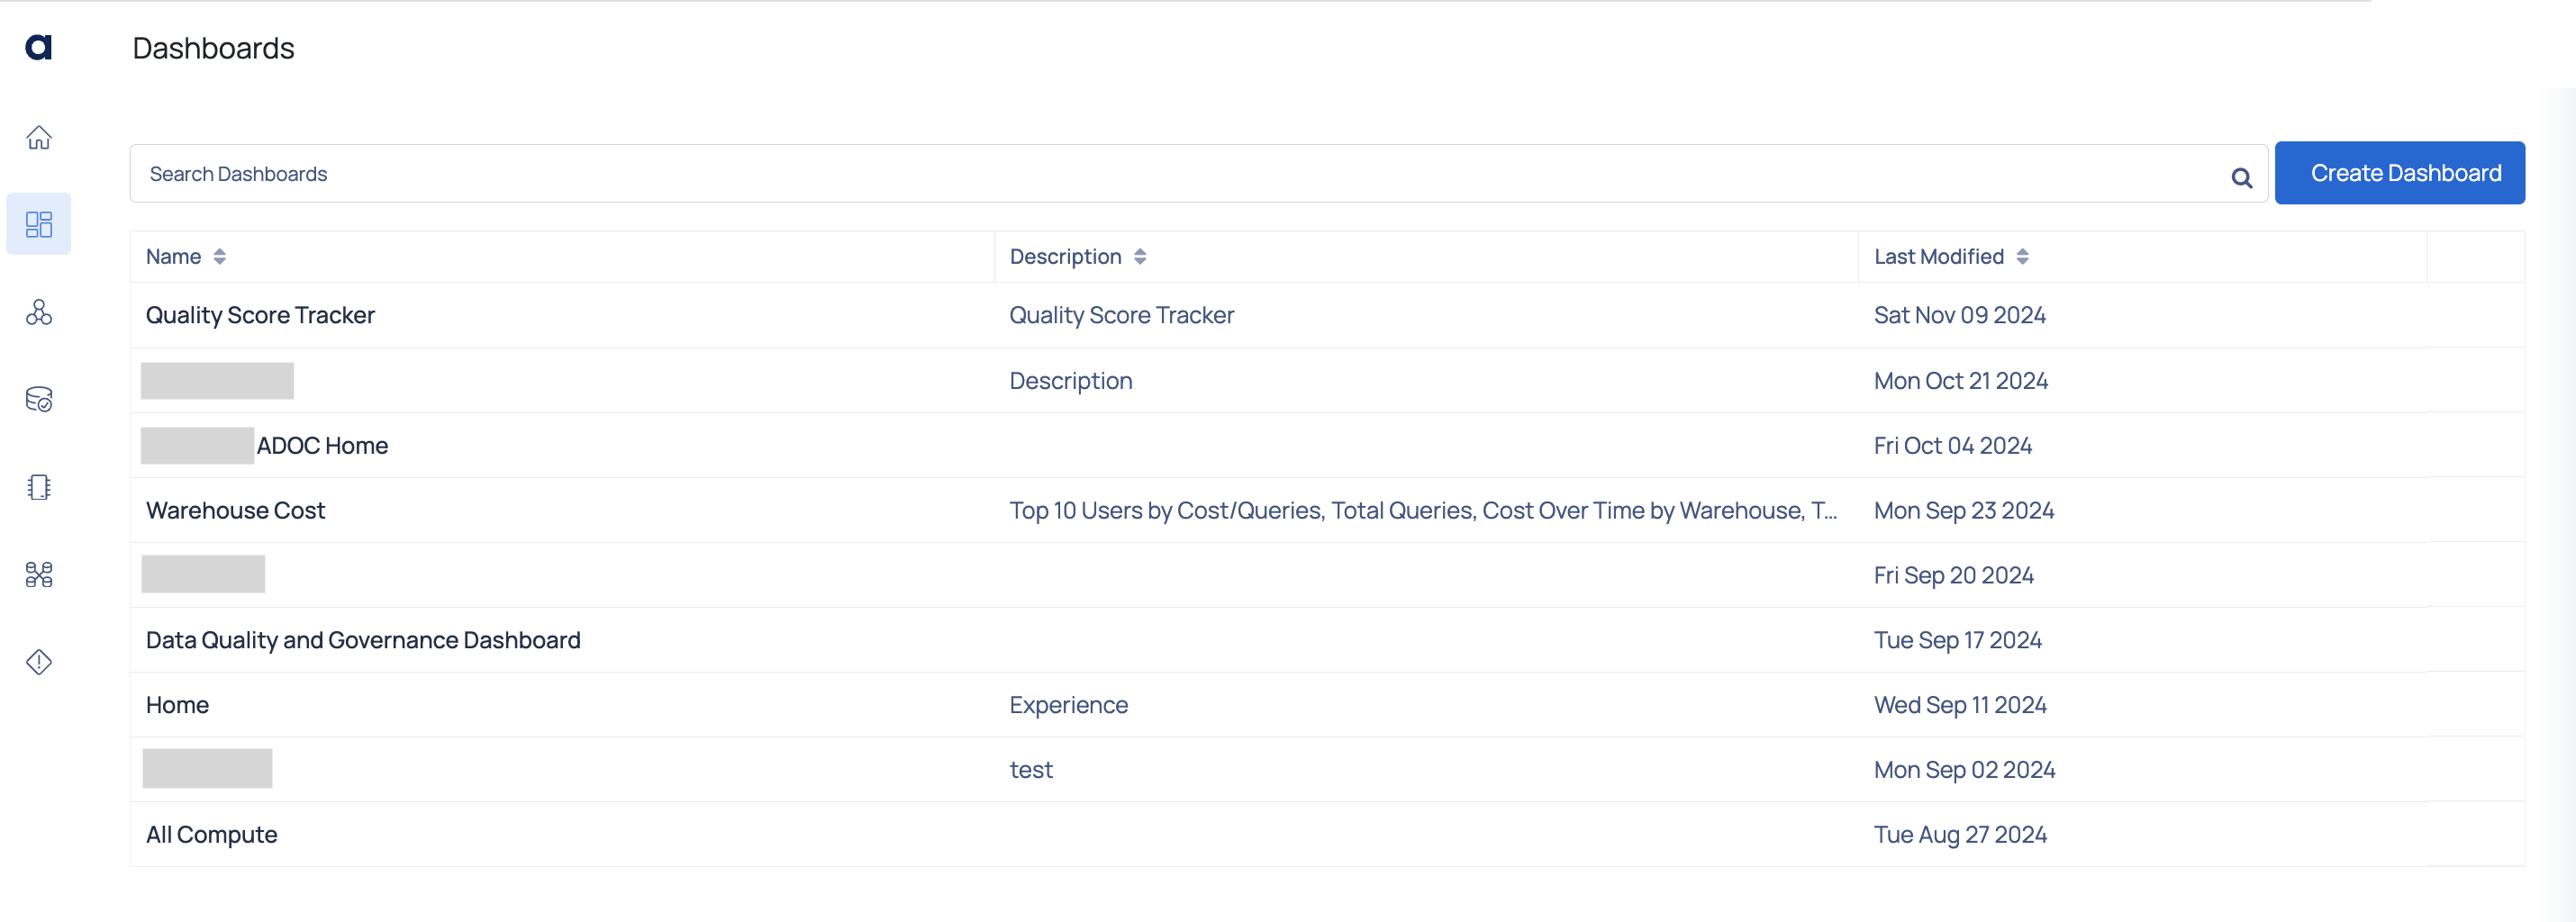
After saving a report, it will appear on the Dashboards page. Here, you can view all your custom dashboards and use the search bar to find a specific one. Dashboards are listed by name, with their descriptions and the date of the last modification provided.
View & Manage Dashboards
- All saved dashboards appear on the Dashboards page.
- Use the search bar to locate specific dashboards.
- Dashboards are listed with their name, description, and last modified date.
- Click a dashboard name to view its contents and apply time-based or data source filters.
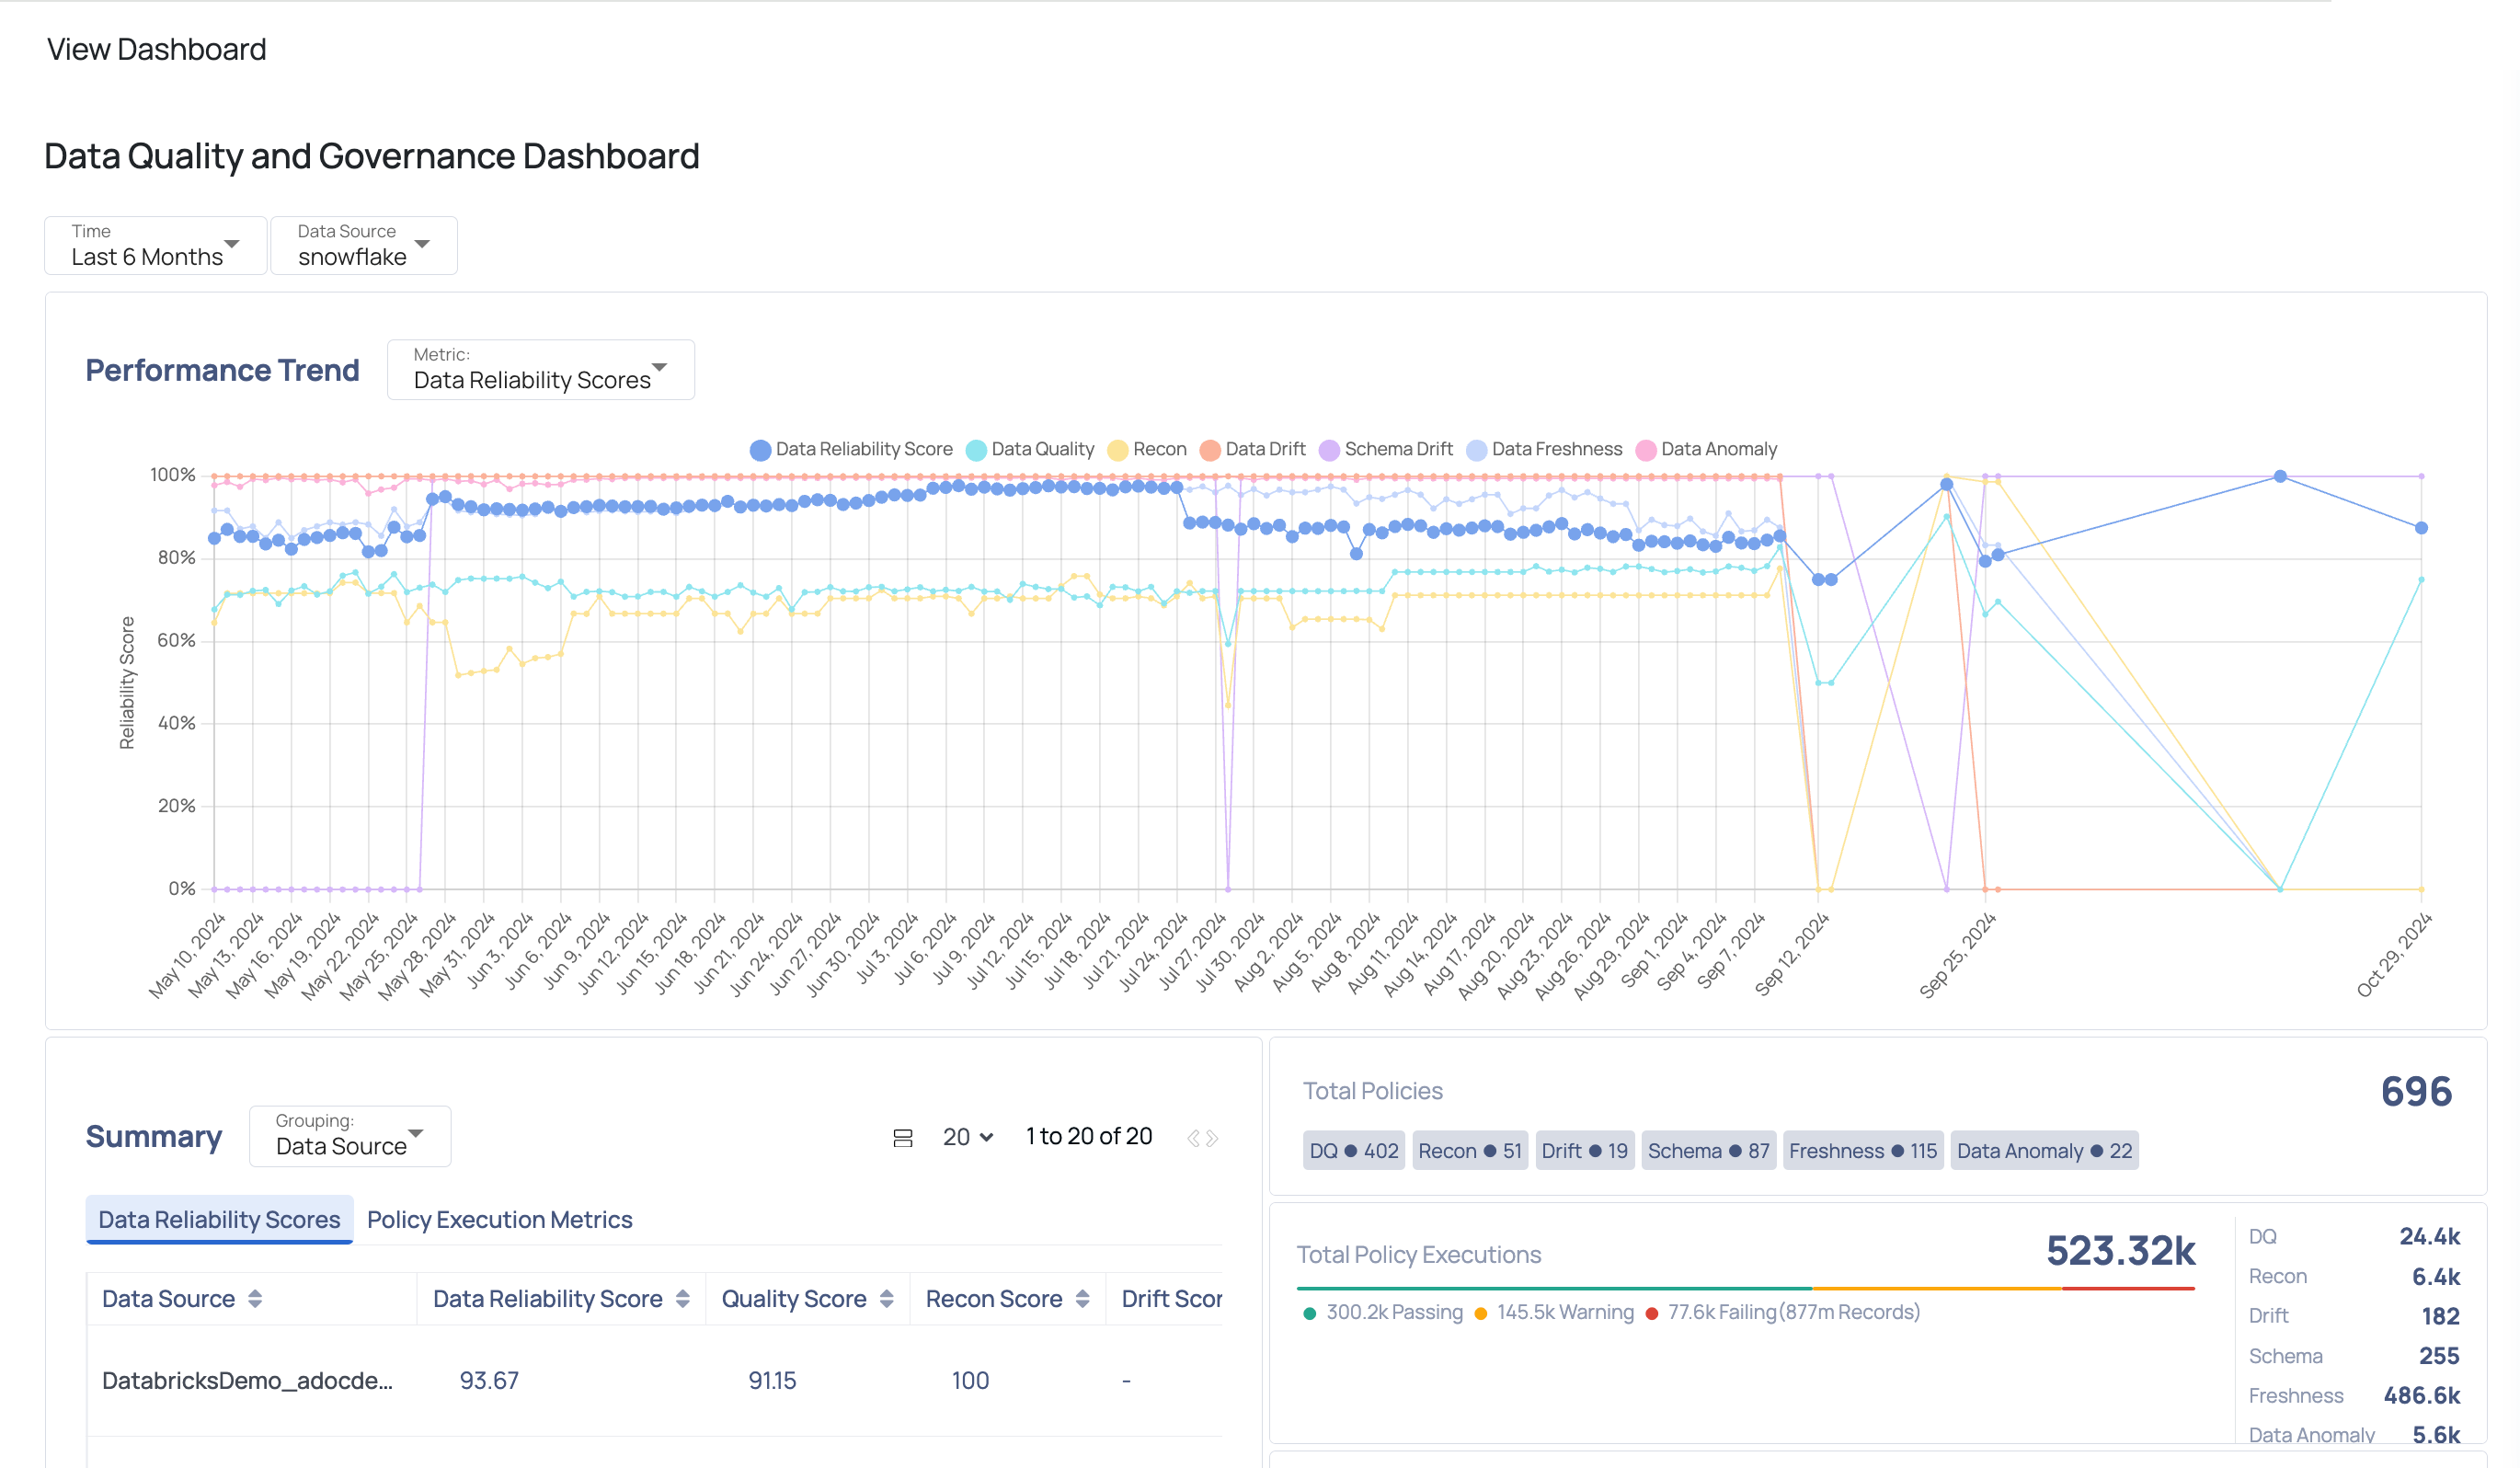
You can access a dashboard by clicking its name, which will take you to the View Dashboard page. Here, you can see all the widgets for that dashboard and filter widget information by Time and Data Source.
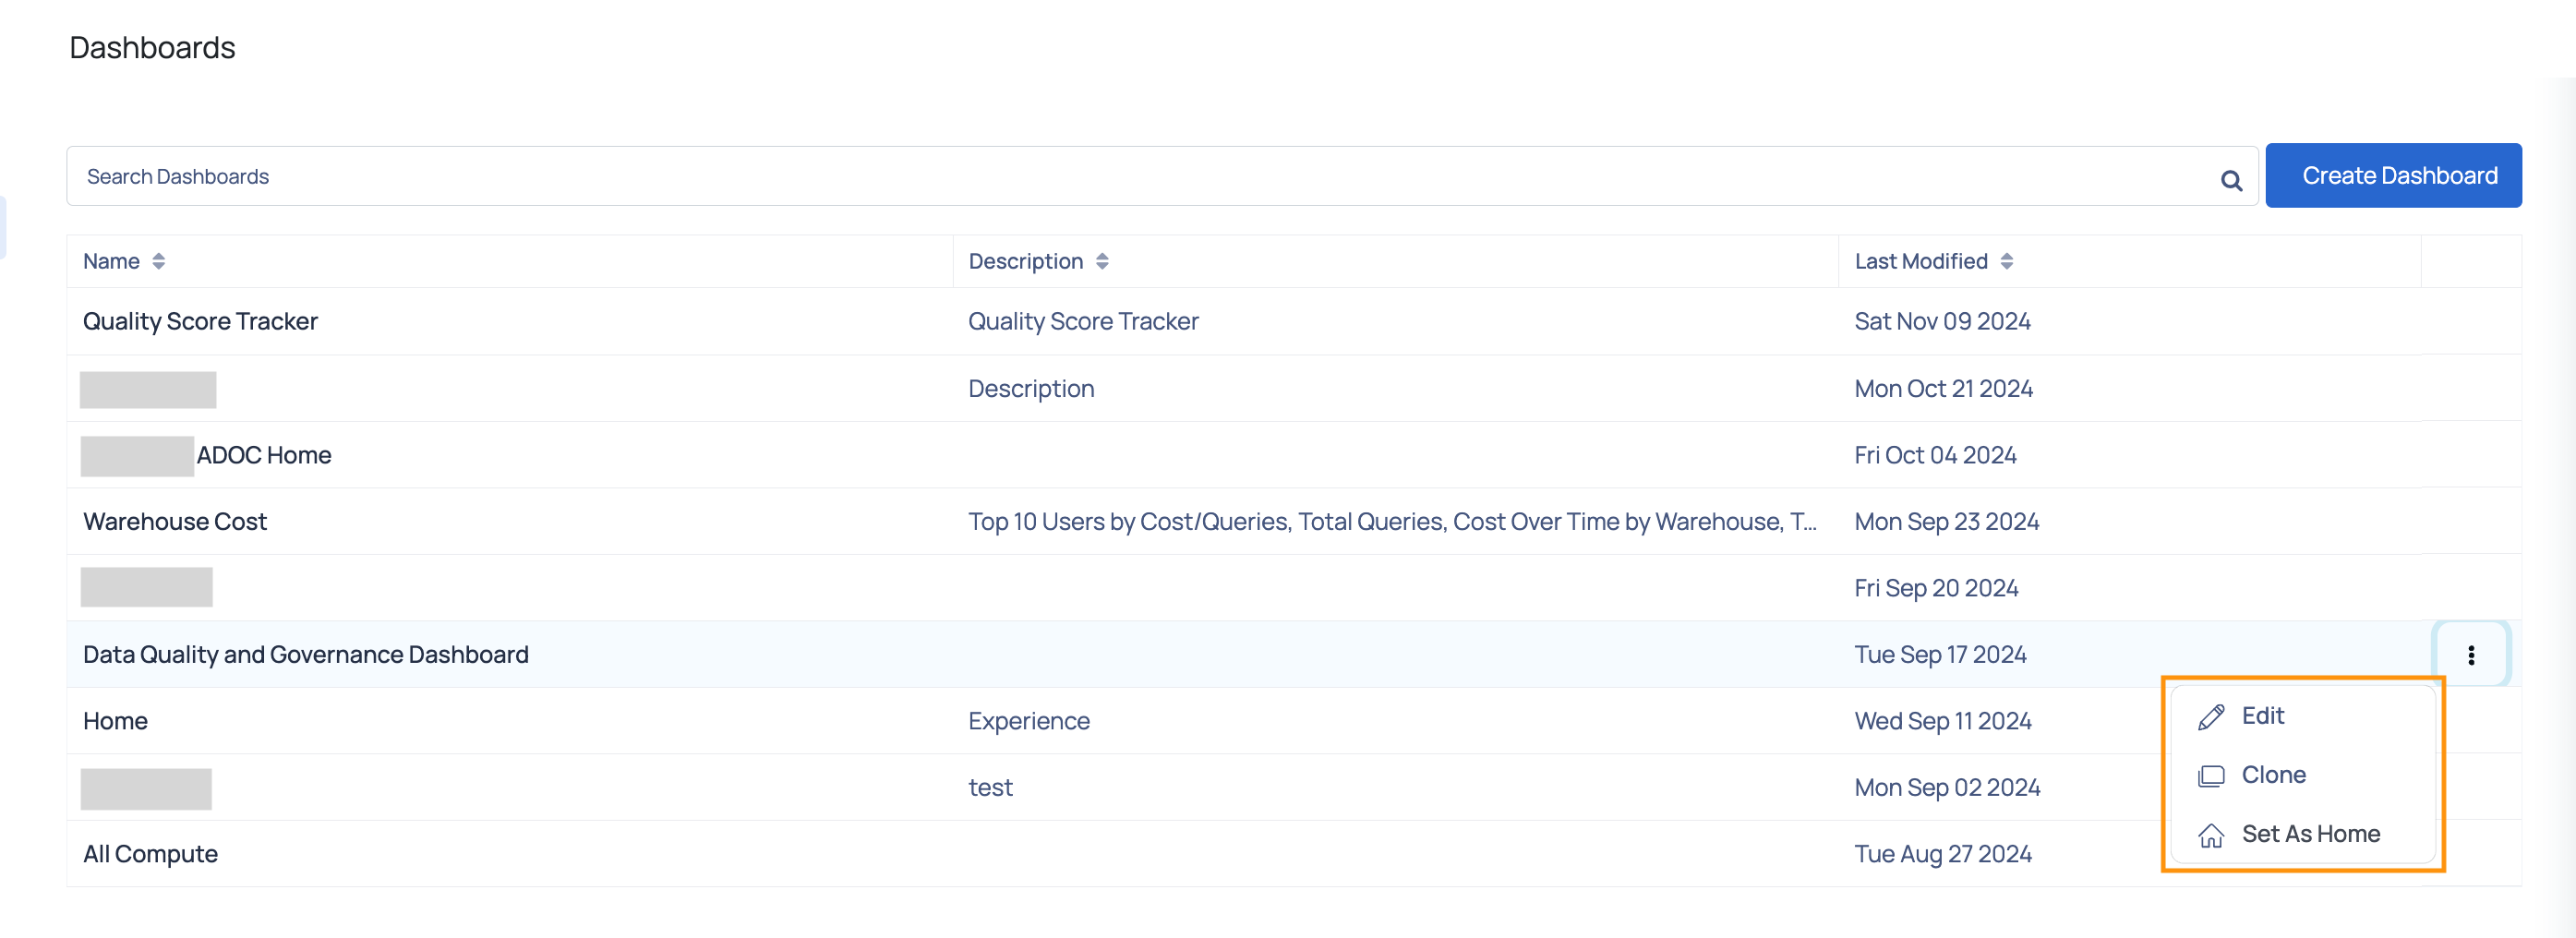
Dashboard Management Options
On the Dashboards page, you have several options for managing your dashboards. You can:
- Edit: Modify the dashboard’s widgets, layout, and settings to suit your needs.
- Clone: Create a duplicate of the dashboard. Useful for creating similar views with slight modifications.
- Delete: Remove the dashboard from your list, permanently eliminating it.
- Set As Home: Designate a dashboard as your default view. Provides quick access to your most important data.
By leveraging these enhancements, users can now create, customize, and manage dashboards with greater efficiency and ease. The introduction of default dashboards, improved widget metadata, widget filtering, and an upgraded Policy Execution Widget ensures a seamless dashboard experience, allowing users to gain valuable insights effortlessly.