ADOC Home
Upon successful sign-in to ADOC, you are immediately taken to the Home page, where you can explore an overview of Acceldata's capabilities and effortlessly navigate to specific dashboards or perform relevant actions.
If you are accessing ADOC for the first time, the Home page will not show any data. To start, click on Add Data Source .
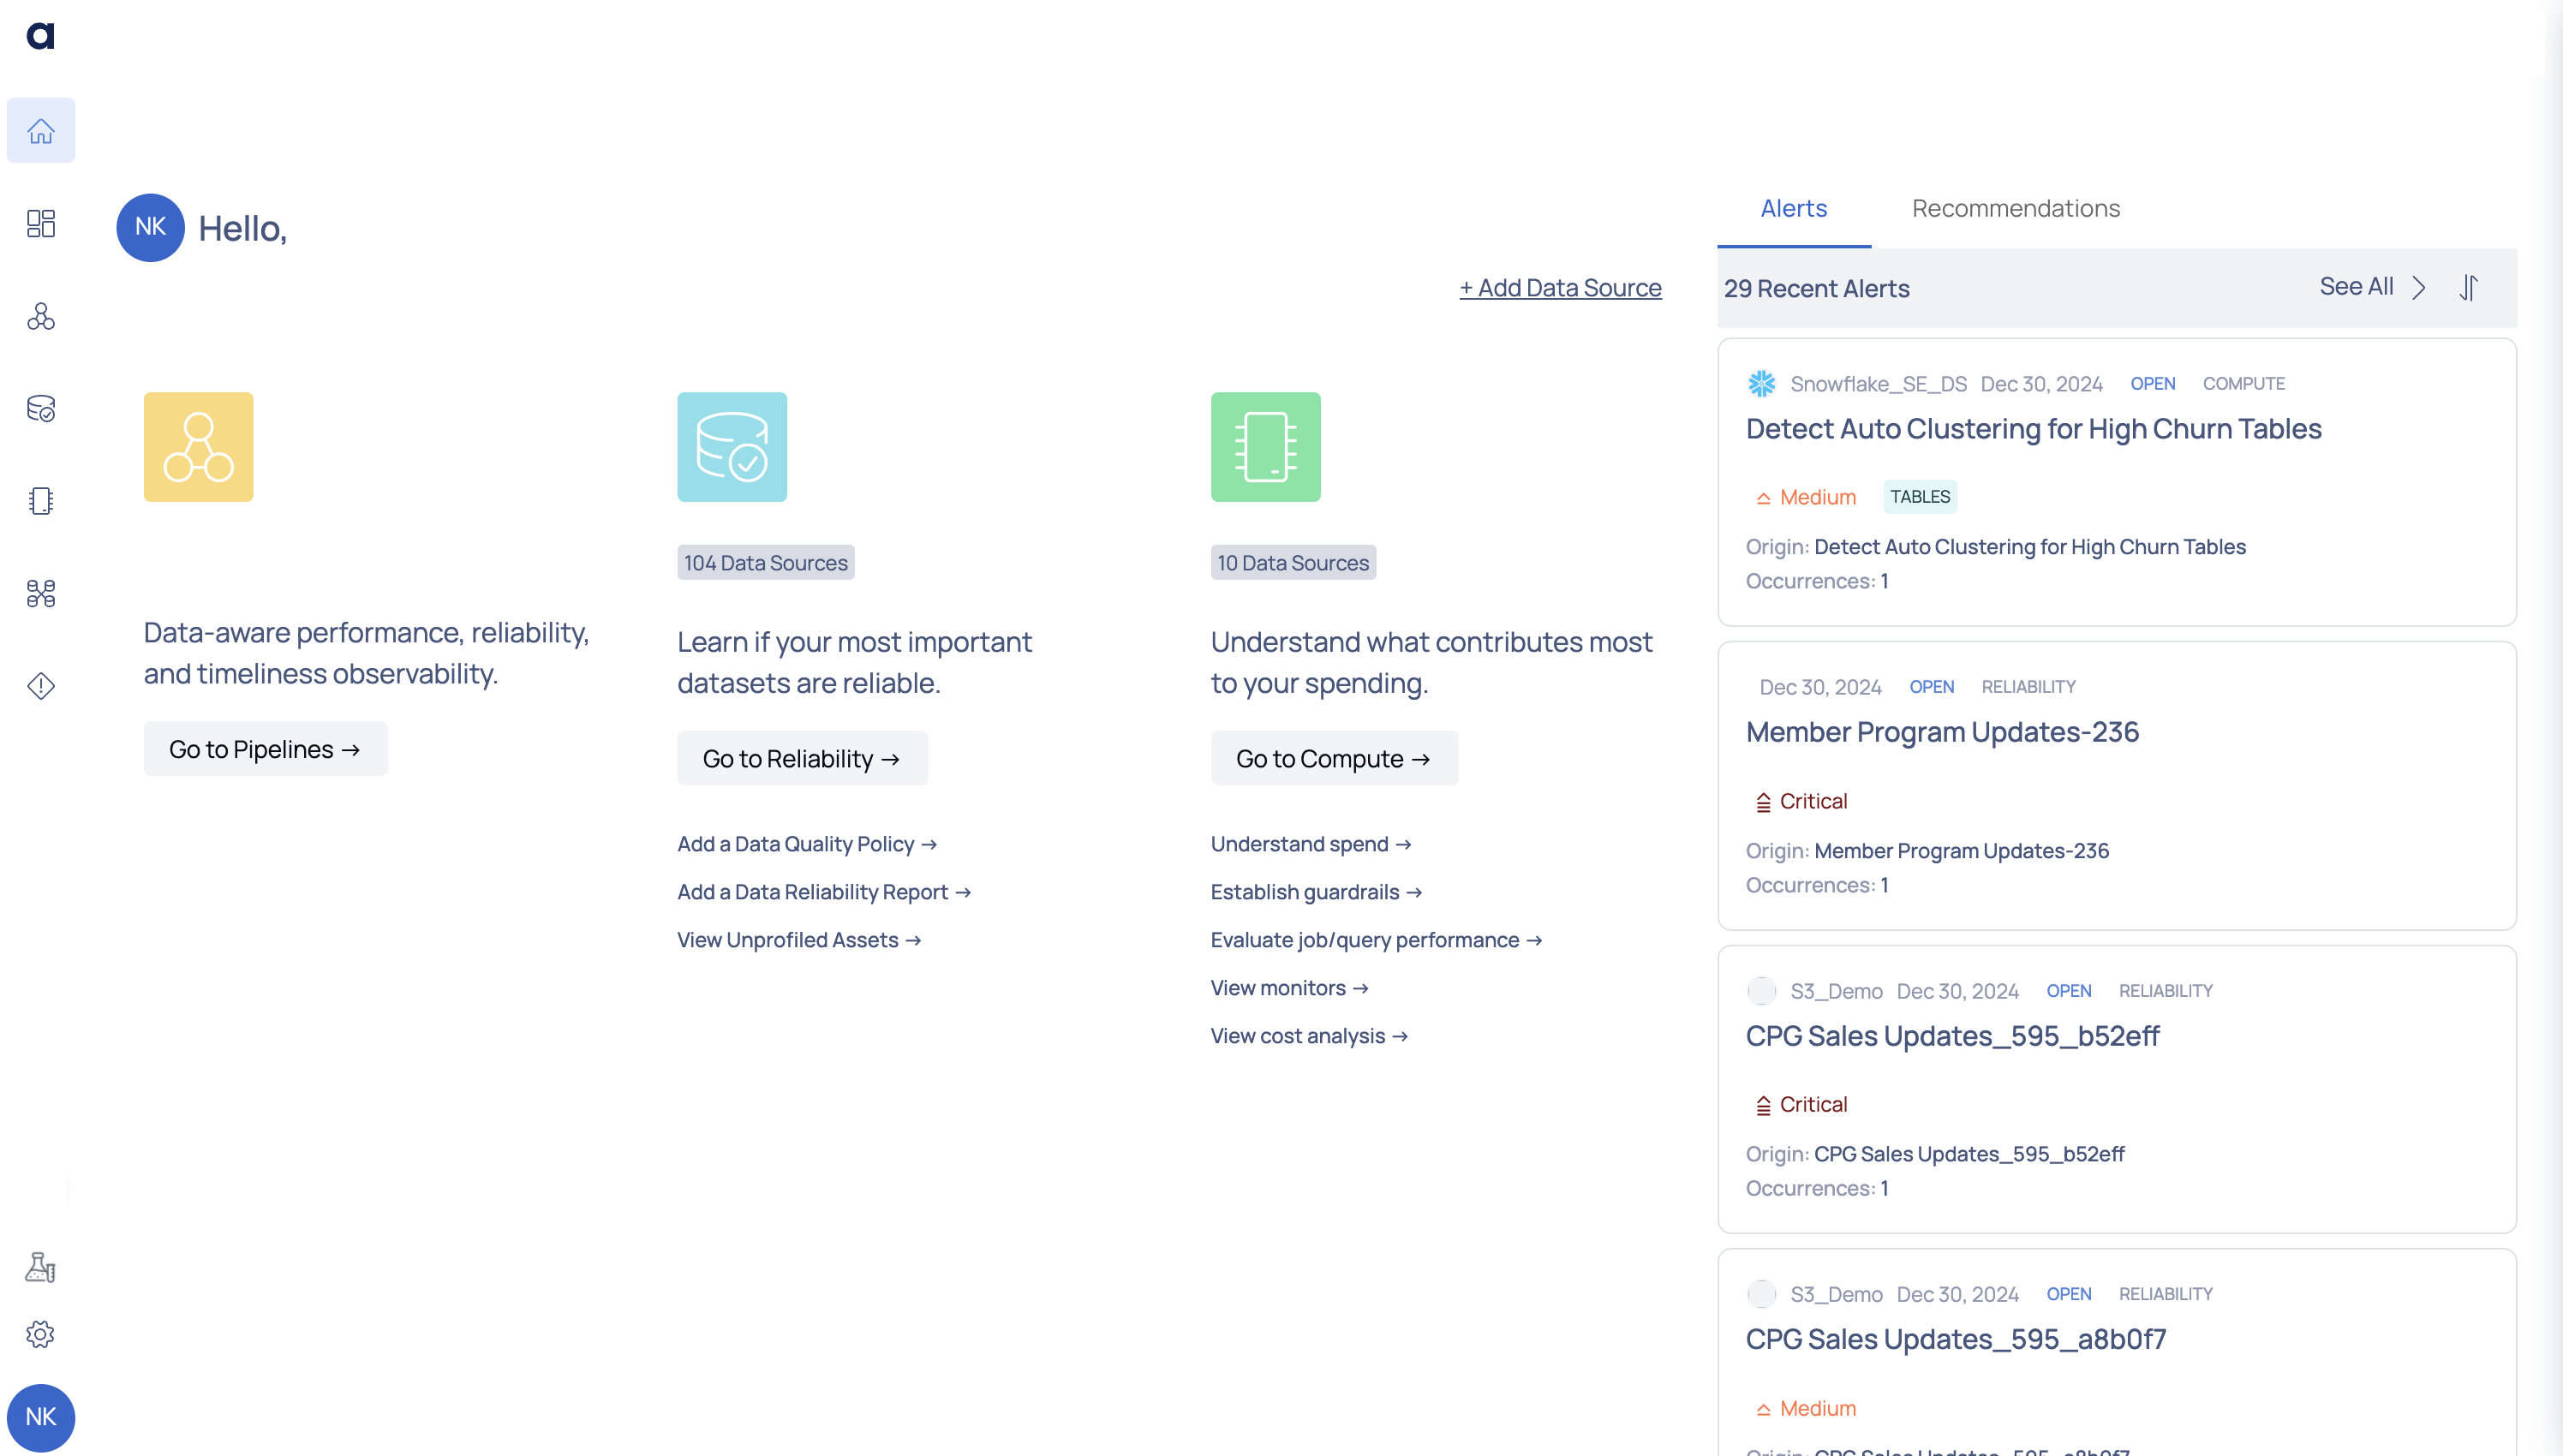
From here, you can view the following panels:
Compute
This capability allows you to take proactive control of costs to achieve maximum data ROI, optimize your expenditure, eliminate cost overruns, and allocate resources efficiently. You can also mitigate outages, streamline operations, and achieve operational excellence.
Clicking on the Go to Compute button navigates you to the Compute dashboard. To learn more about our compute capabilities, see Observe Snowflake documentation.
Within this panel, you can perform the following actions:
- Understand spend: Navigate to the Cost dashboard by clicking this link.
- Establish guardrails: Clicking this link displays a list of available data sources. Choose the desired data source to view its guardrails information.
- Evaluate job/query performance: Access a list of available data sources by clicking this link. Select the desired data source to evaluate its performance.
- View monitors: Clicking this link directs you to the Monitors List dashboard.
- View cost analysis: Access the Chargeback and Budget dashboard by clicking this link.
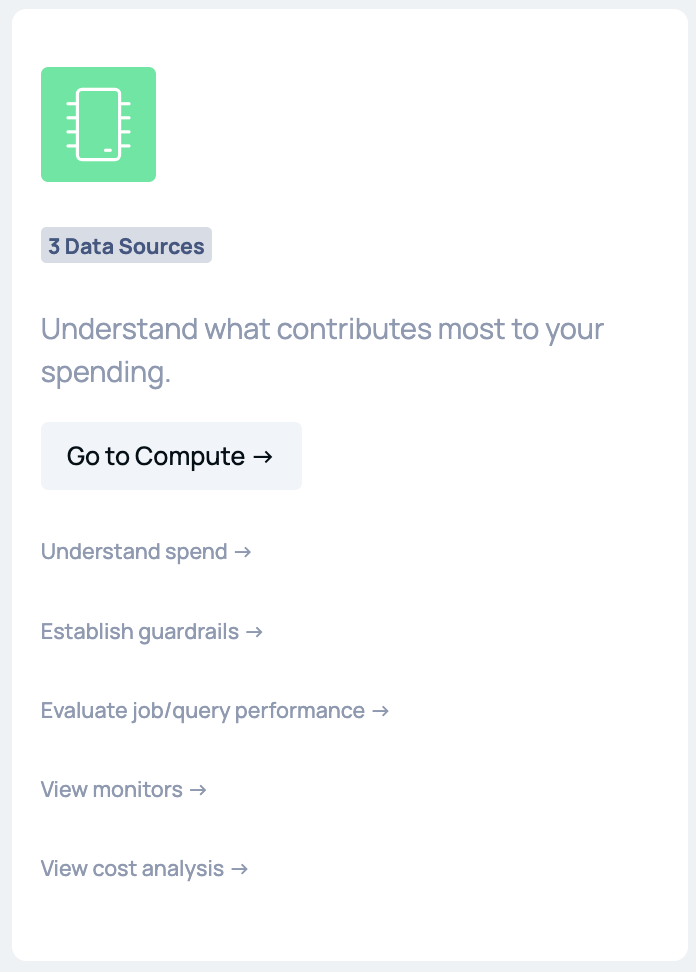
Compute Panel
Reliability
This capability ensures that you achieve optimal data quality and eliminate data outages. At the same time, you can gain comprehensive insights to identify, resolve, and proactively prevent data issues.
Clicking on the Go to Reliability button navigates you to the Reliability dashboard.
Within this panel, you can perform the following actions:
- Evaluate Data Reliability: Access the Data Reliability dashboard by clicking this link.
- View Unprofiled Assets: Navigate to the Unprofiled tab in the Discover dashboard to see all assets that haven't been profiled.
- Add a Data Quality Policy: Initiate the workflow to add a data quality policy by clicking this link.
- Add a Data Reliability Report: Visit the Report page by clicking this link.
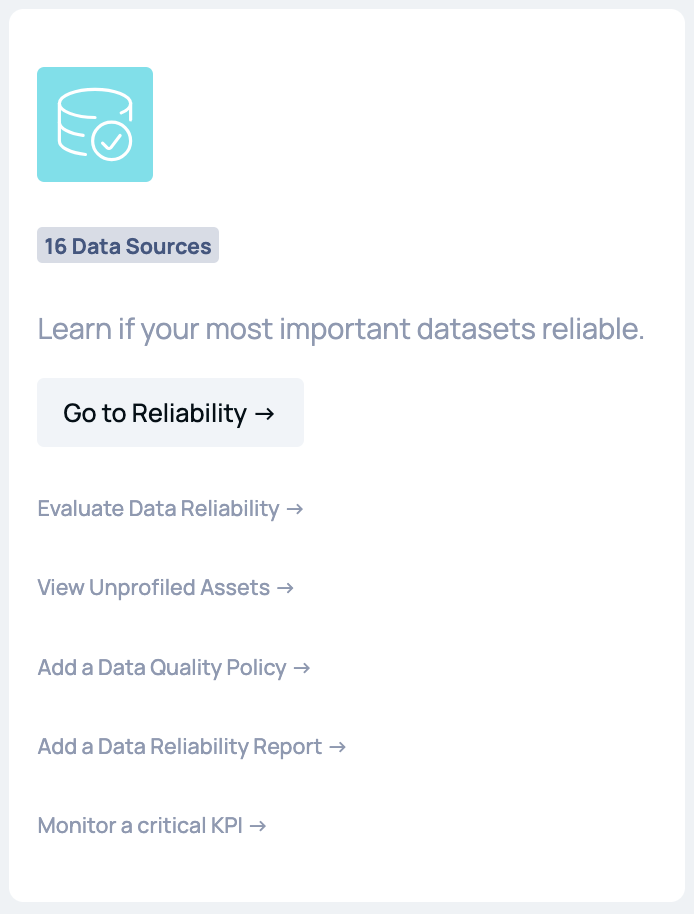
Reliability Panel
Pipelines
ADOC's pipeline monitoring feature allows you obtain end-to-end insights into your data and data pipelines. It provides comprehensive visibility into your data assets and pipelines from initiation to completion, ensuring accurate and timely delivery of data.
Clicking on the Go to Pipelines button navigates you to the Pipelines dashboard.
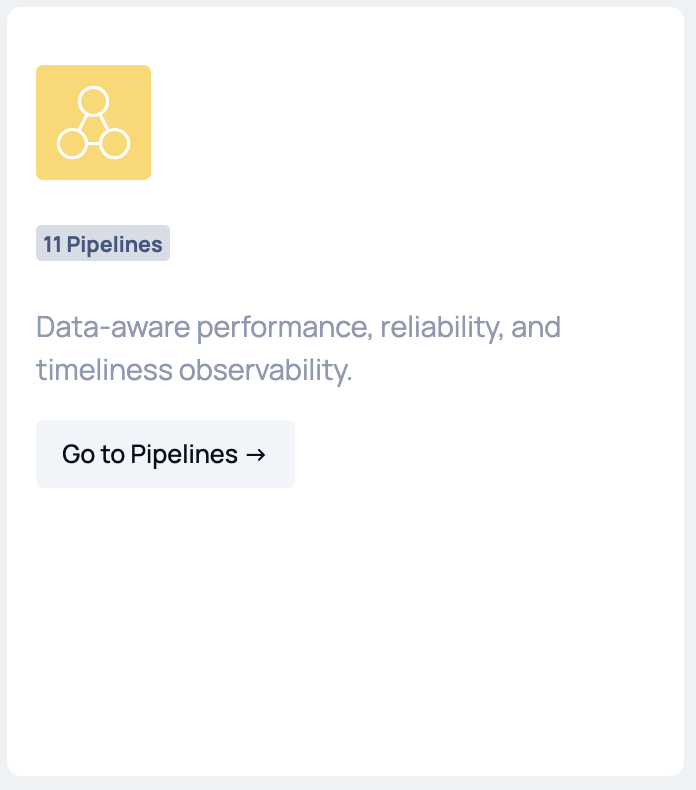
Pipelines Panel
Alerts
This panel displays the most recent alerts to notify you about any unusual or unexpected data activity. They are triggered in response to predefined criteria or thresholds that indicate deviations from expected patterns.
Click See All to proceed to the Alerts page where you can view the list of all alerts raised.
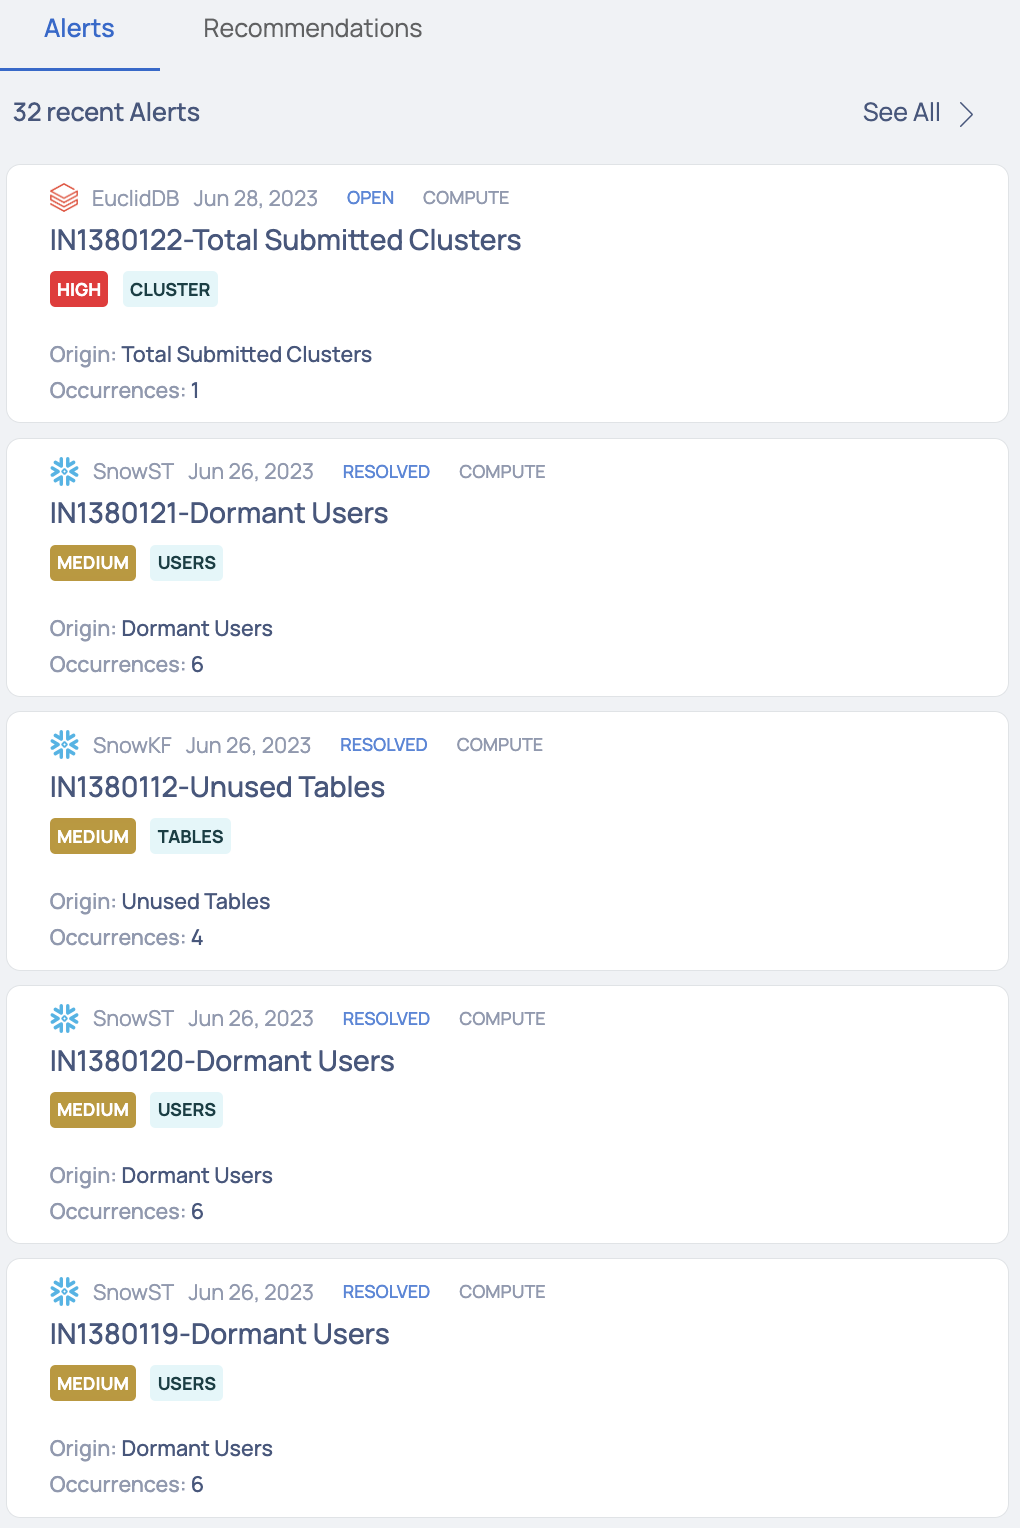
Alerts Panel
Recommendations
The Recommendations tab displays the recent recommendations provided to you as a user by ADOC. The recommendations are applicable for Snowflake and Databricks data sources. For more information, see Acceldata Recommendations.
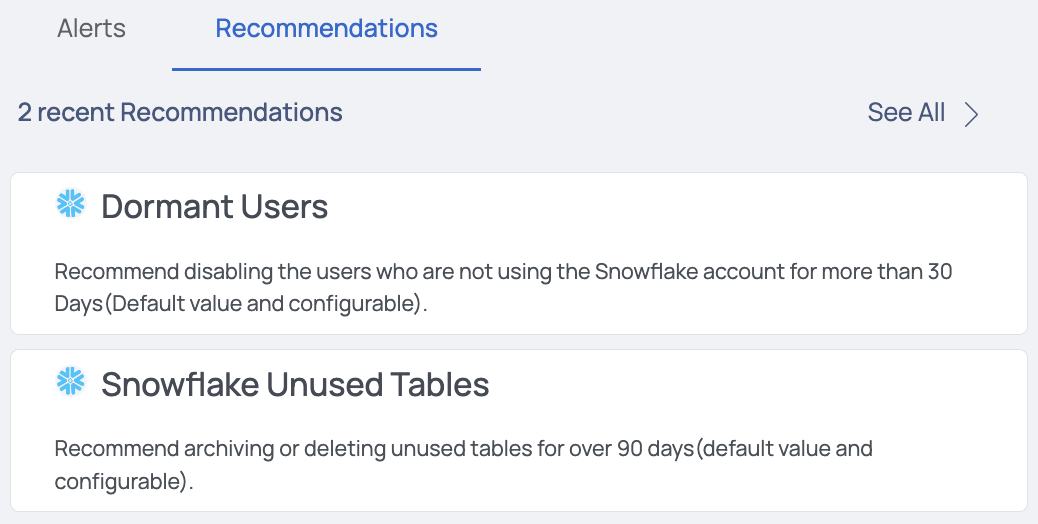
Recommendations Panel