Dataplane Observability Dashboard
Data Observability from ADOC gives a complete picture of data health and system performance throughout your data ecosystem. Real-time monitoring of data pipelines, databases, and infrastructure lets you immediately spot data quality concerns, performance bottlenecks, and system breakdowns. ADOC provides transparency and control over data operations with intuitive dashboards and extensive metrics, ensuring data reliability and system efficiency.
Cluster
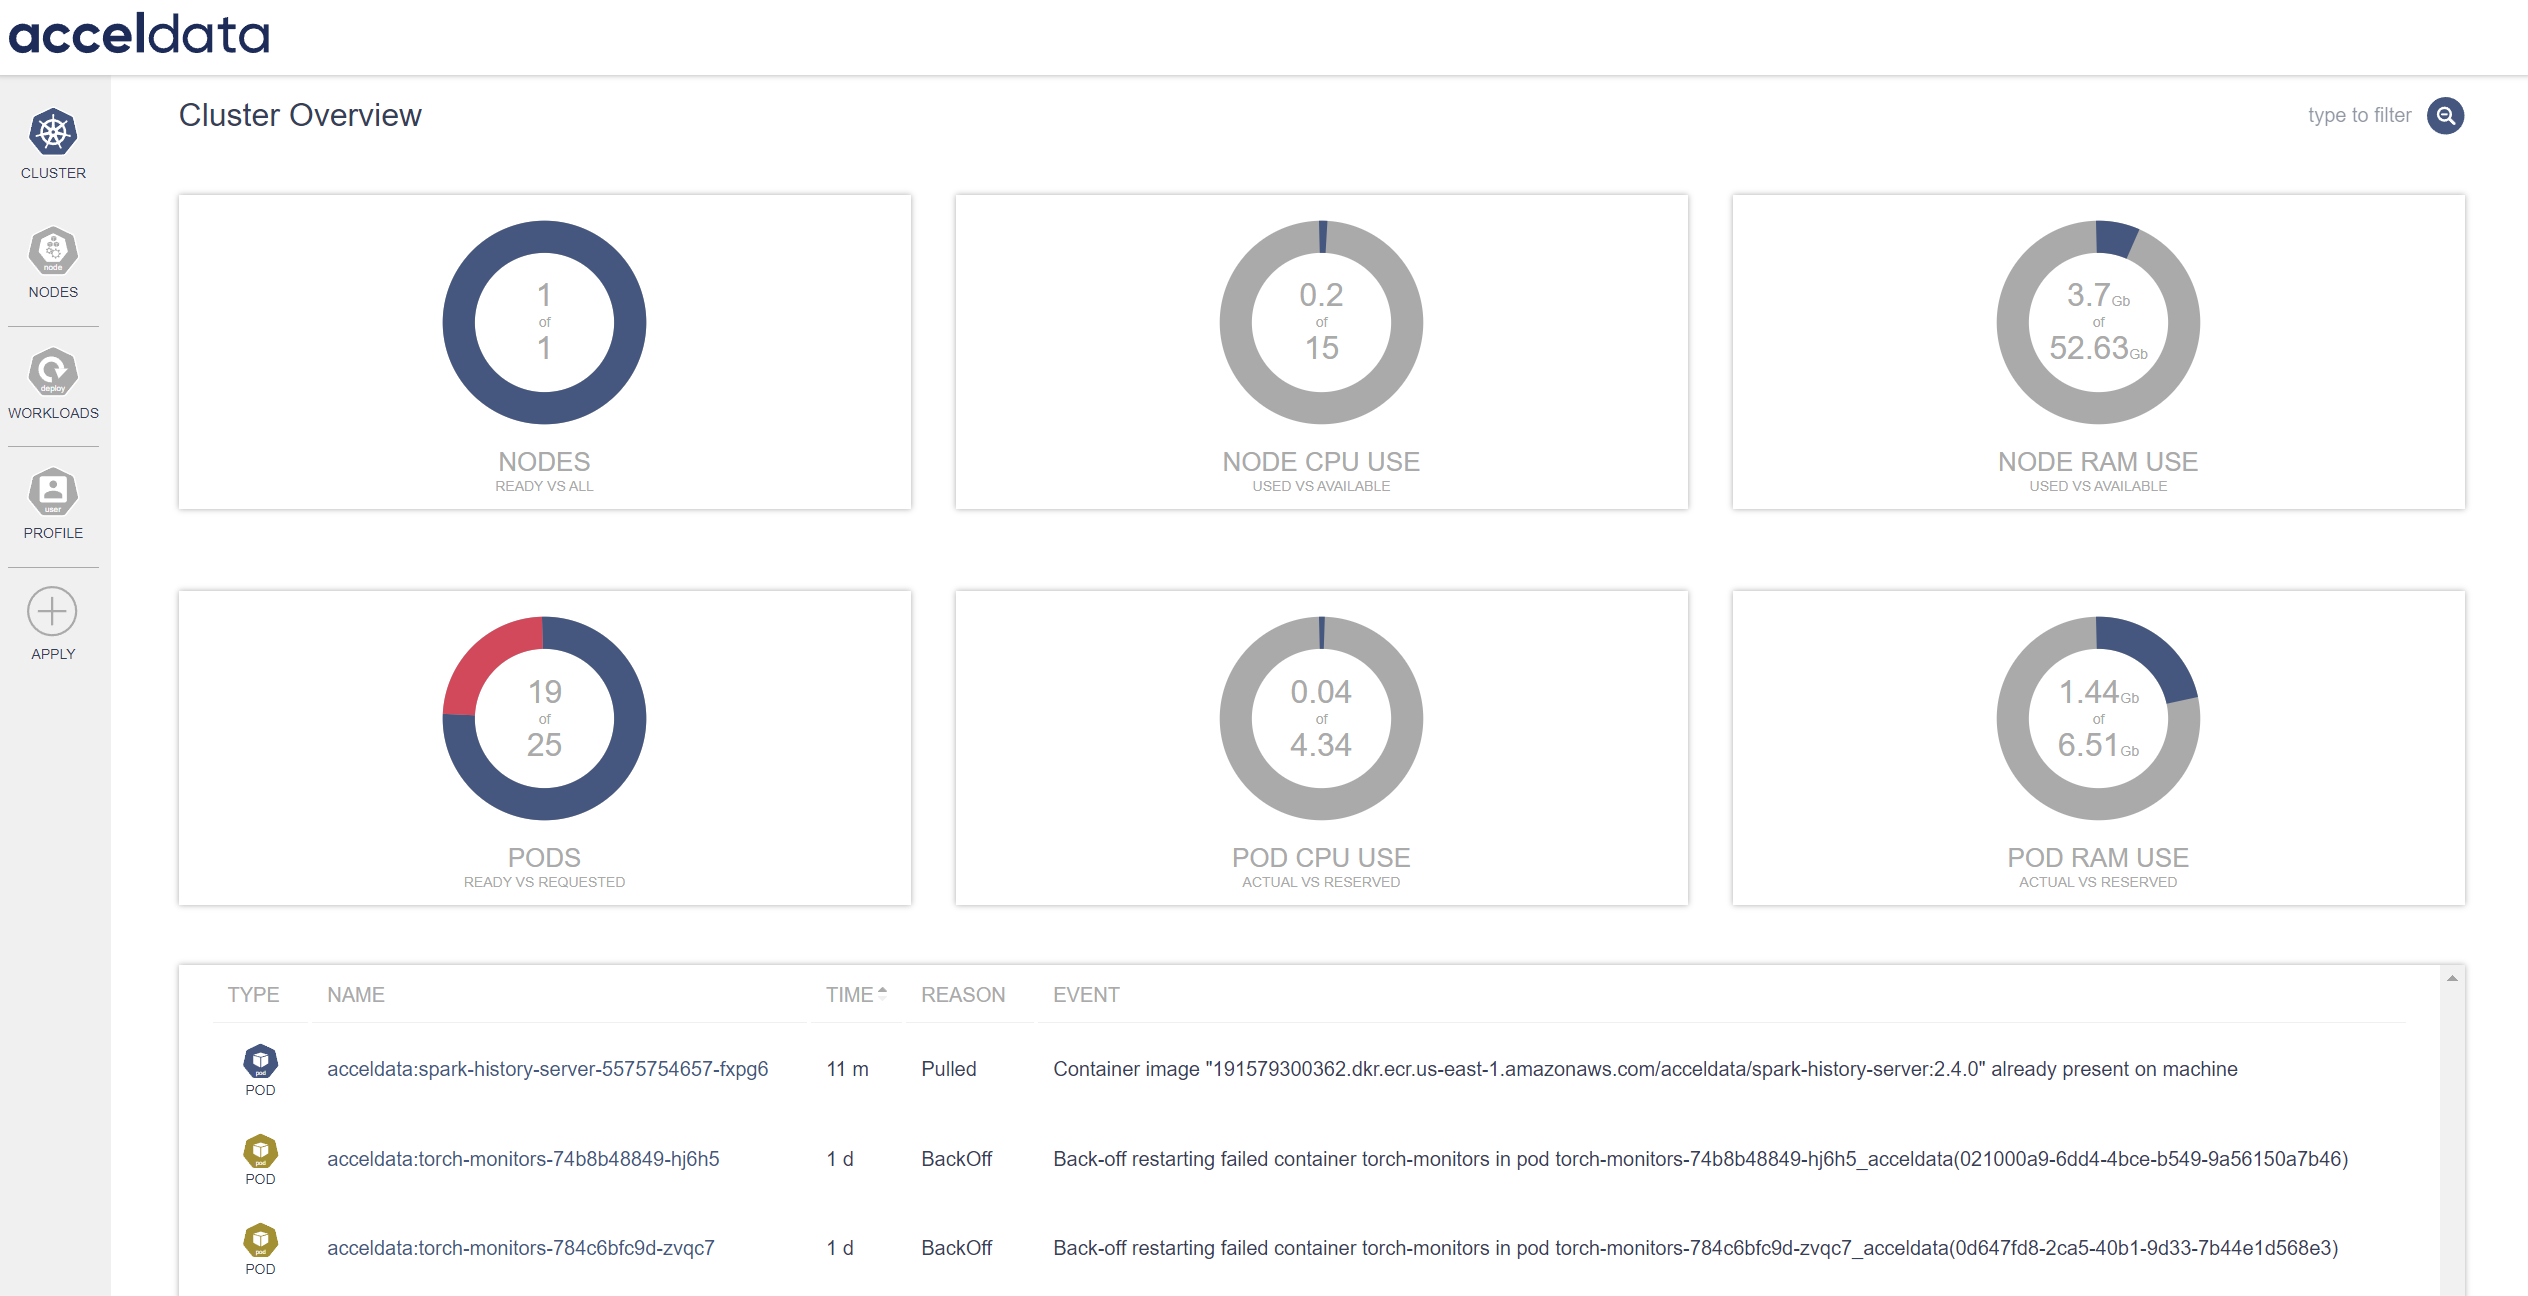
The Cluster Monitoring interface displays an overview of the cluster's current state, including node readiness, resource consumption, and pod status. It is intended to provide system administrators and data engineers with a fast overview of the system's health and performance.
Cluster Overview
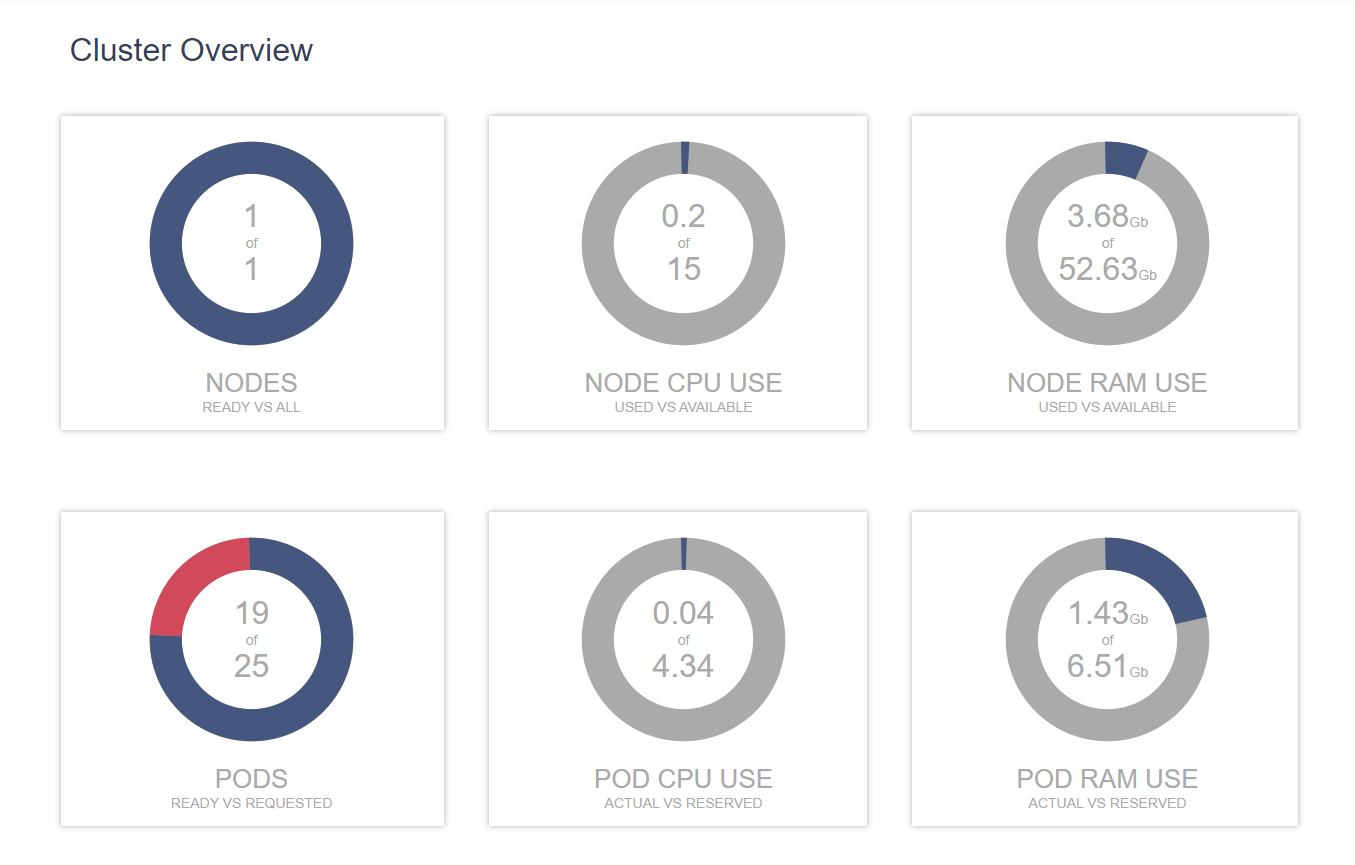
| Gauge | Description |
|---|---|
| Nodes Ready vs. All | This gauge compares the number of ready nodes to the total number of nodes in the cluster. The graph shows that one out of one nodes is ready, suggesting that the cluster is fully operational. |
| Node CPU Use (Used vs. Available) | Displays the amount of CPU resources currently being used against the total available on the node. The graph shows 0.2 out of 15 CPU units are in use, suggesting the node is under minimal CPU load. |
| Node RAM Use (Used vs. Available) | Indicates the amount of RAM utilized compared to the total available on the node. The graph shows 3.7GiB out of 52.63GiB RAM are in use, signifying a low memory utilization. |
| Pods Ready vs. Requested | Compares the number of ready pods to the number of pods needed for the cluster's workloads. Based to the graph, 19 of 25 pods are ready, implying that some pods are still in the initialization phase or are having problems reaching the ready state. |
| Pod CPU Use (Actual vs. Reserved) | It compares the actual CPU utilization of pods to the CPU resources reserved for them. The graph shows that pods are now using 0.04 of the 4.34 CPU units available, showing low CPU utilization in comparison to what is reserved. |
| Pod RAM Use (Actual vs. Reserved) | Reflects pods' actual RAM utilization as comparison to the RAM reserved for them. The graph shows, pods use 1.44GiB of the 6.51GiB RAM, indicating that pods are only consuming a small amount of the reserved memory. |
Event Logs
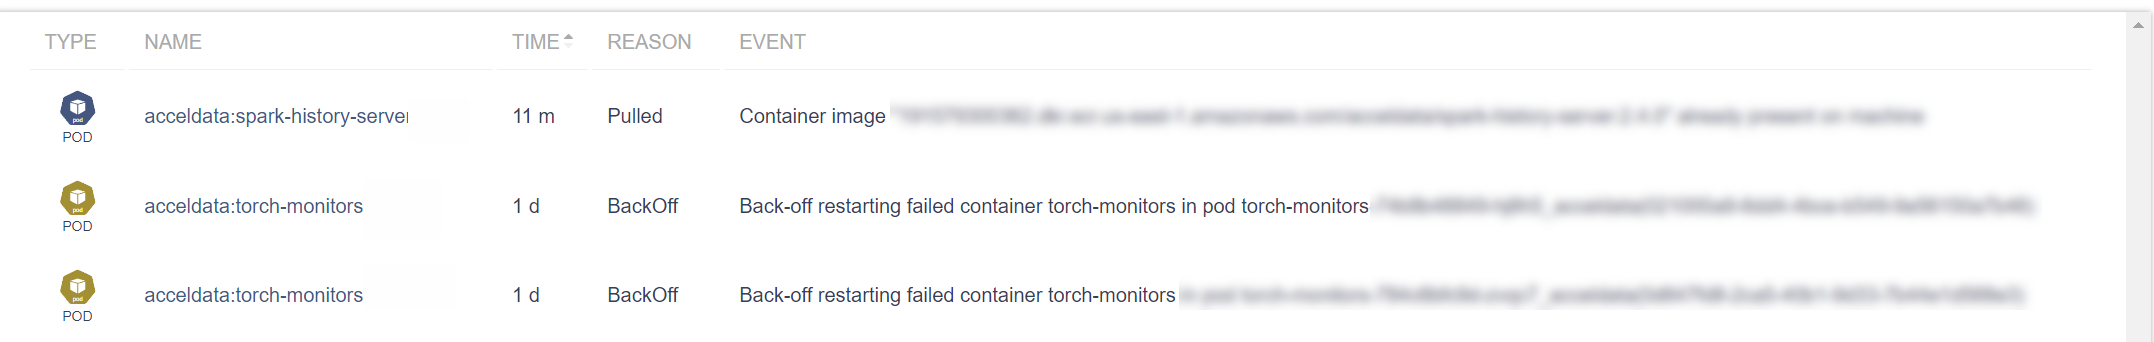
| Field | Description |
|---|---|
| Type | Provides the type of resource related to the event. (e.g., POD). |
| Name | The unique identifier for the resource. (e.g., acceldata:spark-history) . Click on the name to view the details. |
| Time | Timestamp indicating how long ago the event occurred (e.g., 1m, 1d). |
| Reason | A short description of why the event was triggered (e.g., Scheduled, BackOff). |
| Event | A detailed description of the event. For instance, the pulling of a container image or the back-off restarting of a failed container. |
Nodes
Node Monitoring allows users to assess the health and performance of individual nodes within their Kubernetes clusters.
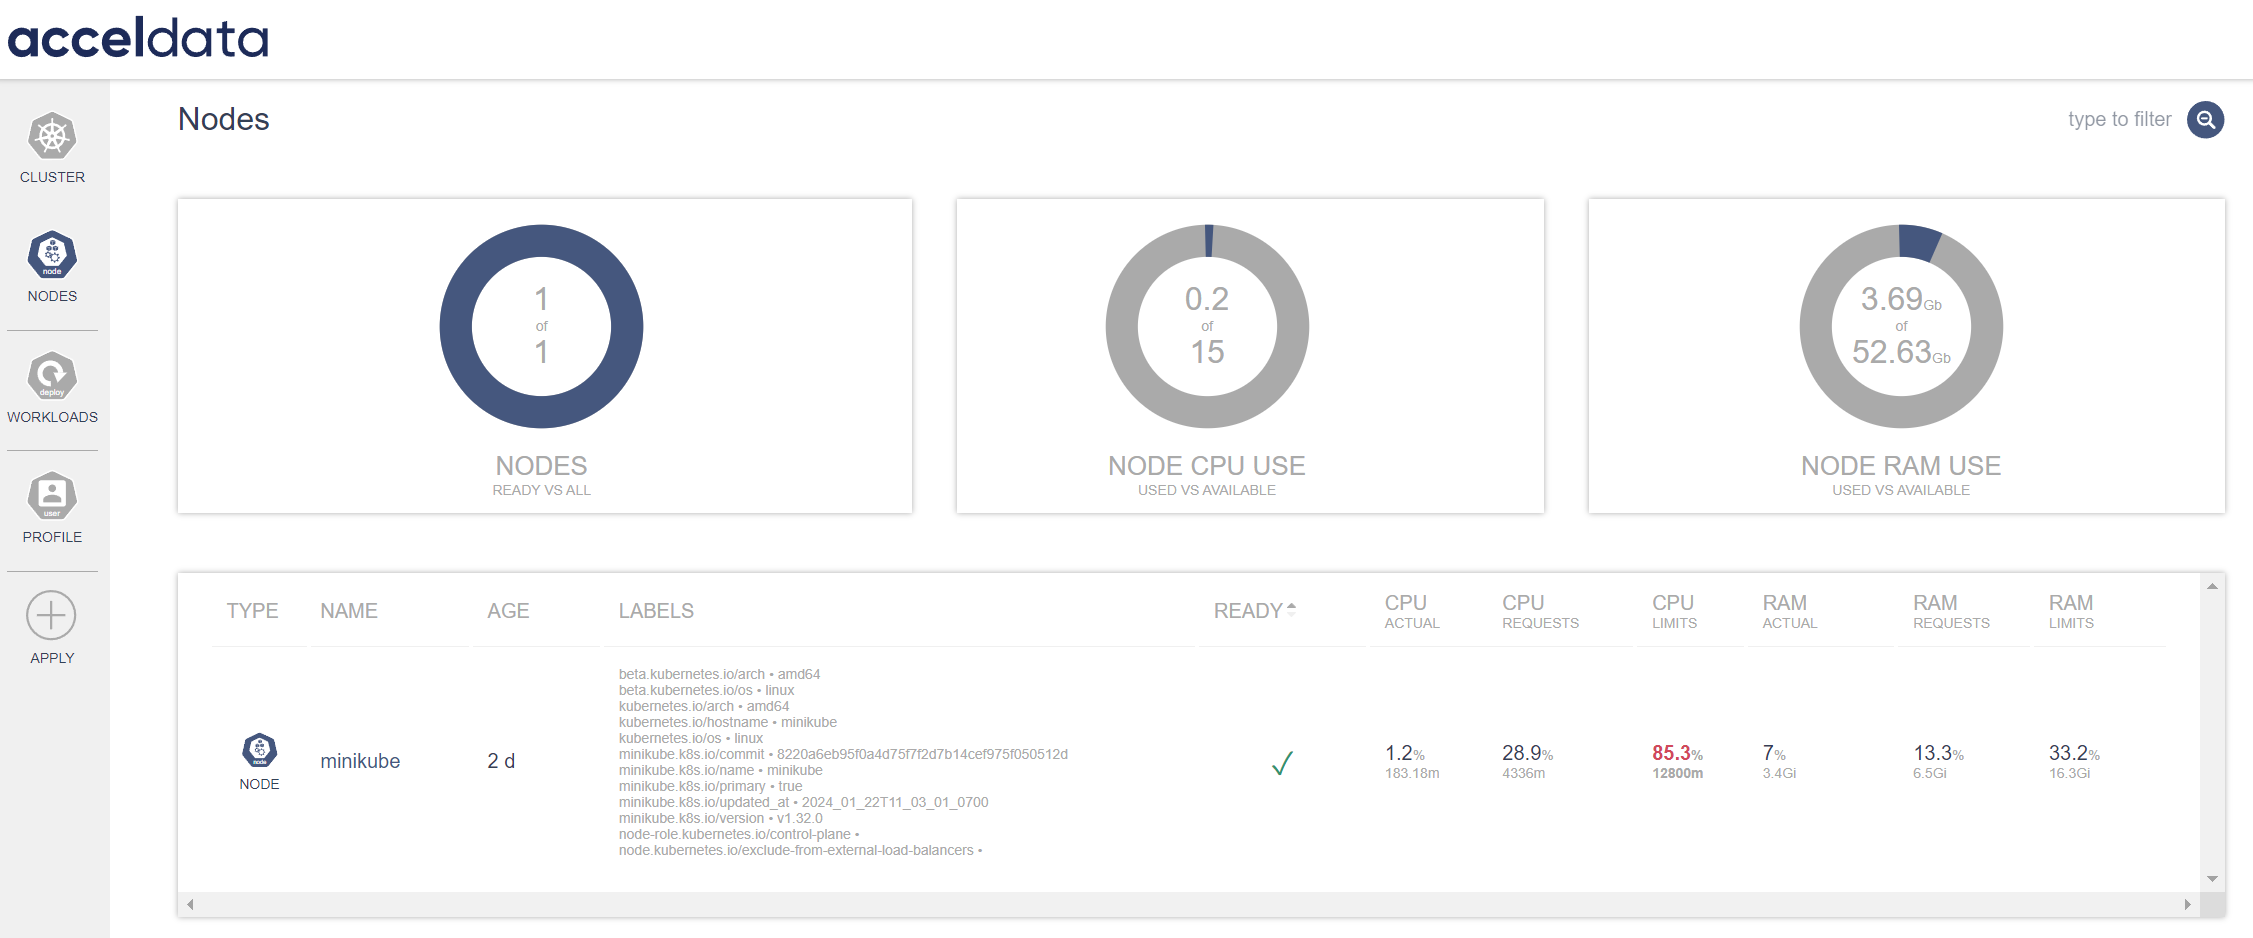
| Gauge | Description |
|---|---|
| Nodes (Ready vs. All) | This gauge compares the number of ready nodes to the total number of nodes in the cluster. The graph shows that one out of one nodes is ready, suggesting that the cluster is fully operational. |
| Node CPU Use (Used vs. Available) | Displays the amount of CPU resources currently being used against the total available on the node. The graph shows 0.2 out of 15 CPU units are in use, suggesting the node is under minimal CPU load. |
| Node RAM Use (Used vs. Available) | Indicates the amount of RAM utilized compared to the total available on the node. The graph shows 3.7GiB out of 52.63GiB RAM are in use, signifying a low memory utilization. |
| Field | Description |
|---|---|
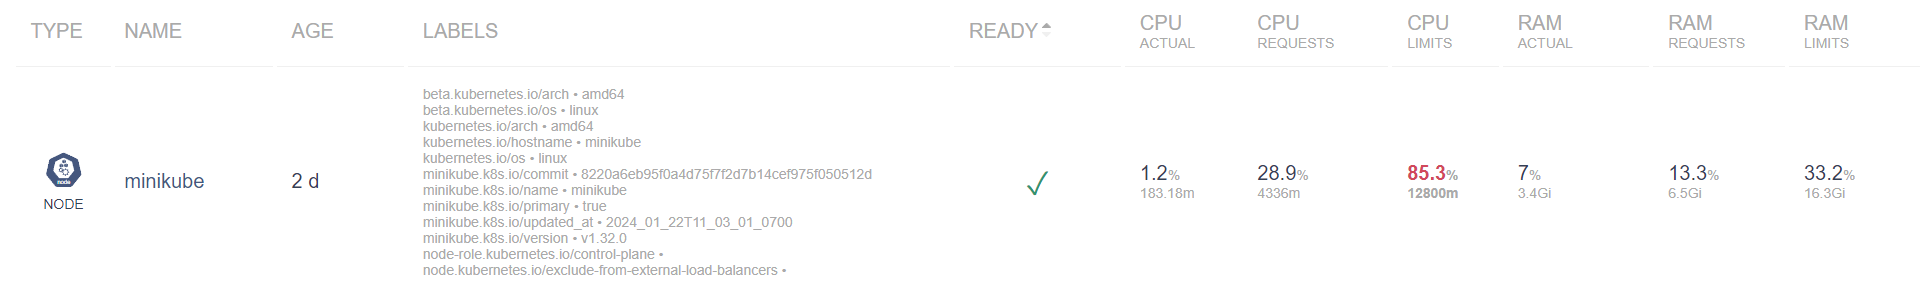
| Detailed Node Information | |
| Name | Displays the name of the node, such as minikube. Click on the name to view the details. |
| Age | Displays the length of time since the node was initiated, with this example being 2 days. |
| Labels | Provides metadata labels associated with the node, which can include architecture, OS, and specific Kubernetes configurations like version and role. |
| Node Performance Statistics | |
| Ready | Indicates if the node is ready for tasks with a checkmark representing readiness. |
| CPU Actual | Displays the actual CPU use as a percentage and in millicores (m), which is now 1.2% or 183.18m. |
| CPU Requests | Depicts the percentage of CPU requested by workloads on this node, in this case, 28.9% or 4336m. |
| CPU Limits | Reflects the maximum CPU limit set for the workloads, shown here as 85.3% or 12800m. |
| RAM Actual | Displays the actual RAM usage as a percentage and in GiB, which is 7% or 3.4GiB. |
| RAM Requests | Indicates the percentage of RAM requested by workloads, here 13.3% or 6.5GiB. |
- Use the search functionality to swiftly sort through node-specific metrics and logs.
- Monitor and evaluate node performance to identify resource bottlenecks and scale resources appropriately.
- The node overview helps with capacity planning and operational efficiency in Kubernetes systems.
Workloads
This functionality is critical for tracking the state and health of the various workloads, allowing for efficient resource allocation and troubleshooting.
| Gauge | Description |
|---|---|
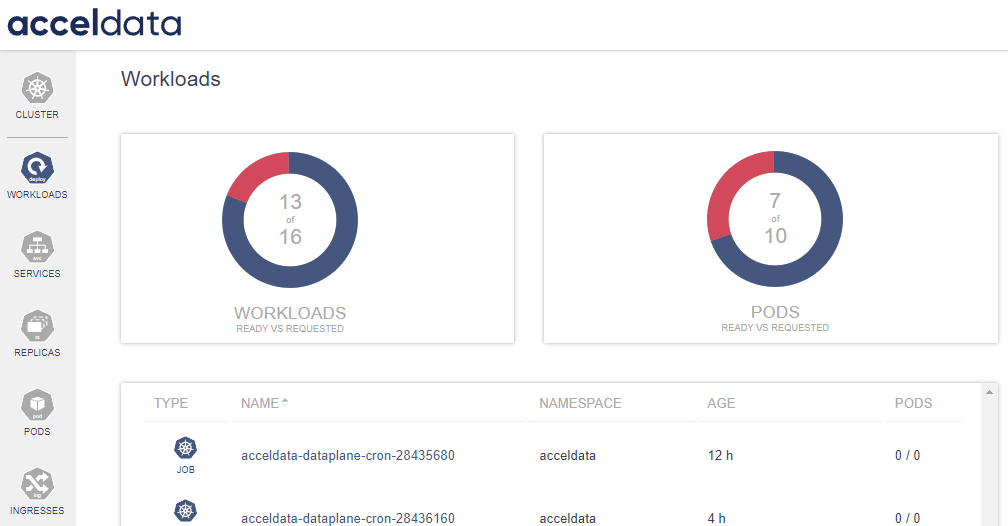
| Workloads (Ready vs. Requested) | This metric showcases the number of workloads that are ready for operation against the total number of workloads that have been requested. As displayed in the graphic, 13 of the 16 requested workloads are ready, implying that some workloads are still initializing or having problems. |
| Pods (Ready vs. Requested) | Reflects the readiness of pods, which are the smallest deployable units in a Kubernetes environment. The chart displays that 7 out of 10 requested pods are ready, implying that a few pods are not yet in a ready state. |
| Field | Description |
|---|---|
| Type | Defines whether the workload is a Job, Deployment. |
| Name | Specifies the name of the workload. Click on the name to view the details. |
| Namespace | Indicates the namespace within which the workload resides, which can be used for organizational purposes. |
| Age | Shows how long the workload has been running. |
| Pods | Displays the pod count associated with the workload, showing both the current and desired state, such as 0/0. |
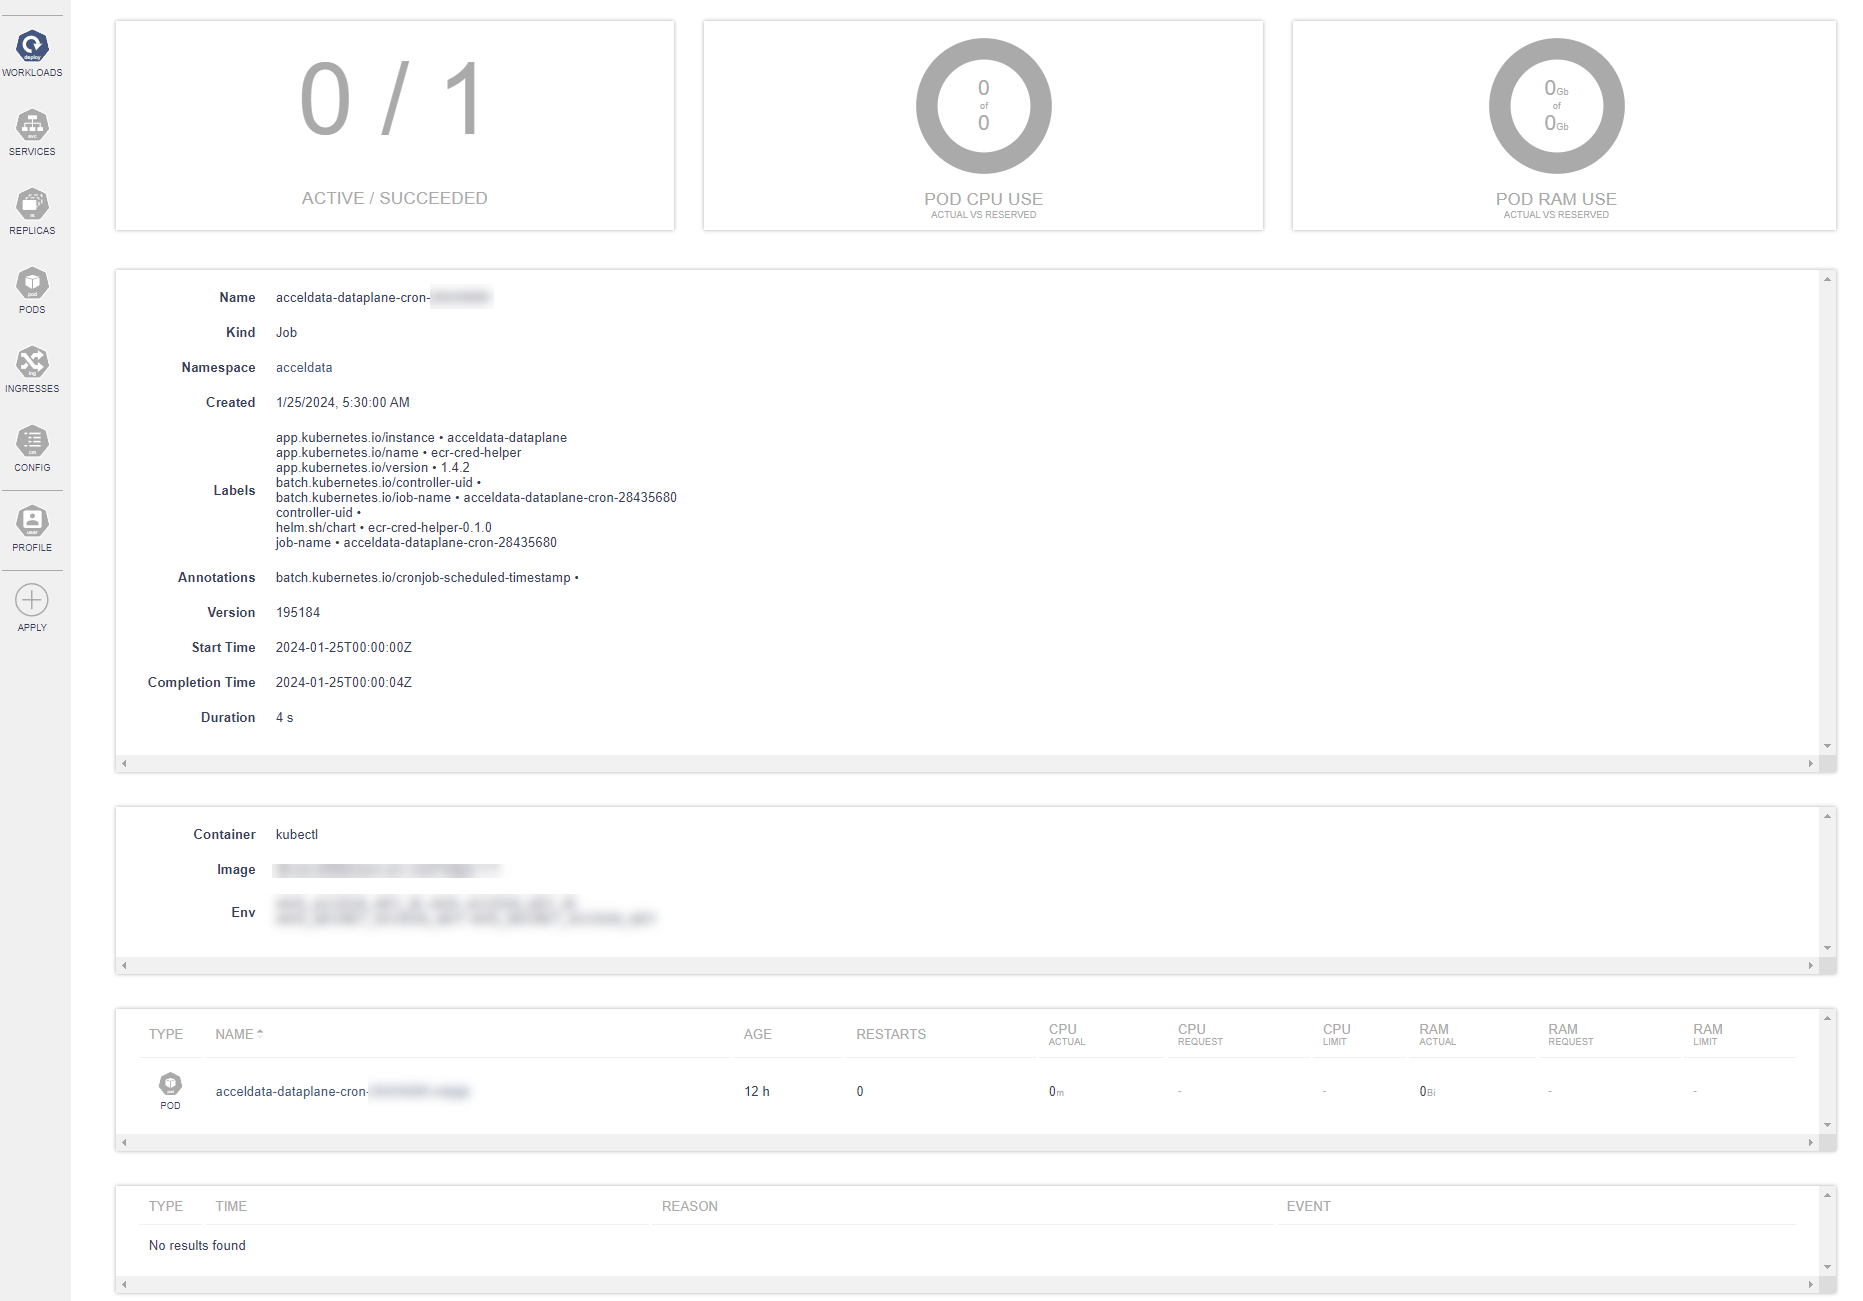
Clicking Name displays job details.
Services
The dashboard provides users with a comprehensive view of all the services within their system, enabling efficient monitoring, management, and observability of service status and performance in real-time.
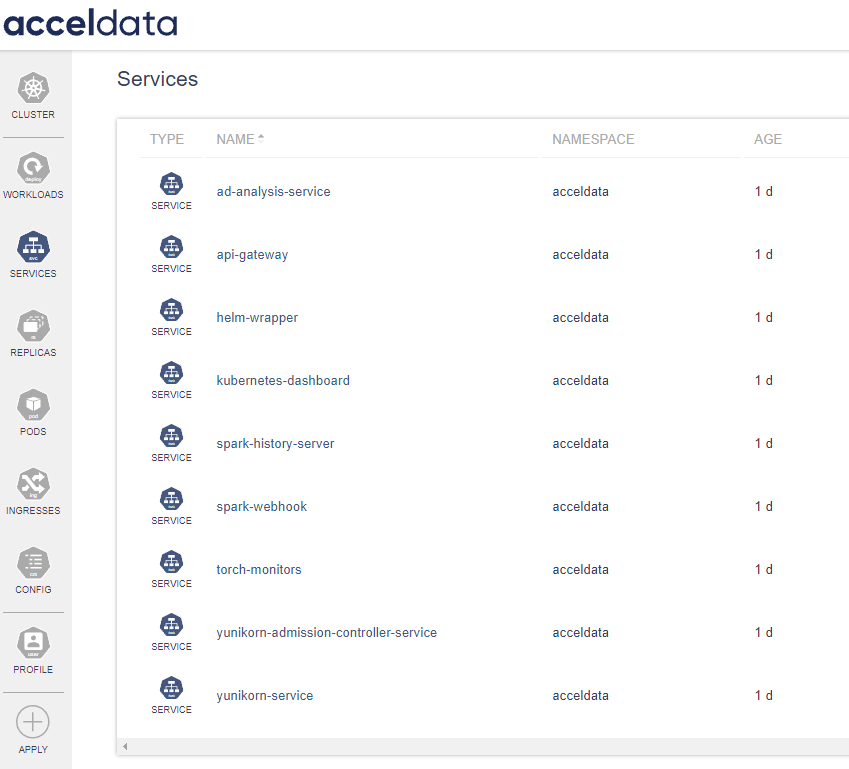
This functionality provides an at-a-glance view of all services running within the environment. Each service is listed with its corresponding namespace and the time since it has been deployed or running.
| Field | Description |
|---|---|
| Type | Identifies the service type. |
| Name | Lists the service name, aiding in the identification and management of different services. Click on the name to view the details. |
| Namespace | Displays the namespace to which the service belongs, centralizing resource management within the platform. |
| Age | Indicates the service's uptime or age, providing insights into the service stability and lifecycle management. |
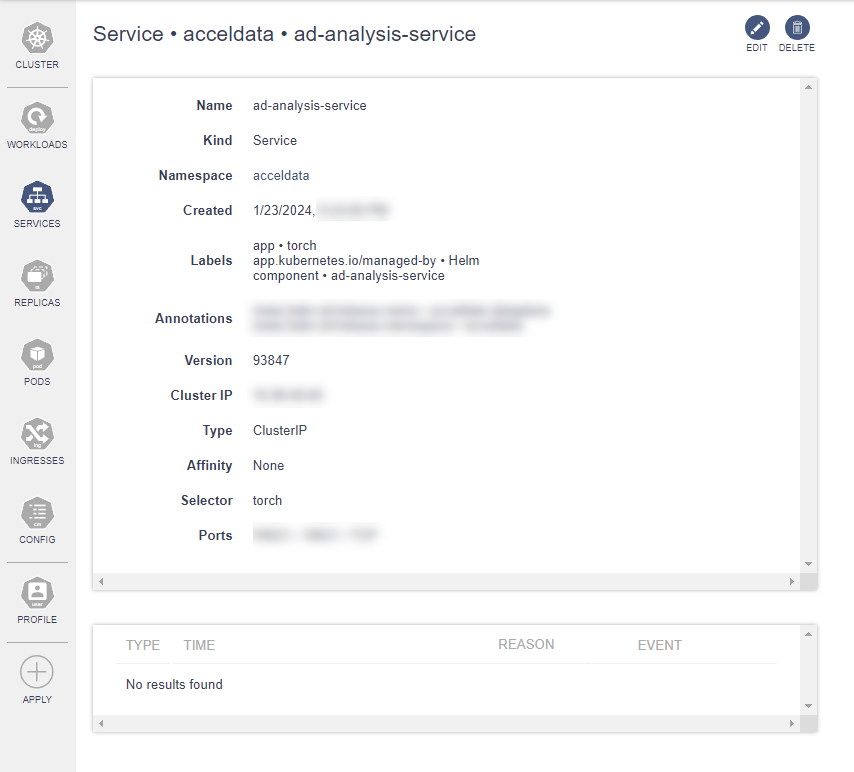
Clicking Name displays service details.
- Observability: The services monitoring feature enables users to observe real-time status and performance, crucial for maintaining system health and efficiency.
- Actionability: While the interface provides various management options, some actions, such as editing and deleting services, may be restricted based on user permissions.
Replicas
Replica Sets Dashboard in ADOC provides a centralized interface for monitoring and managing replica sets in your Kubernetes environment. Replica sets are a crucial component in Kubernetes, ensuring that a specified number of pod replicas are running at any given time.
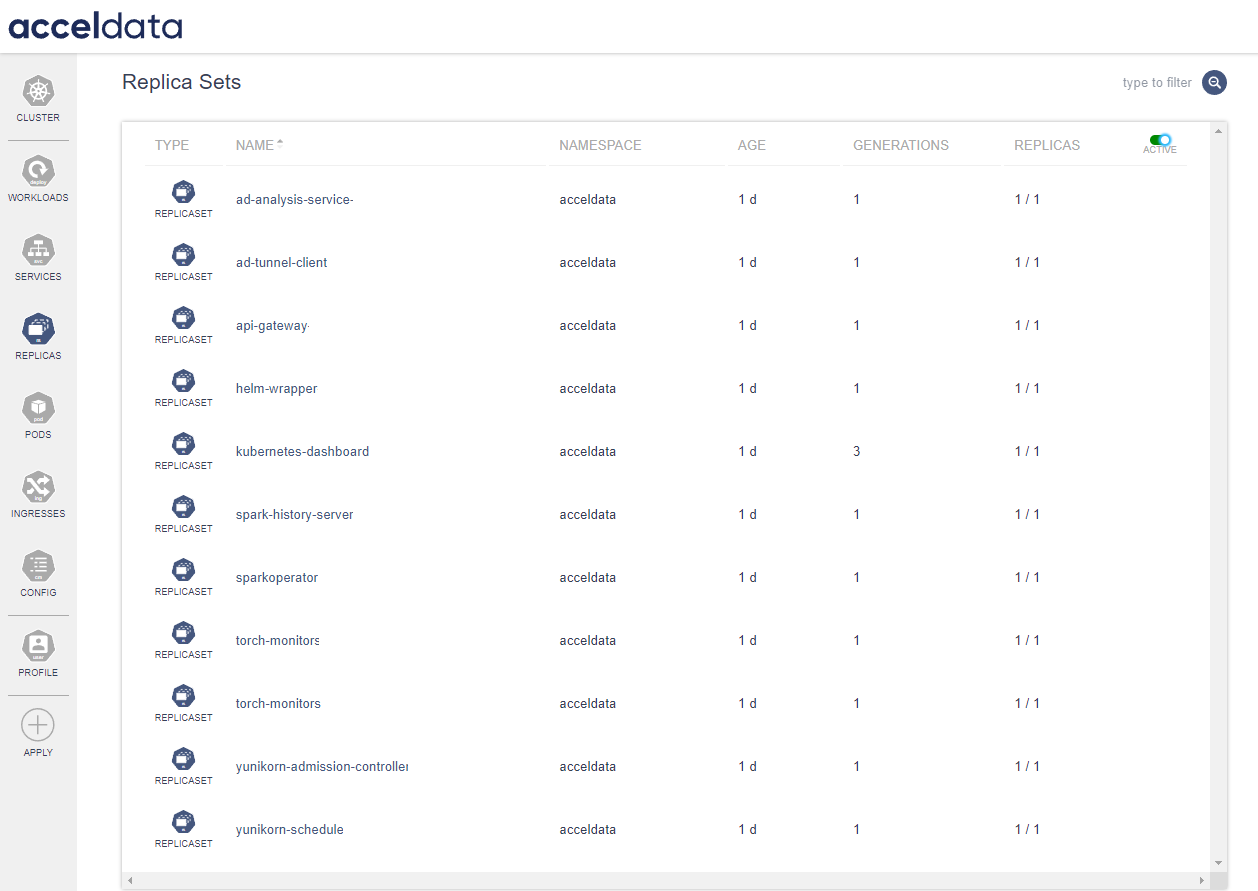
| Field | Description |
|---|---|
| Type | Identifies the replica type. |
| Name | Replica set is listed with the unique name for identification. Click on the name to view the details. |
| Namespace | The namespace column indicates the logical partition within the cluster where the replica set resides. |
| Age | This field shows how long the replica set has been running, providing insight into the longevity and stability of your services. |
| Generations | View the revision history with the generations count, which increases with each update to the replica set. |
| Replicas | The replicas column shows a fractional value, with the numerator indicating the current number of active replicas and the denominator showing the desired count as defined in the deployment configuration |
By using the Active
Clicking Name displays replica details.
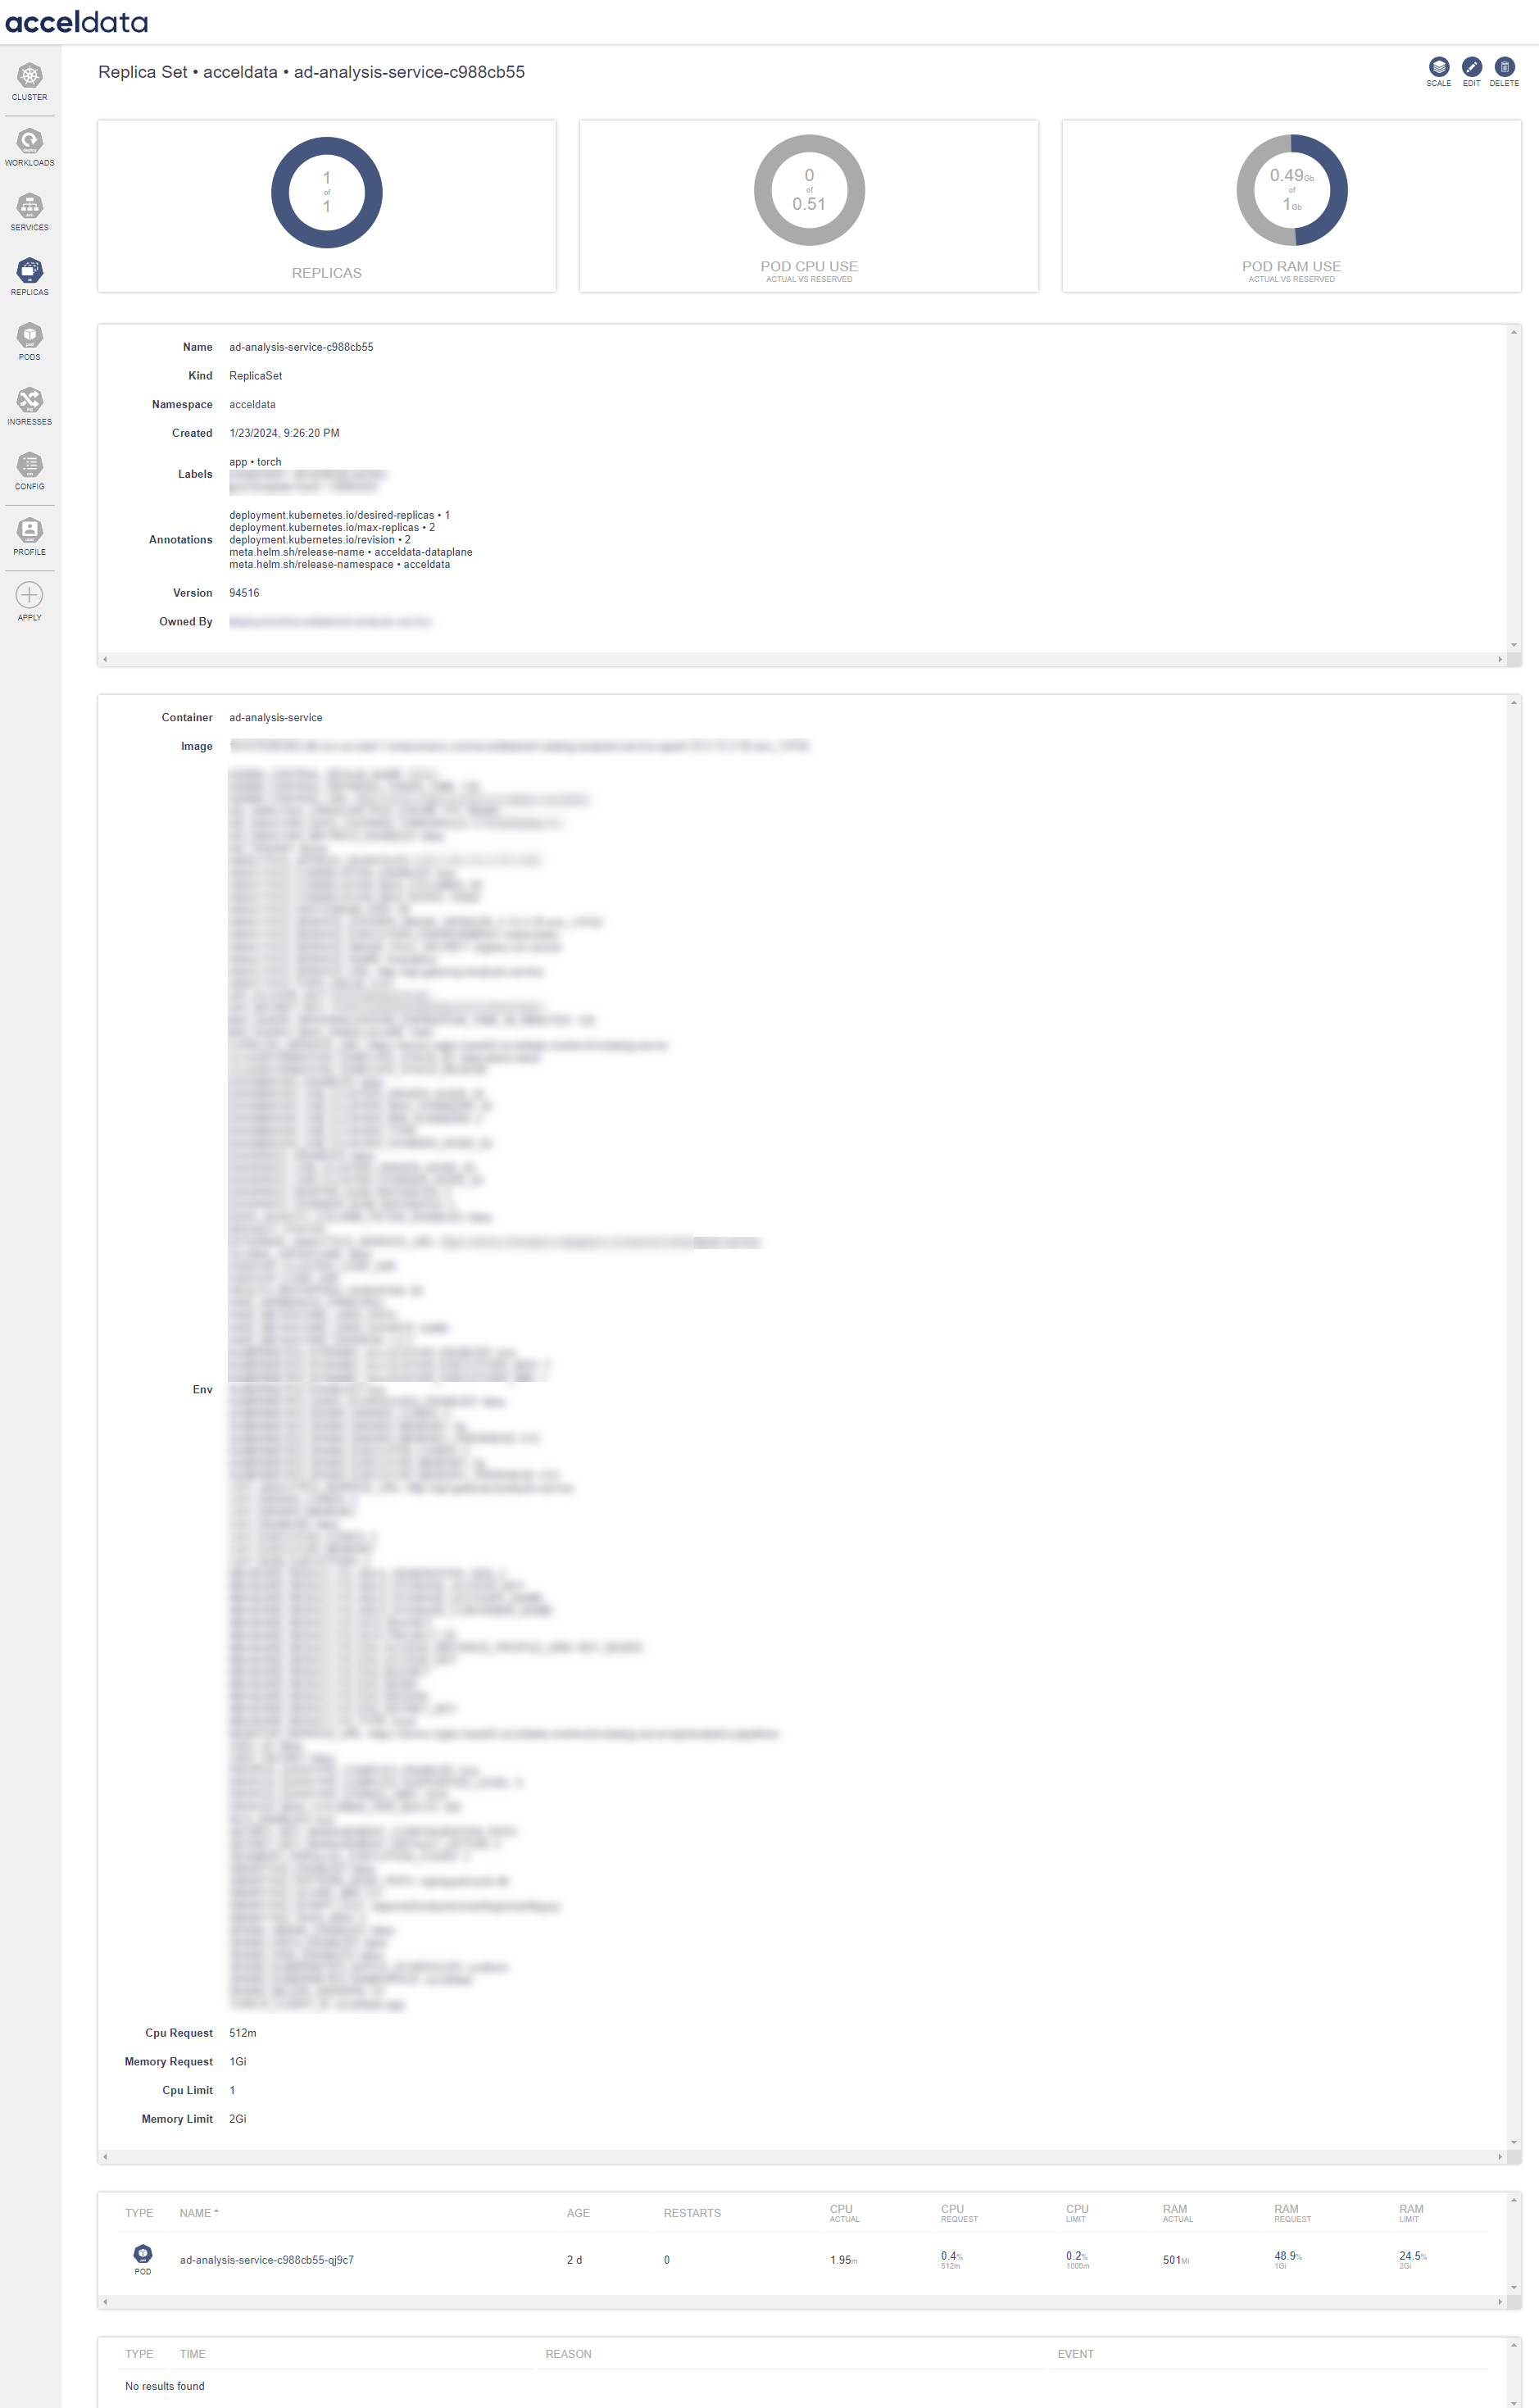
Pods
ADOC's Pods dashboard provides a real-time overview of pods' status within the Kubernetes environment. This section of the ADOC product guide outlines the functionality of the Pods dashboard which represent the state of the pods.

| Gauge | Description |
|---|---|
| Pods Ready vs Requested | The doughnut chart visually represents the number of pods currently ready compared to the number requested, offering immediate insight into the overall health and readiness of the pods. |
| POD CPU Use | Showcases the CPU utilization by the pods against the reserved CPU resources. |
| POD RAM Use | Displays the memory consumption by the pods in relation to the reserved memory resources. |
Monitoring pod status via these icons allows administrators to quickly assess which pods are operational and which have completed their lifecycle. This visual cue, paired with the detailed metrics, enables efficient management and troubleshooting of the Kubernetes pods.
Greyed Out Icons: Indicate inactive or terminated pods. These are the pods that are either completed their tasks (like Jobs or Cron Jobs), have been stopped, or are not currently scheduled to run.
Blue Icons: Represent active pods that are currently running and serving their purpose within the cluster. These icons may correspond to stateful applications, services, or continuous background tasks.
| Field | Description |
|---|---|
| Type | Identifies the pod type. |
| Name | Pods are listed with the unique name for identification. Click on the name to view the details. |
| Age | Duration since the pod was spawned. |
| Restarts | Number of times the pod has restarted, which can be an indicator of issues if the number is high. |
| CPU and RAM Actual: | The actual resource usage by the pod. |
| CPU and RAM Request | The minimum resources that have been requested for the pod. |
| CPU and RAM Limit | The maximum resources that the pod is allowed to consume. |
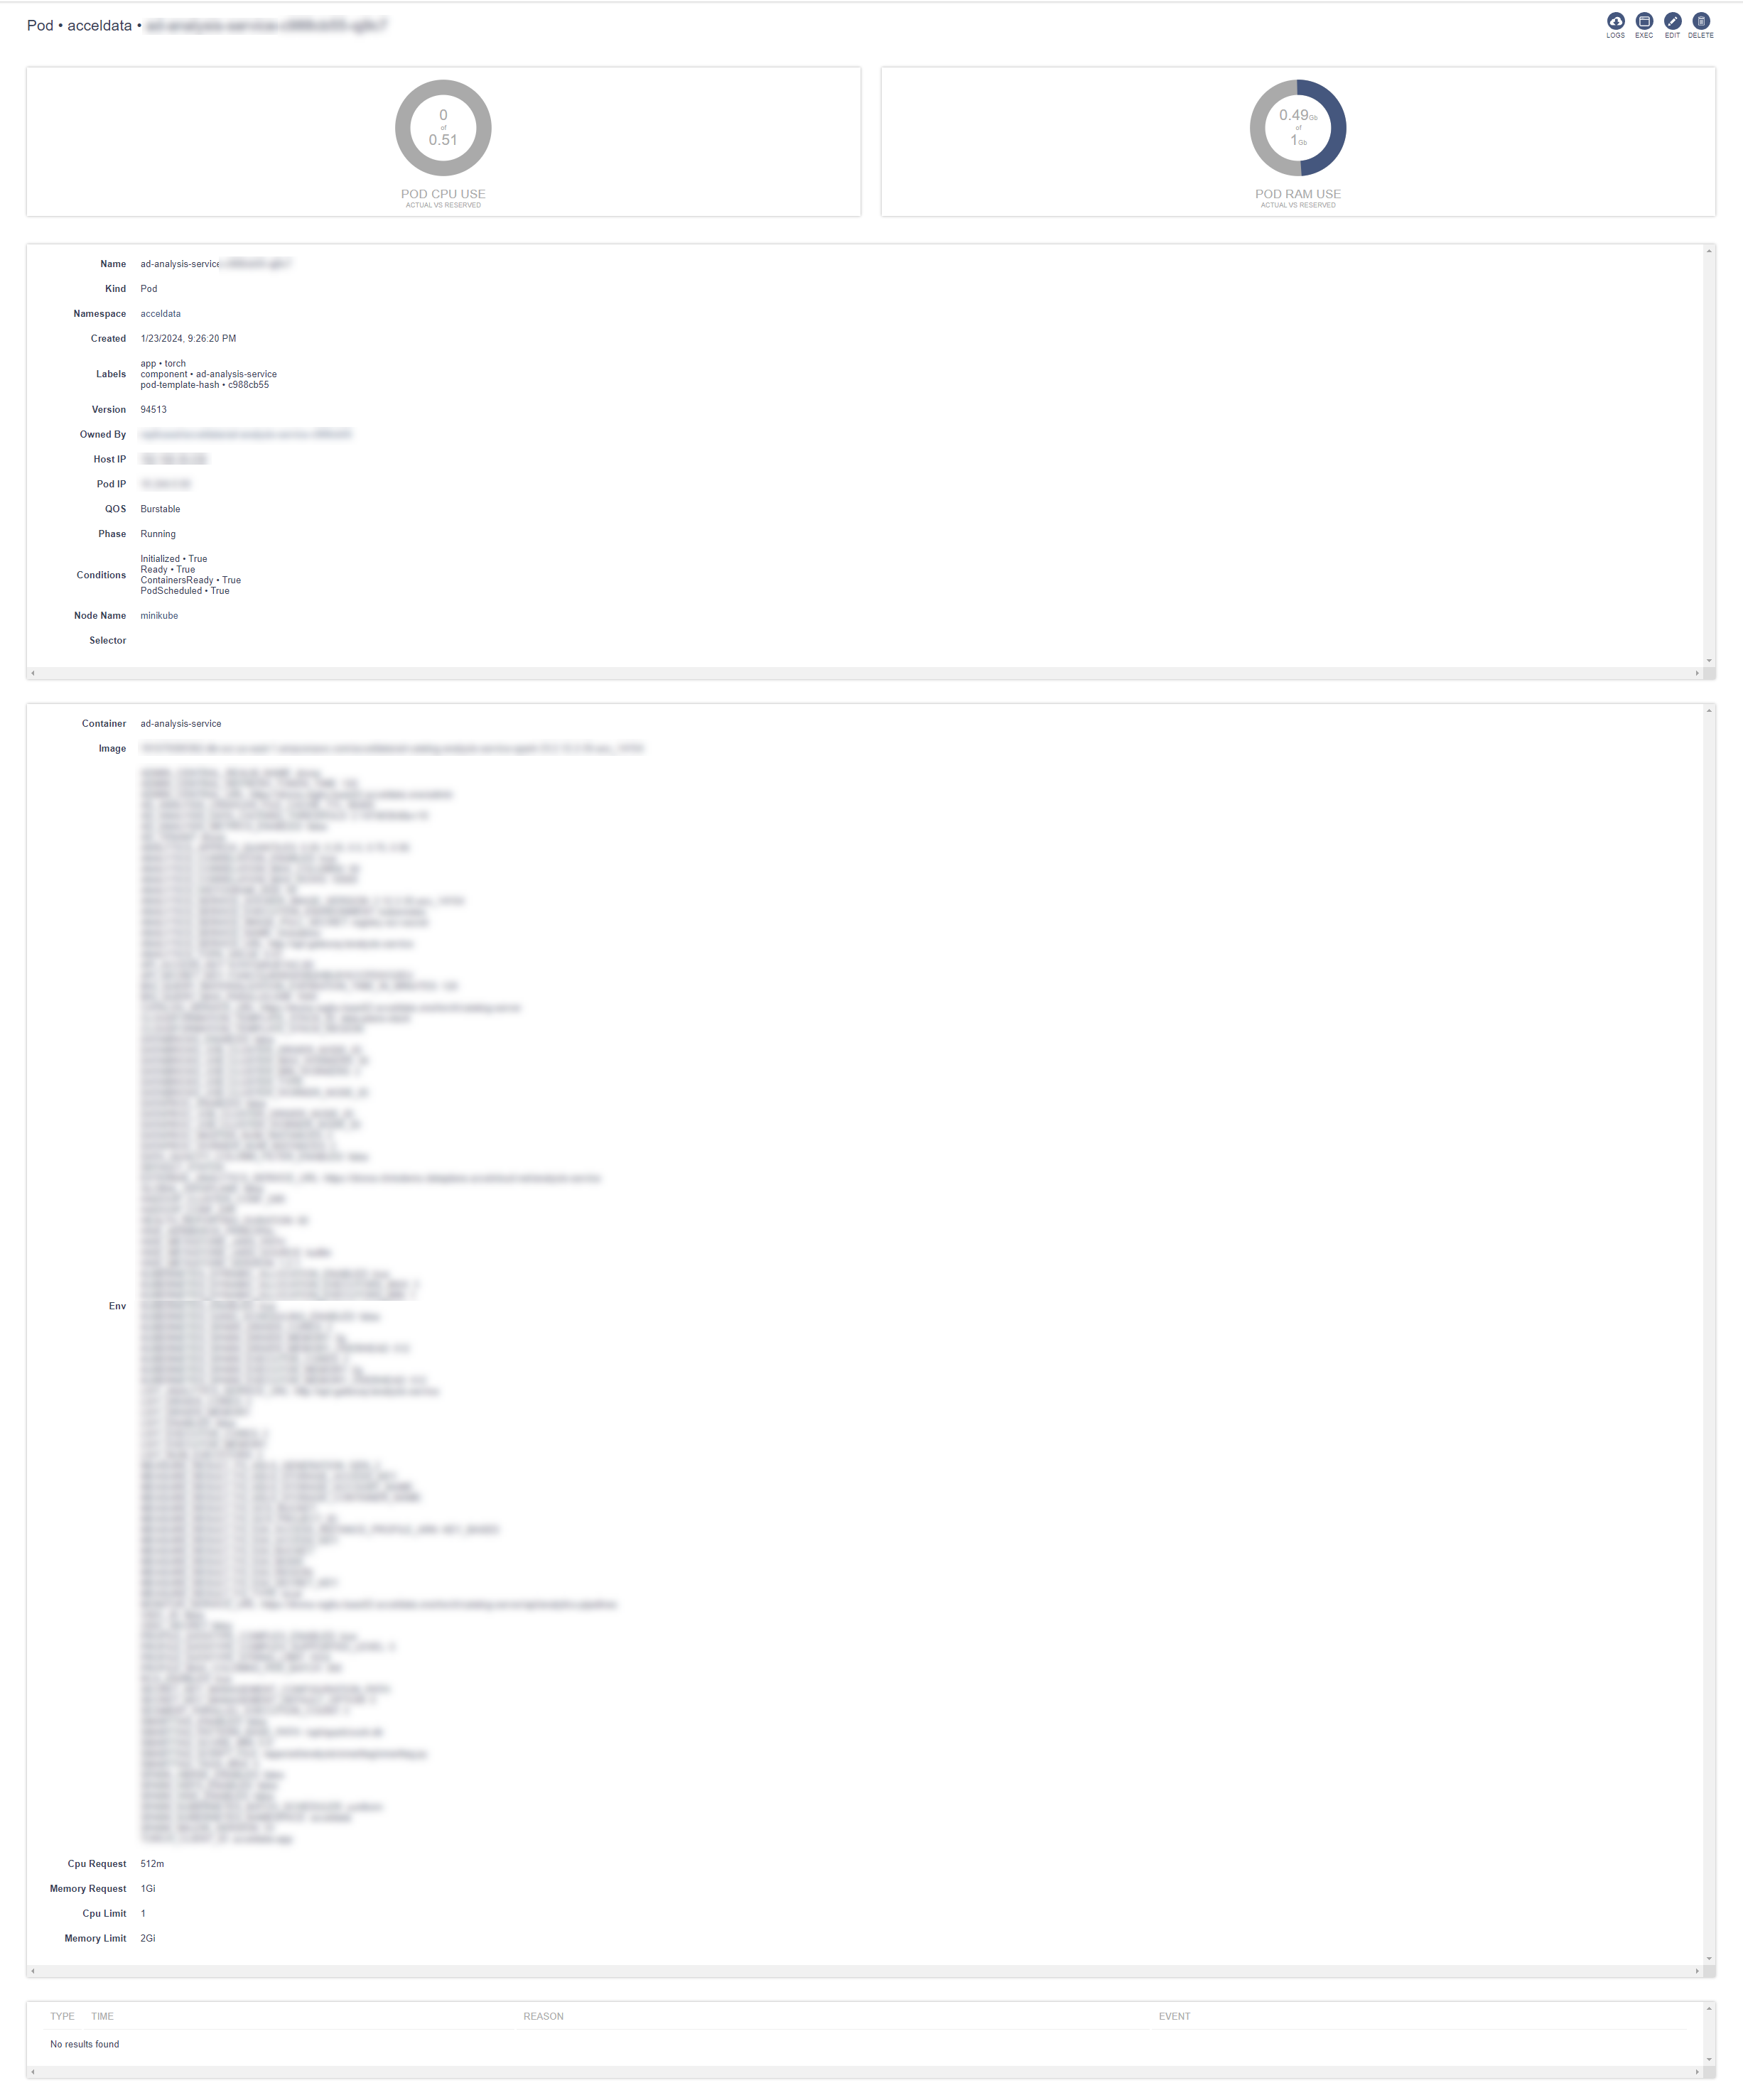
Clicking on the name displays the PODs details
Real-Time Log Access: In the Pod section, on the top right corner you will see the log
- Monitor Live Logs: Watch live log streams for any pod, providing up-to-the-second updates on pod activities.
- Troubleshoot in Real-Time: Quickly identify and respond to errors or unexpected behavior as it happens, reducing downtime and improving response efficiency.
- Access Historical Logs: Retrieve and analyze past log data for pods, useful for post-mortem analyses and performance reviews.
Ingresses
The Ingresses dashboard in ADOC provides a centralized view of all ingress resources within a Kubernetes cluster. In the context of Kubernetes, an ingress is a collection of rules that allow inbound connections to reach the cluster services. It can be configured to provide externally-reachable URLs, load balance traffic, terminate SSL, offer name-based virtual hosting, and more.
The Ingresses dashboard typically lists all the ingress resources with associated information such as name, namespace, age, hosts, and paths.
Config Maps
The Config Maps dashboard in ADOC provides a centralized interface for managing the configuration maps utilized within a Kubernetes cluster. These configurations are essential for decoupling configuration artifacts from image content to keep containerized applications portable.
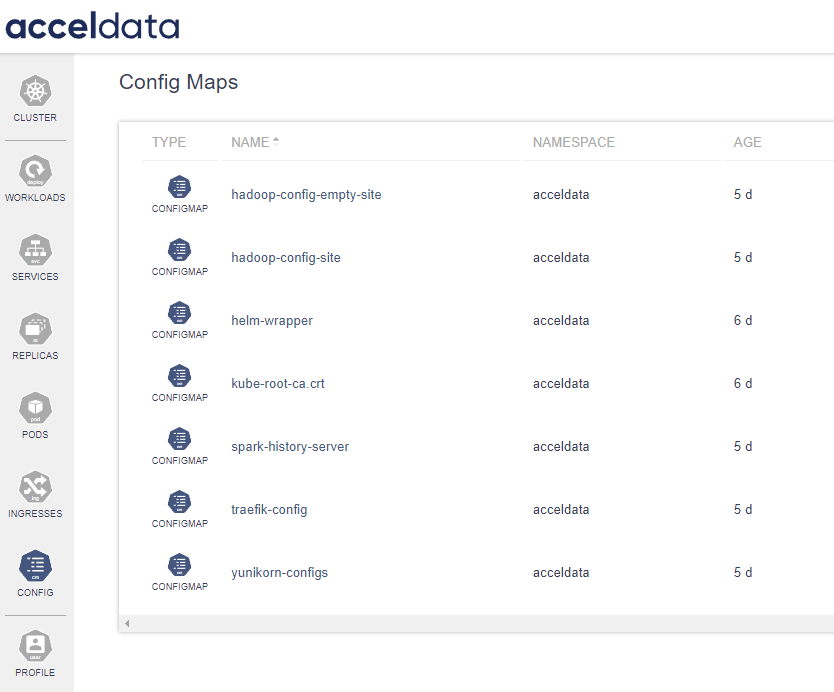
Config Maps allow you to store configuration settings and sensitive information that can be accessed by applications and services running in Kubernetes. This includes external configuration files, command-line arguments, environment variables, port numbers, and more.
In the dashboard the Config Maps dashboard presents a list of all available Config Maps within the Kubernetes cluster. Each entry on the dashboard displays the Type, Name of the Config Map, the Namespace it resides in, and the Age indicating how long it has been since the Config Map was created or updated.
| Field | Description |
|---|---|
| Type | This column specifies the object type, which is 'ConfigMap' for all entries in this dashboard. It denotes that the listed objects are used to manage configuration data for pods and other system components within the Kubernetes environment. |
| Name | The Name field displays the unique identifier assigned to each Config Map. This name is used to reference the Config Map within Kubernetes manifests. It is crucial for the user to follow best practices for naming to avoid conflicts and to ensure clarity within the Kubernetes namespace. Click on the name to view the details. |
| Namespace | This refers to the Kubernetes namespace where the Config Map is located. Namespaces are used to organize objects in a cluster and can provide a scope for names. |
| Age | The Age column shows the duration since the Config Map was deployed or last updated, providing insight into the currency of the contained configurations. |
- Use concise, descriptive names that convey the purpose of the Config Map.
- Follow naming conventions that are consistent across the cluster to facilitate easier management and recall.
- Avoid using sensitive data or confidential information in the names of Config Maps.
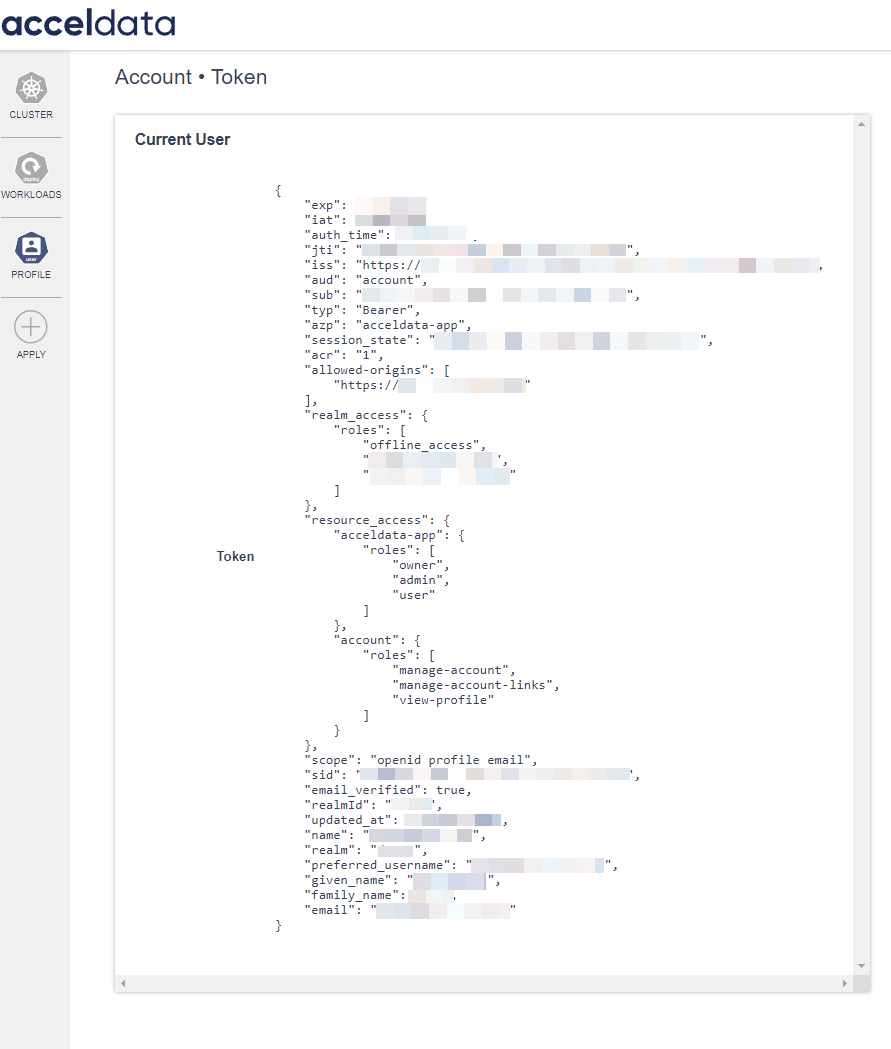
Profile
Clicking on the profile button opens the Account > Token section within the ADOC platform. It provides detailed information about the current user's access token. This token is used to authenticate and communicate with the ADOC services securely.
| Field | Description |
|---|---|
| Token Details: | |
exp | The expiration timestamp of the token, indicating when it will become invalid. |
iat | The issued-at timestamp, marking when the token was generated |
auth_time | The timestamp of the last authentication. |
jti | A unique identifier for the token. |
sub | The subject of the token, typically the user's unique identifier within the system. |
typ | Token type, which is typically "Bearer" for tokens used in Authorization headers. |
session_state | A unique identifier for the session state. |
acr | The Authentication Context Class Reference value, indicating the class of authentication methods used. |
| Access and Roles: | |
realm_access | Specifies the roles assigned to the user within the realm. |
resource_access | Contains information about the roles pertaining to specific resources. For example, "acceldata-app" has roles like "owner", "admin", and "user |
account | Lists roles associated with the user's account, such as "manage-account" and "view-profile". |
| User Information: | |
sid | Session ID |
email_verified | Indicates whether the user's email address has been verified. |
name | The user's full name |
preferred_username | The username preferred by the user within the platform |
given_name | The user's first name |
family_name | The users last name |
email | The user's email address. |
This token information is vital for understanding user permissions, roles, and authentication status. It is essential for auditing, security checks, and for the user to understand their capabilities within the ADOC platform.
Always handle token information with care, as it provides access to the user account. It should not be shared or exposed to unauthorized entities.