Add Monitors and Alerts
The next step after adding the data source is to create a Monitor and Alert in ADOC.
You can utilize ADOC Monitors to track complicated situations within various applications and generate Alerts when such conditions are fulfilled.
A monitor is essentially an alarm system with a predefined condition. An alert is triggered if the condition is met.
ADOC supports two types of Monitor integration:
- Custom Monitor: You can create custom monitors by clicking the Create Monitor button and enter apt settings, filters, configuring notifications, and actions from scratch.
- Monitors Store: ADOC provides these monitors as-is. By clicking the Monitors Store button, you can view the monitors in this store. In these monitors, all of the filters and actions are pre-configured. You can enable or disable a stock monitor as needed. When you enable the monitor and the monitor condition is met, the monitor sends notifications and takes the necessary action.
The following steps will guide you through the process of adding your first Monitor for Snowflake.
To add a monitor, hover over the Compute button in the side panel and click on the
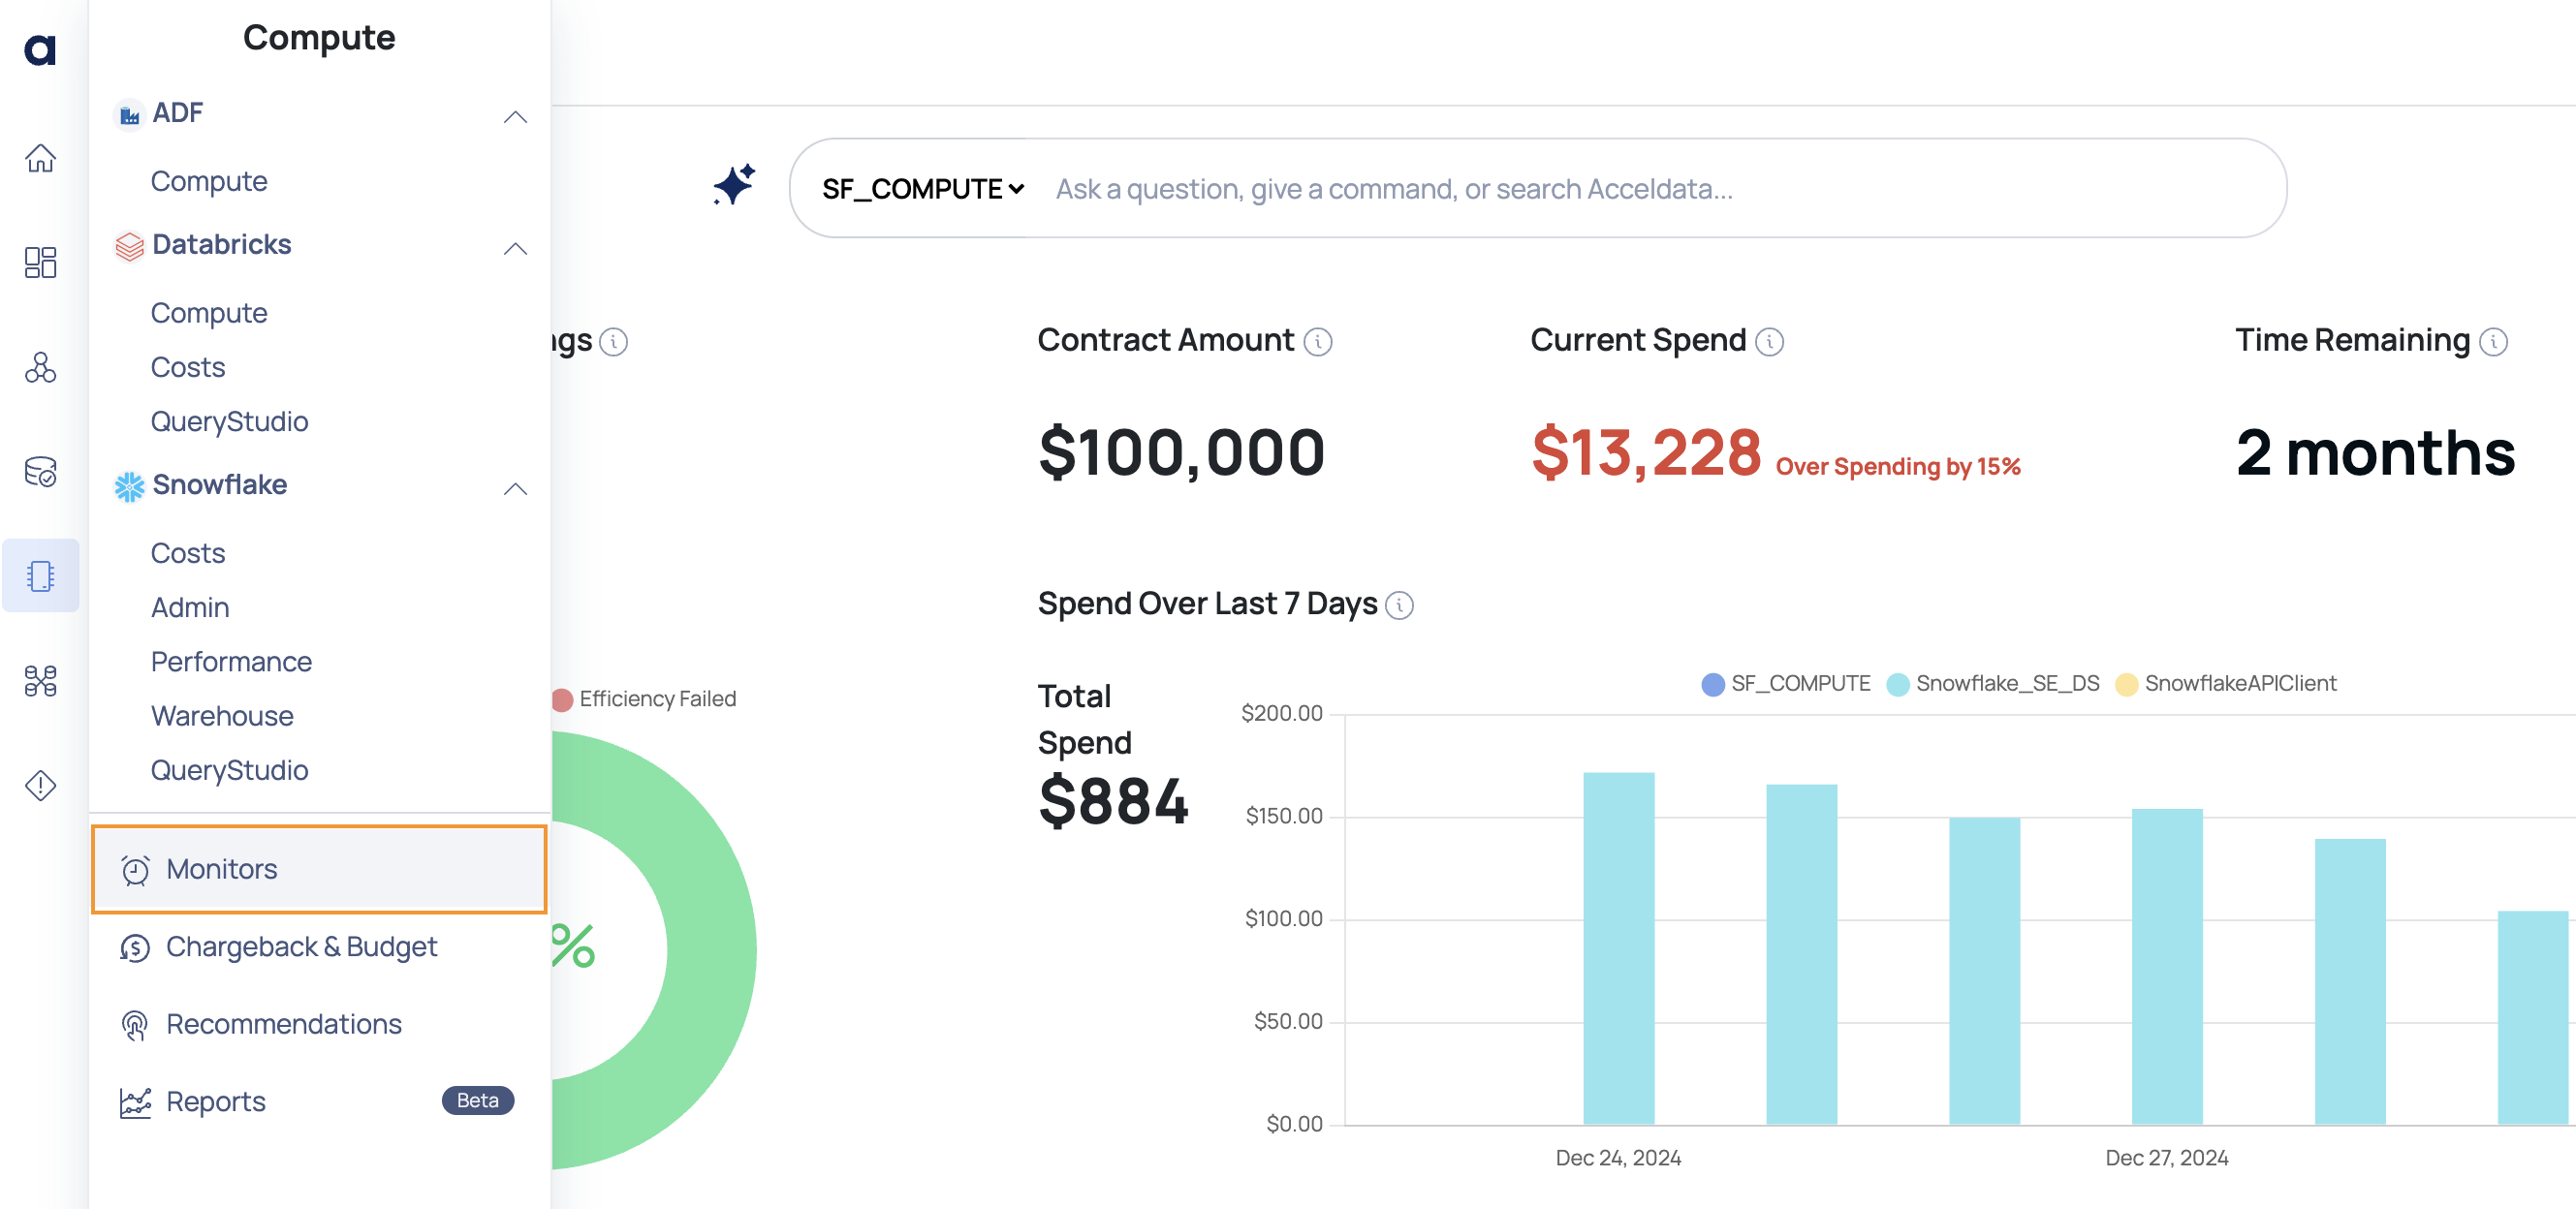
Monitors Page
On the Monitor list page click the Create Monitor button.
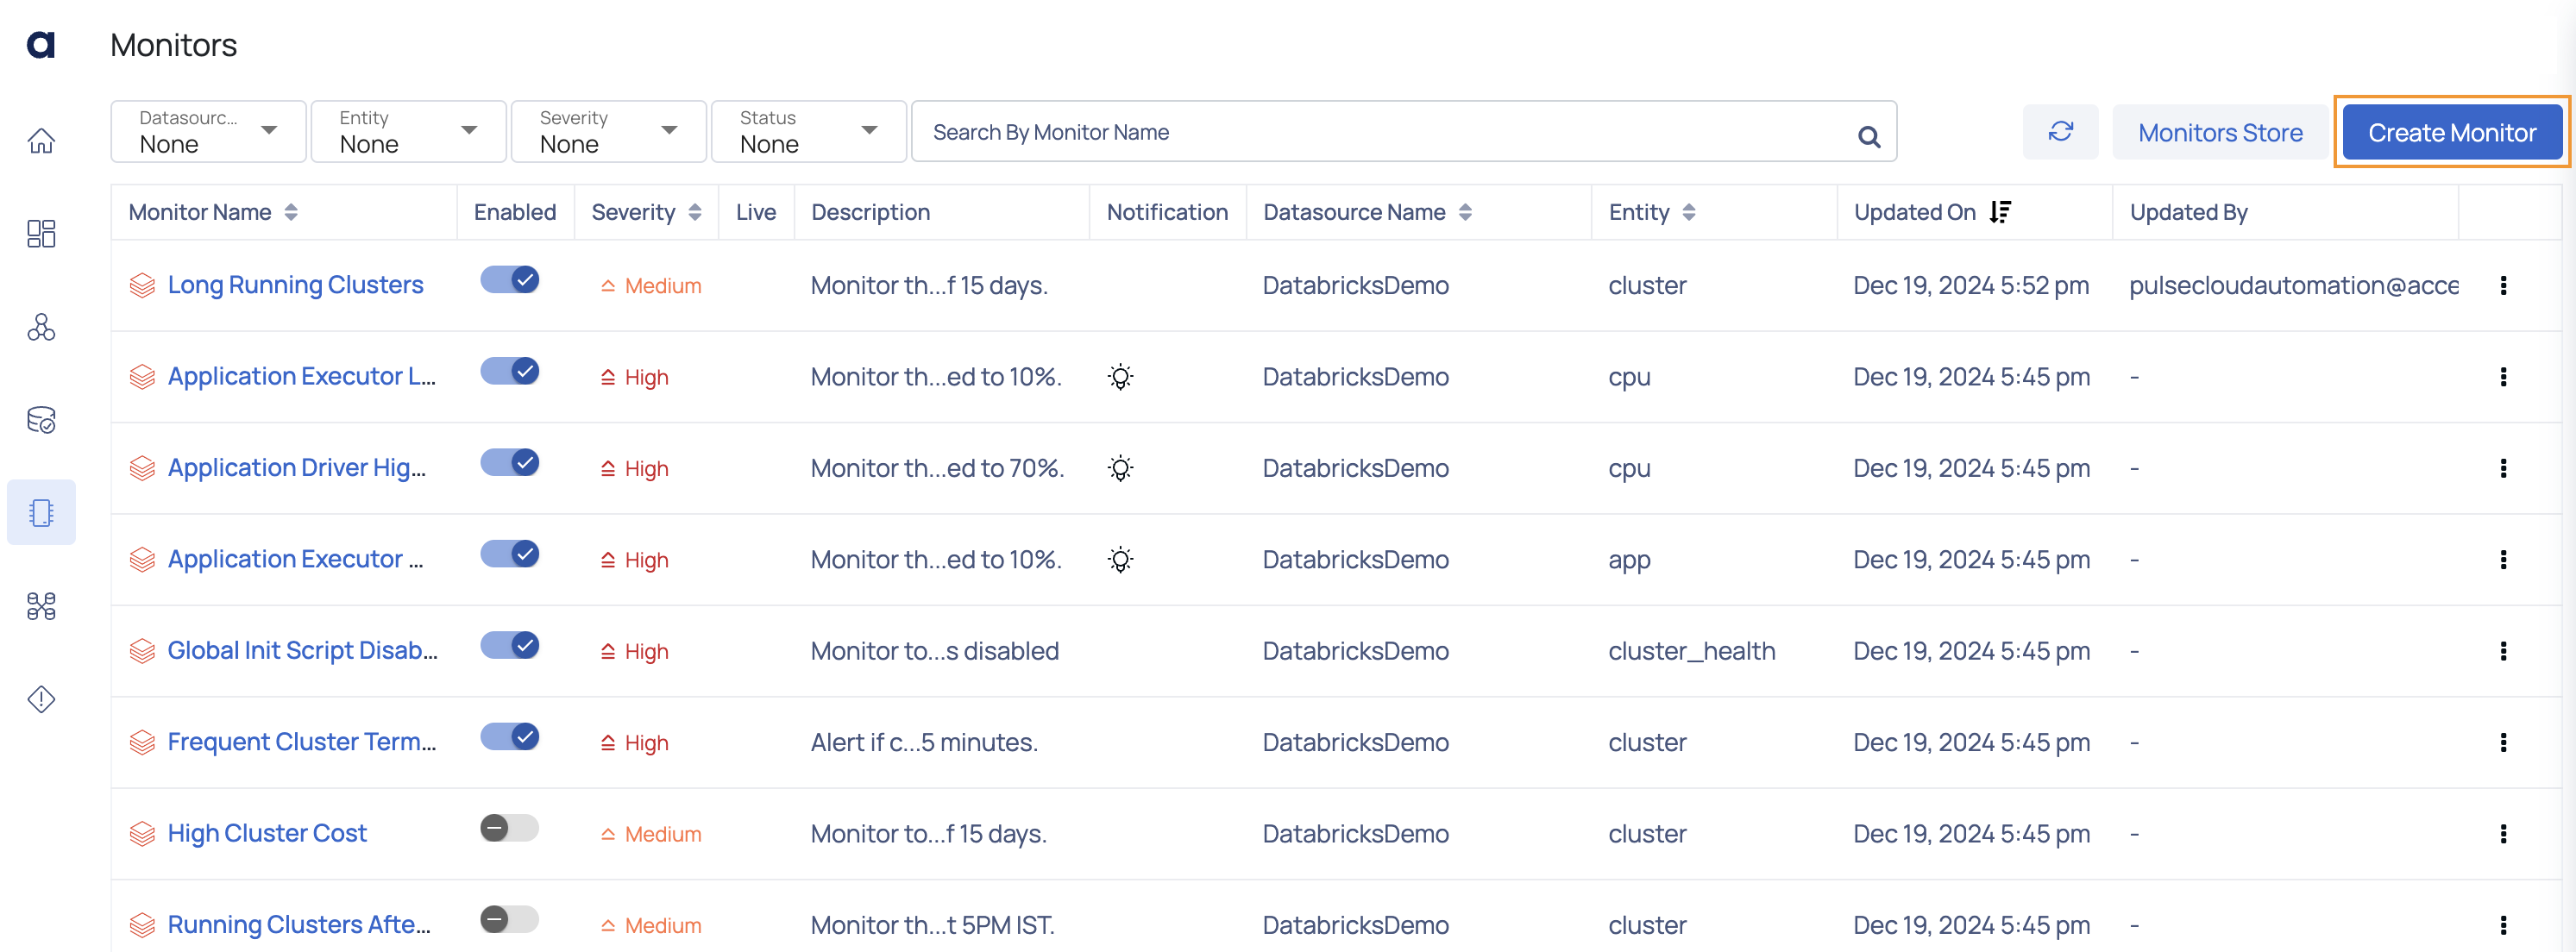
Create Monitor Button
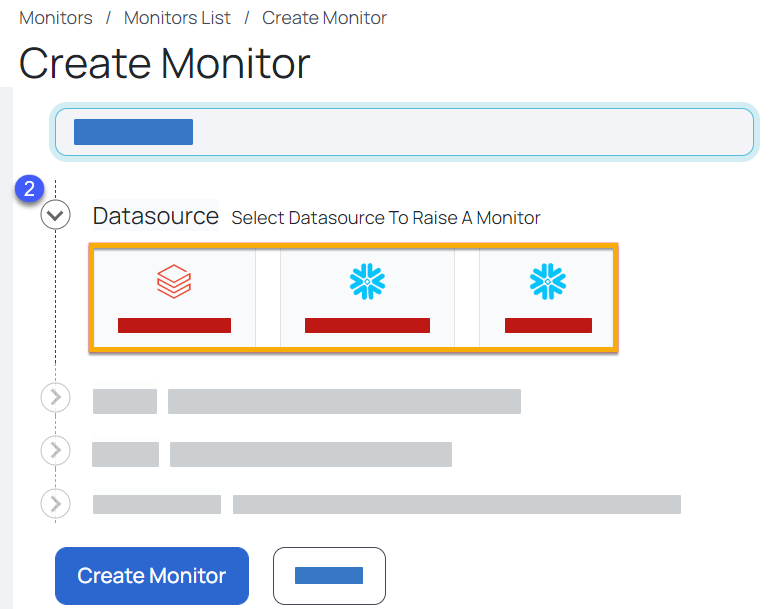
The Create Monitor page appears. The five steps in the Create Monitor wizard are as follows:
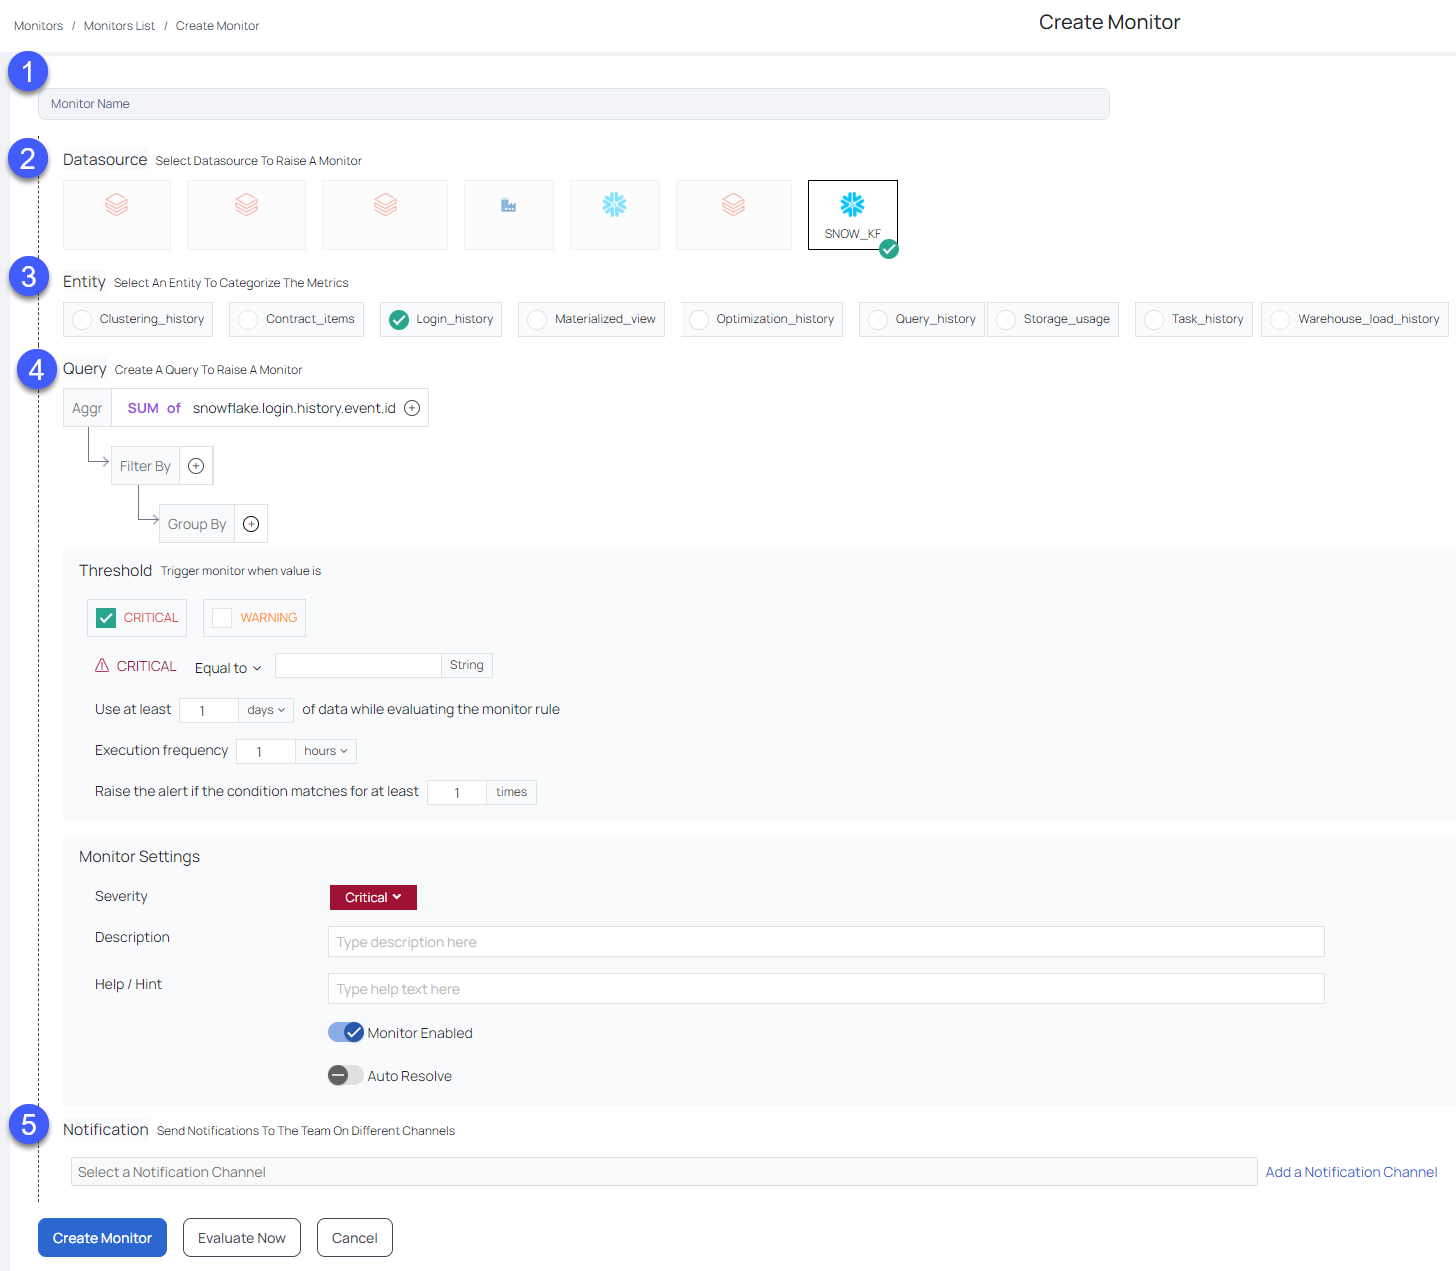
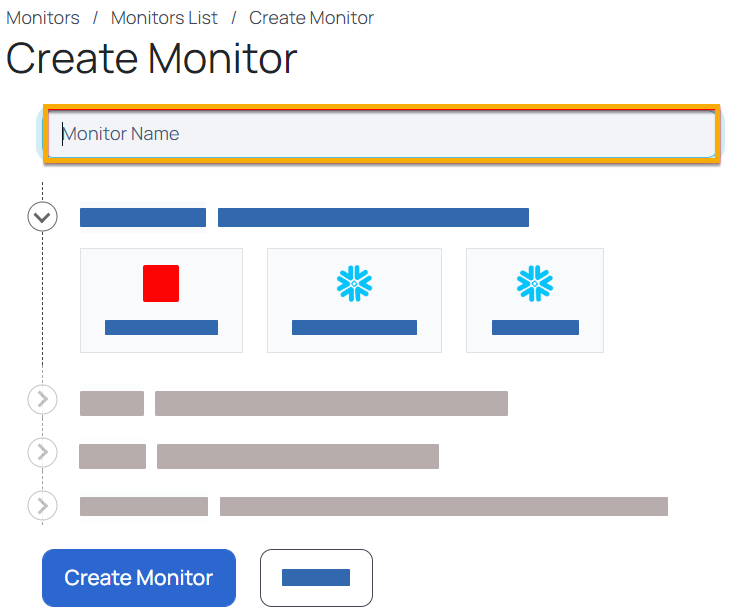
1: Monitor Name
Provide a name for the monitor that you want to create. The name you give the monitor helps in its identification. You cannot use blank spaces in an monitor name.
2: Data Source
Choose the data source for which you want to build the monitor.
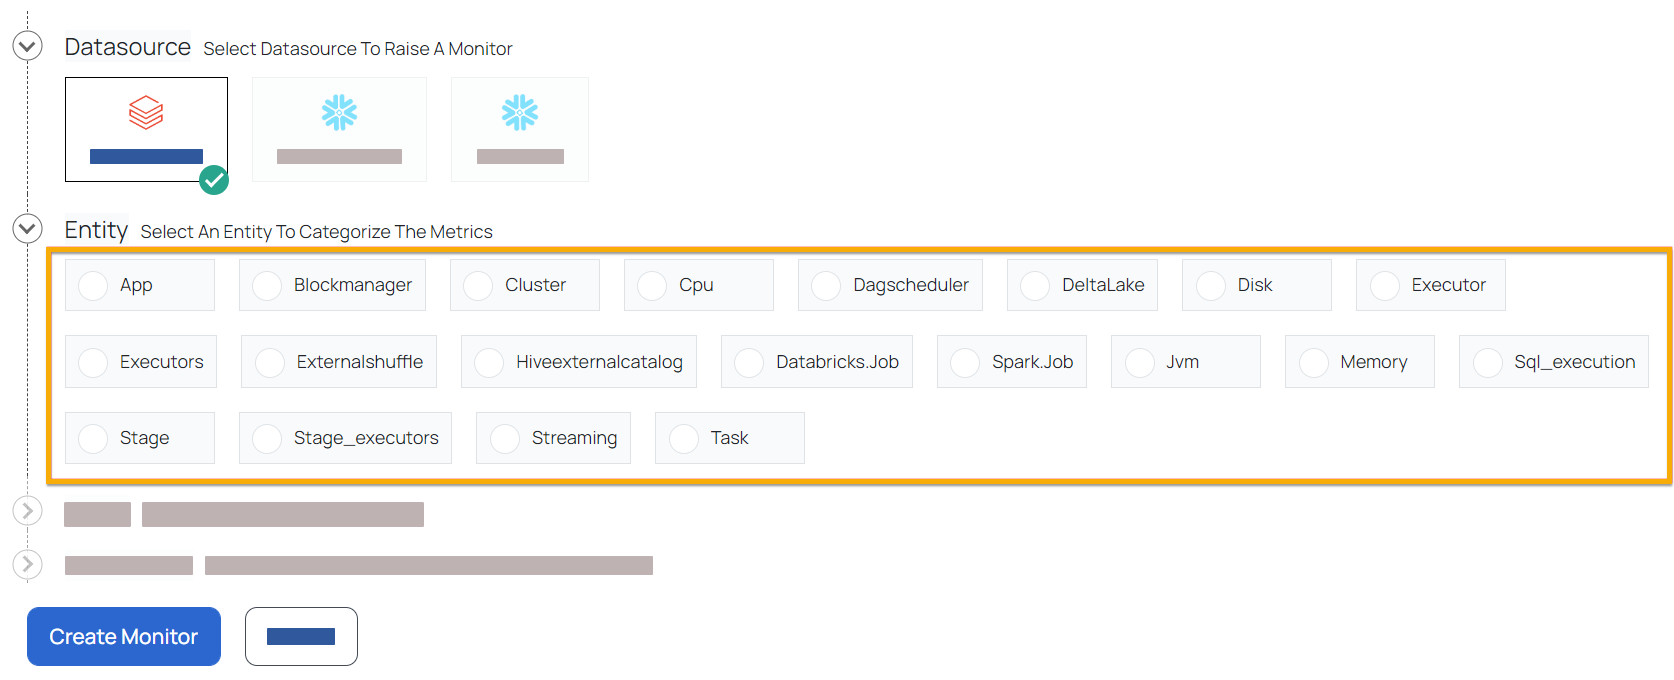
3: Entity
The Entity defines the monitoring target for an application. A number of entities are displayed depending on the type of Data Source selected.
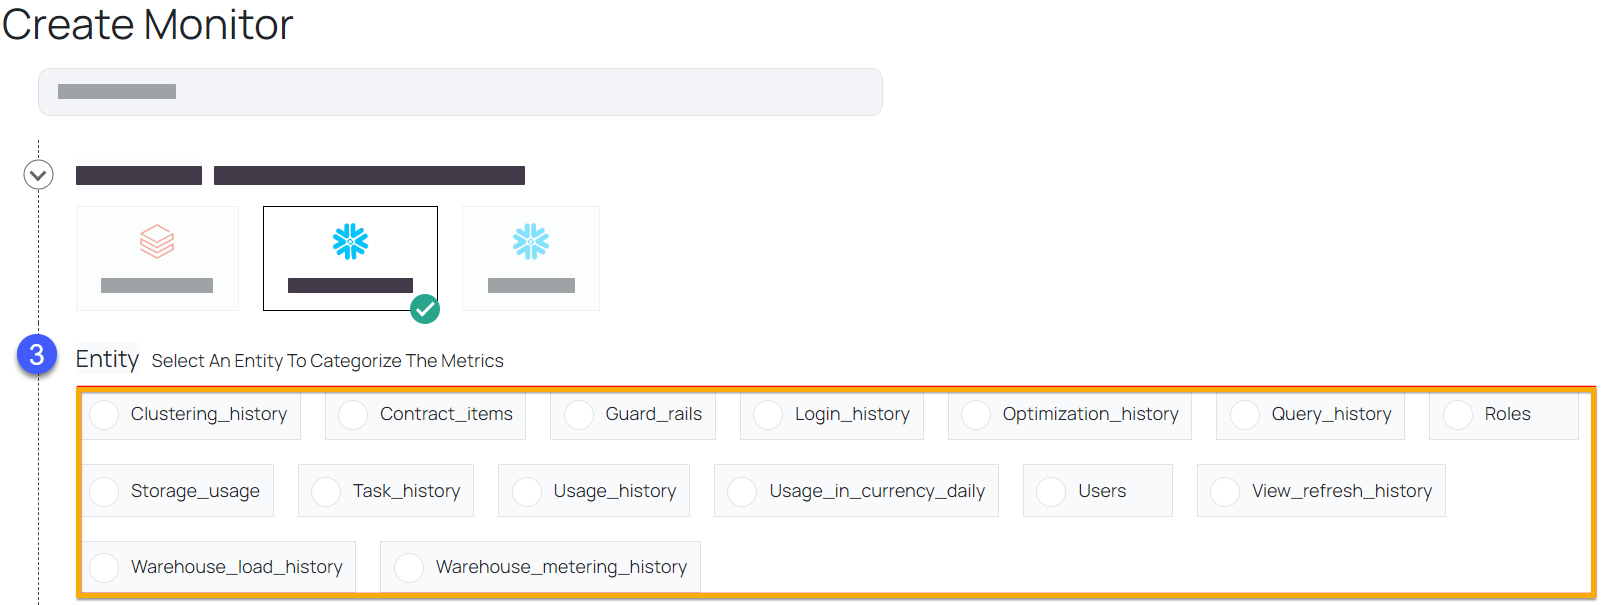
These entities differ depending on the Data Source. When you select a Data Source, the entities associated with it are displayed.
4: Query
The Query structure allows you to construct a set of monitor conditions, schedules, and actions. Different Query metrics are displayed based on the selected entity, and they differ for each entity.
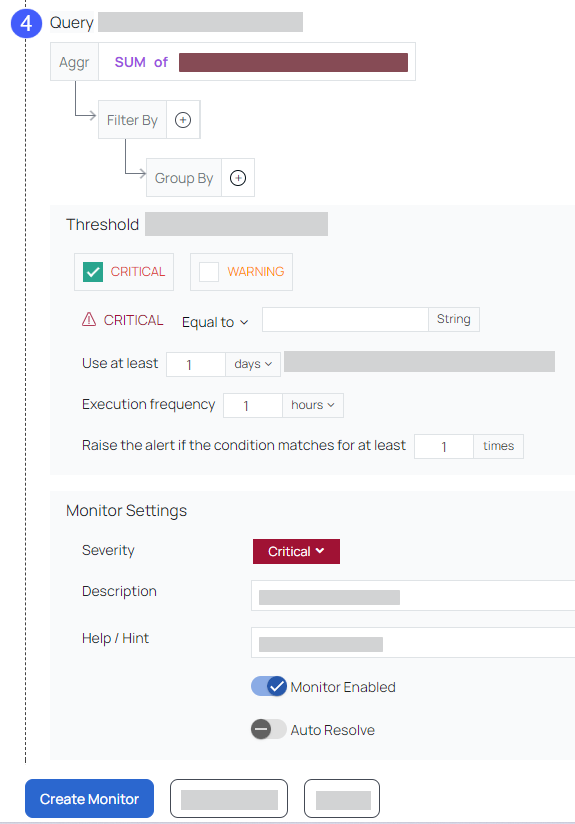
In this example, the Query is constructed to monitor the system CPU utilization time. A filter is used to monitor only devices in the AWS zone us-east-1. The devices are classified based on their cloud service provider.
You must define You must define the following under Query:
Aggregation (Aggr)
You must define the arithmetic combination of metrics. To define aggregation perform the following steps:
- Select the operation you want to perform on the metric in the Aggr box under the query.
- From the drop-down menu, choose the metrics. To add another metric, click the
icon, and choose one from the drop-down menu. - Go to Filter by and click the
button to apply a filter. Select the metric from the drop-down menu, and input a value. Click the icon to add additional filter, and the icon to remove the filter. - To group the queries, go to Group By and click on
icon, then select the metric from the drop-down menu. To add multiple metrics, click on the icon, and to remove the filter, click the icon.

- The Group By allows users to add a parent aggregation. Click Add Parent Aggregation to add a parent aggregation to the query, and Remove Parent Aggregate to remove a parent aggregate.
For example, in the following parent aggregation, all the unique cloud service providers are counted as well, apart from grouping the data by cloud service providers.
Trigger Alert (Threshold)
A Threshold triggers a monitor if your clusters, hosts, queues, or jobs match the conditions of the threshold.
To define the threshold trigger perform the following:
- To add threshold values for the monitor type, check the Critical or Warning box. Select both check boxes as necessary.
- Enter the value in the box and choose a parameter from the drop-down box, such as above, below, or equal to. When the query result hits the specified value, the monitor sends an alert.
For example, in the following image the warning alert is raised when the CPU usage time surpasses 30 seconds and the critical alert is raised when the CPU idle time reaches 50 seconds.
- In the Use at least box, enter the minimum time interval (in seconds) for which data must be examined to evaluate the monitor condition.
- In the Execute query in every box provided, set the time interval (in seconds) to configure the monitor execution frequency. When this value is set to 60, the monitor condition is run once every minute.
- In the Raise the monitor if the condition matches for at least box, enter the value for a monitor to be raised if the query condition is met. For example, if the value is set to 5, and the monitor condition is met five times, then the alert is raised.
Monitor Settings
Monitor Settings help you identify an alert by the following parameters:
| Parameters | Description |
|---|---|
| Severity | Based on the severity of the alert, select one type of severity from the Severity type drop-down list. Available severity types are critical, high, medium and low. |
| Description | If the alert generates an incident, specify the description to be displayed on the incident |
| Help/Hint: | Specify a help text that is to be displayed on the incident when raised. |
| Activate or deactivate the Monitor | To disable or enable the alert click the |
| Auto Resolve | If you want to resolve an incident automatically, click the Auto Resolve |
5: Notification
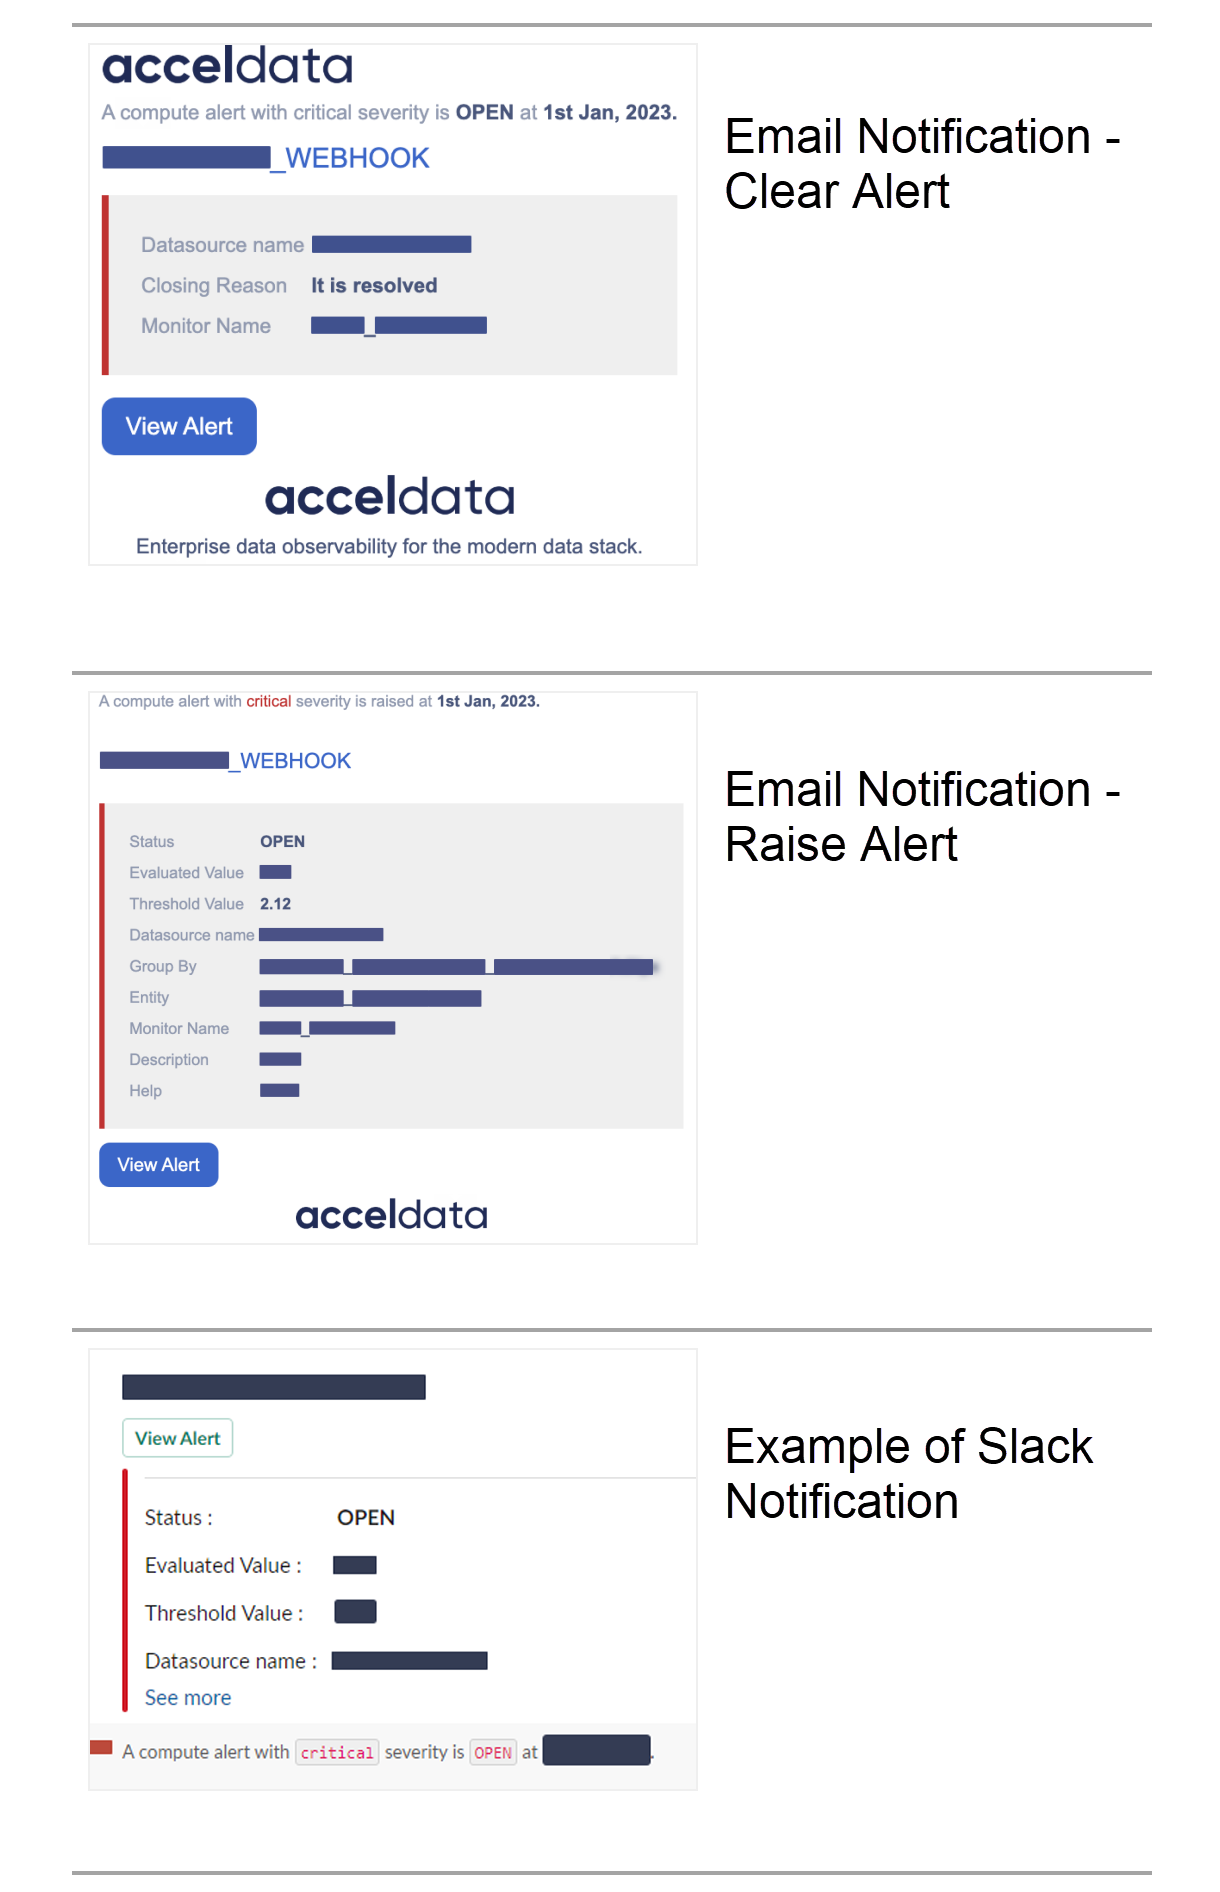
When a monitor's defined threshold levels are reached, an alert is generated. You can select notification channels to which the alert notifications must be sent.
The notifications configured in the Compute Notifications page are displayed in this section. You can select single or multiple notification channels. You will receive notifications in the channel that you have chosen.
Click the Evaluate Now button to evaluate the current configurations created for your monitor. Once the monitor has been successfully evaluated, alerts are generated for that particular monitor and you can view them in the Alert Details page.
Click the Create Monitor button, to create the monitor.
Congratulations! You have now completed the installation of your first Compute monitor in ADOC.
To add a monitor to any other sort of data source, first add it to the Registry (Adding Data Source) and then follow the steps to add Monitors to it.