Other Operations in Pipeline
This guide provides a comprehensive overview of the Timeline Spans and Pipeline Details features. You will learn how to navigate through execution timelines, access detailed information about your pipelines, assets, and jobs, and utilize advanced functionalities like drilling down into policies and comparing different pipeline runs.
Understanding these components is essential for effectively monitoring pipeline performance and ensuring data reliability.
Timeline Spans
The Timeline section displays the duration of the pipeline as well as the duration of individual spans along with the execution details. The section displays the execution timeline of each span.
Click View all events to view the associated events generated during all spans of the concerned pipeline. You can turn the Exclude child span events toggle switch to ON or OFF to include or exclude child span events. For a pipeline where an alert is raised when it is being monitored, it can be identified with a red bell icon beside it. For more information on how to configure the historical baseline of pipeline execution, setup alerts, and automatically execute profiling, data quality, and reconciliation policies, see Pipeline Controls.
Pipeline Details
The pipeline details section displays the following tabs at the bottom of the Pipeline Details page: Timeline, All Automations, Asset Node, and Job Node.
- All Automations: This tab displays a list of all configured automation executions including executed policies and profiles for assets or job in the pipeline. For more information on how to configure automations, see Automated Data Reliability.
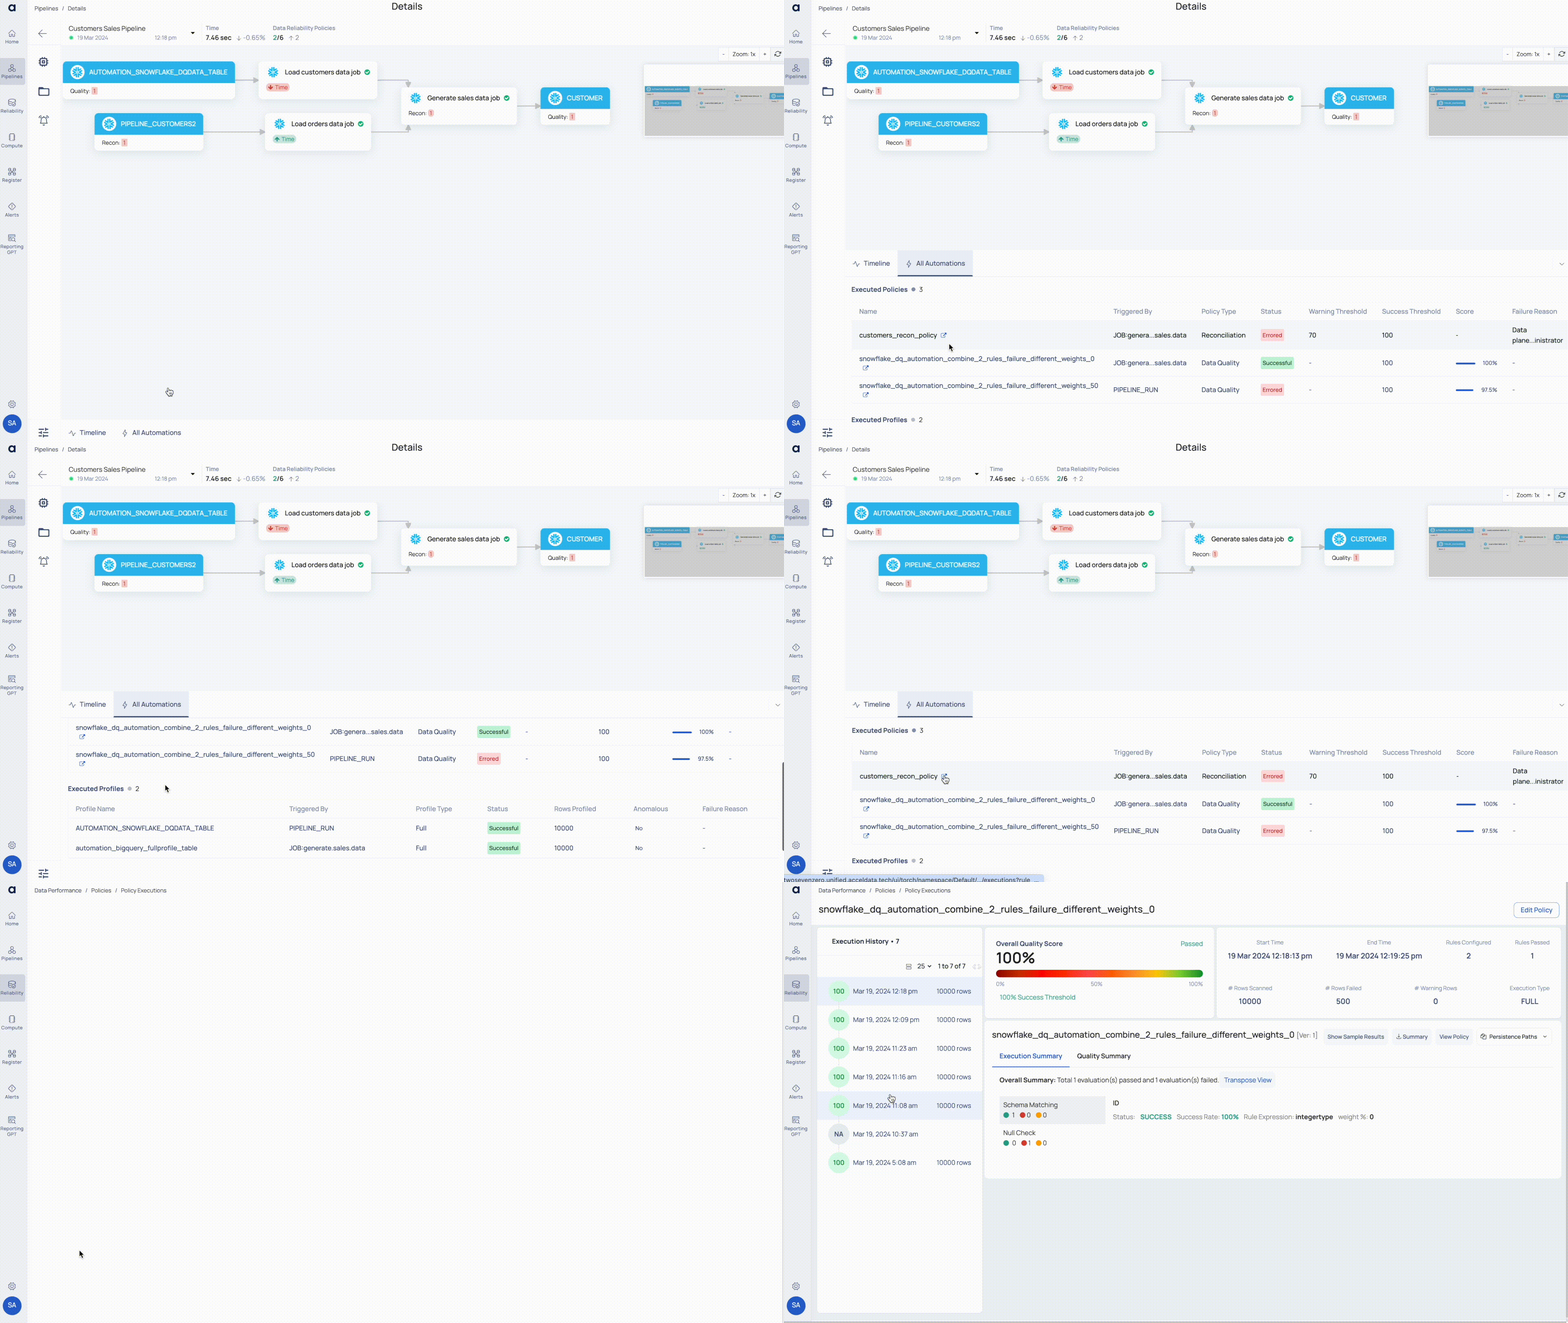
- Asset Node: To select an asset node, either click directly on an asset within the pipeline graph or use the
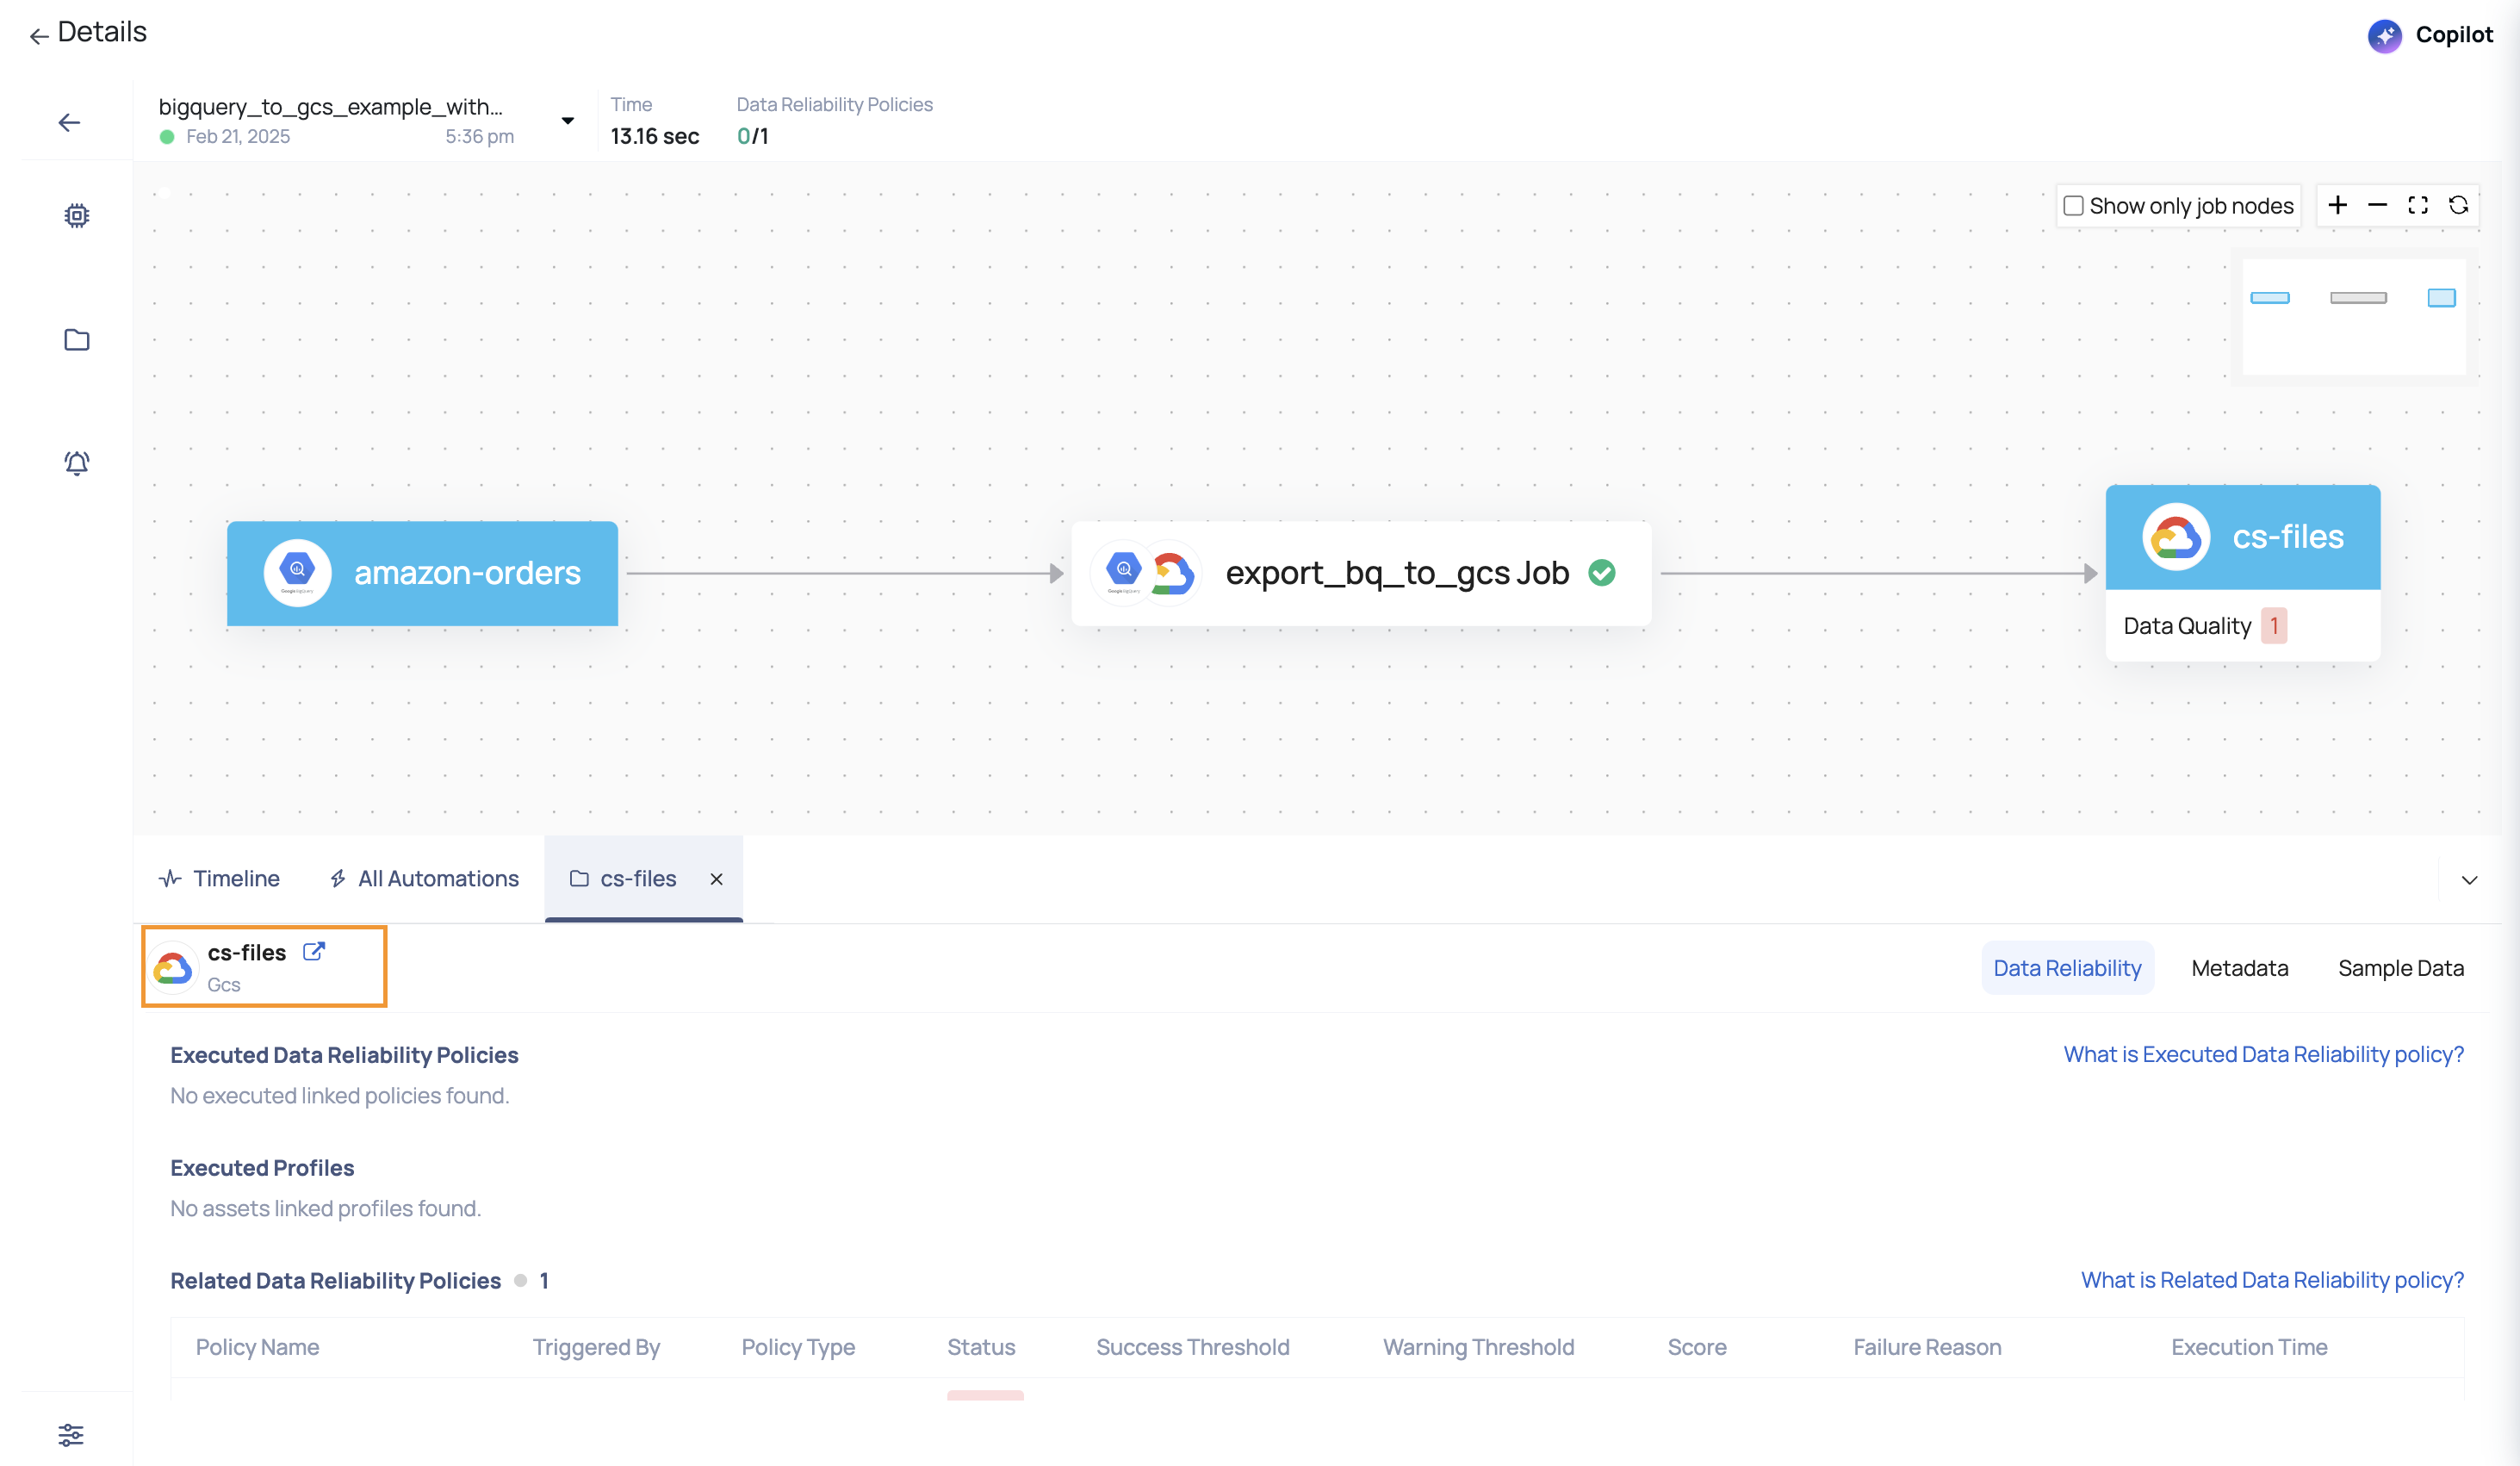
folder icon to choose an asset from the list that appears. Upon selecting an asset node, a new tab emerges adjacent to the All Automations tab at the bottom. This tab reveals asset-specific information, including Data Reliability, Metadata, and Sample Data. - Data Reliability: This section provides insights into the execution of all policies and profiles related to data reliability, whether initiated manually or through automated configurations. Additionally, it highlights any Related Data Reliability Policies linked to the asset.
- Metadata: Here, you'll find details such as the location of the pipeline code, ownership, and the designated team responsible for the pipeline.
- Sample Data: Offers a glimpse into the asset's sample data for quick reference.
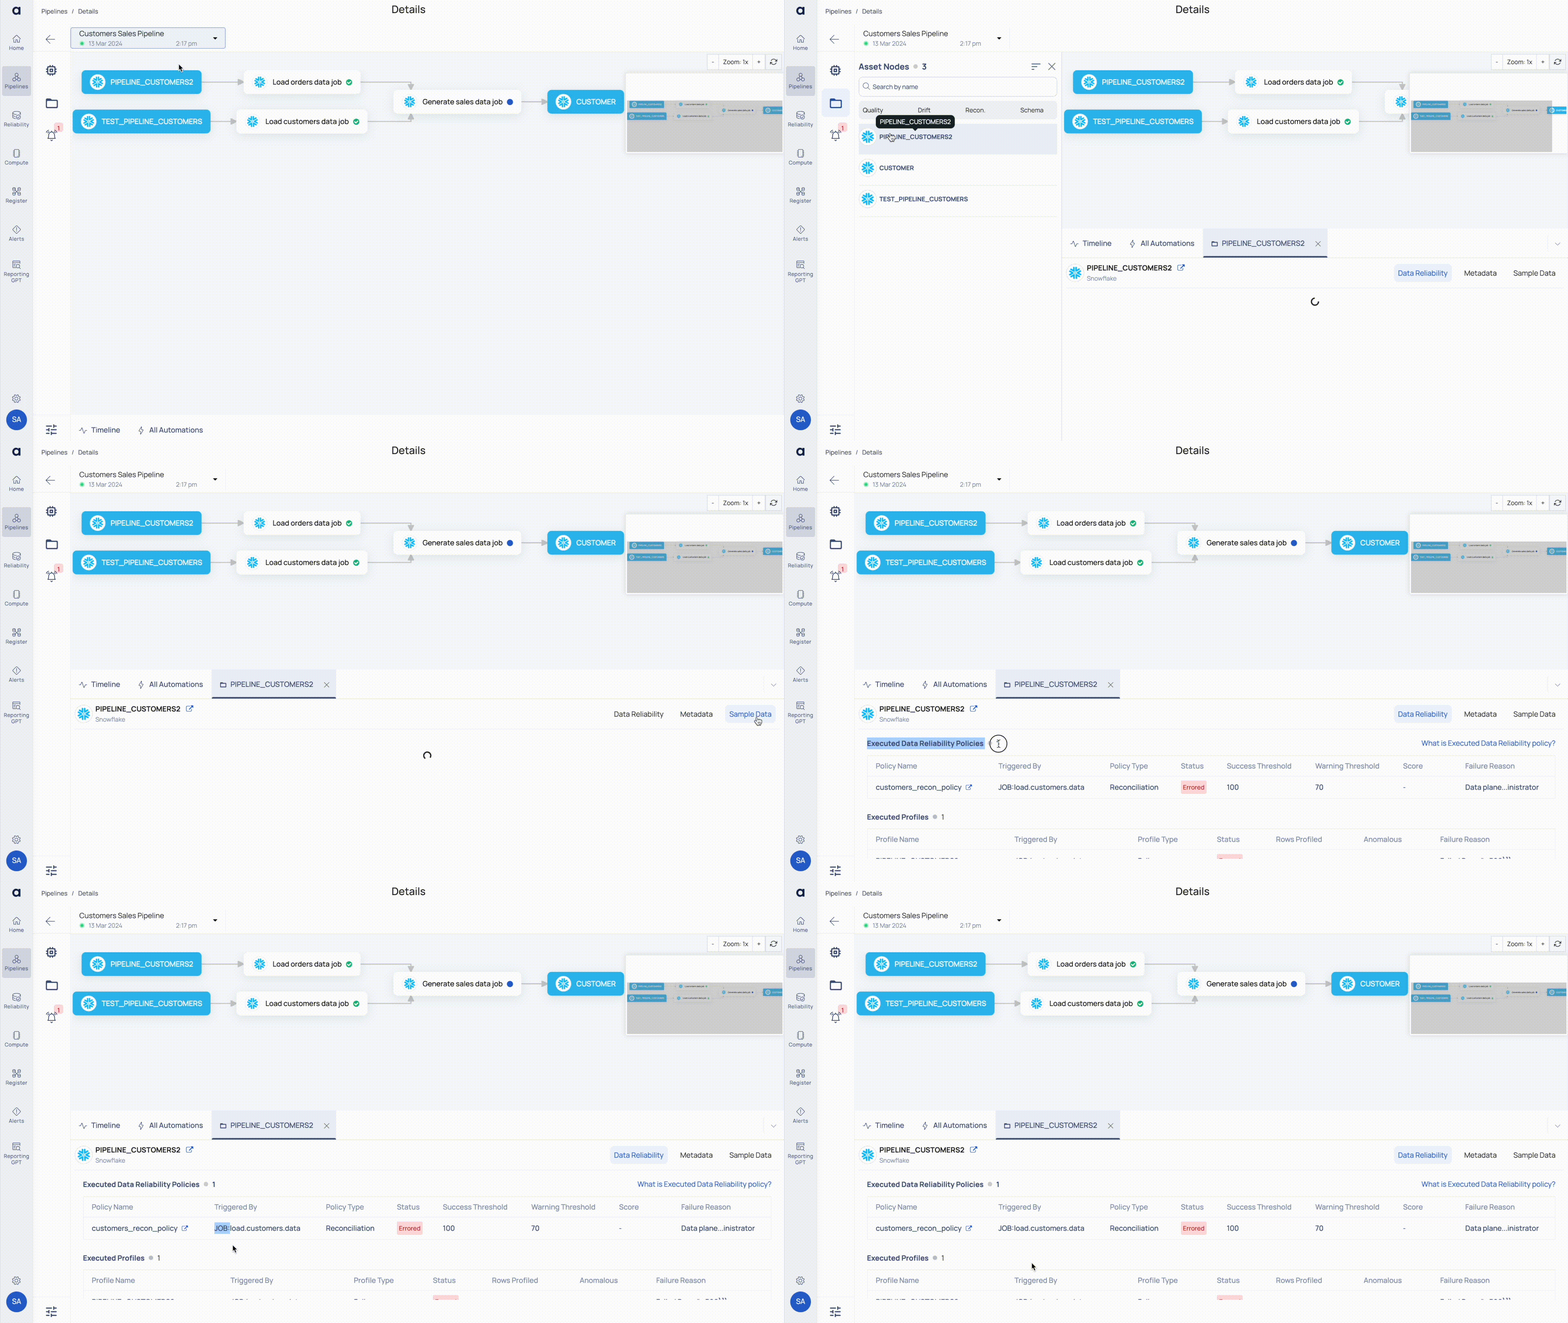
- Job Node: To access a job node, click directly on a job within the pipeline graph or select a job via the microchip icon from the list. Selecting a job node opens a new tab beside the All Automations tab at the bottom, provided no other tab is open. Information displayed in the Job node includes Data Reliability and Metadata.
- Data Reliability: This table details the automated executions of Data Reliability policies and profiles associated with the job asset.
- Metadata: Similar to the Asset Node, this tab outlines the pipeline code's location, owner details, and the team overseeing the pipeline.
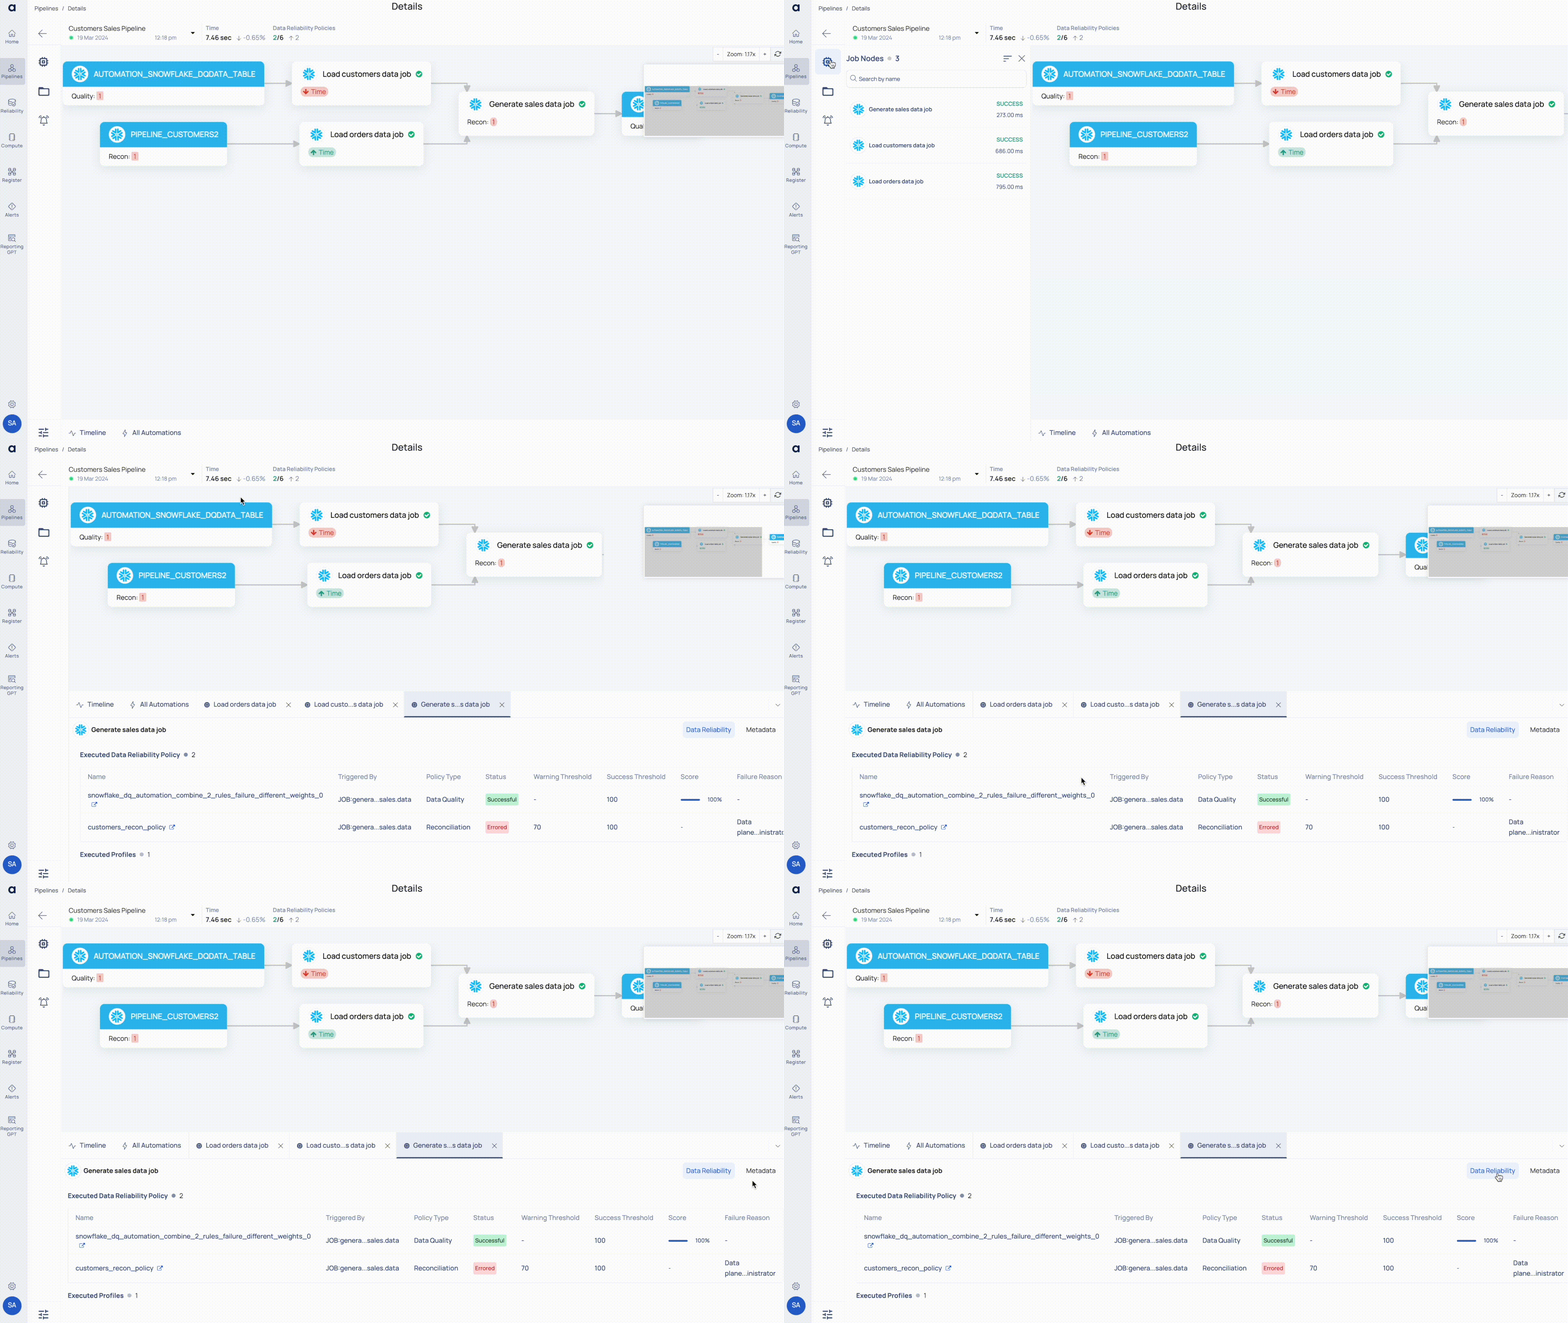
Drill Down
ADOC allows you to delve deeper into policies directly from the All Automations, Asset Node, or Job Node tables by clicking the external link icon
Compare Runs
Click the Compare Runs button in the Pipeline drop-down menu to compare two executions of the Pipeline. From the window, select the Runs from the drop-down.
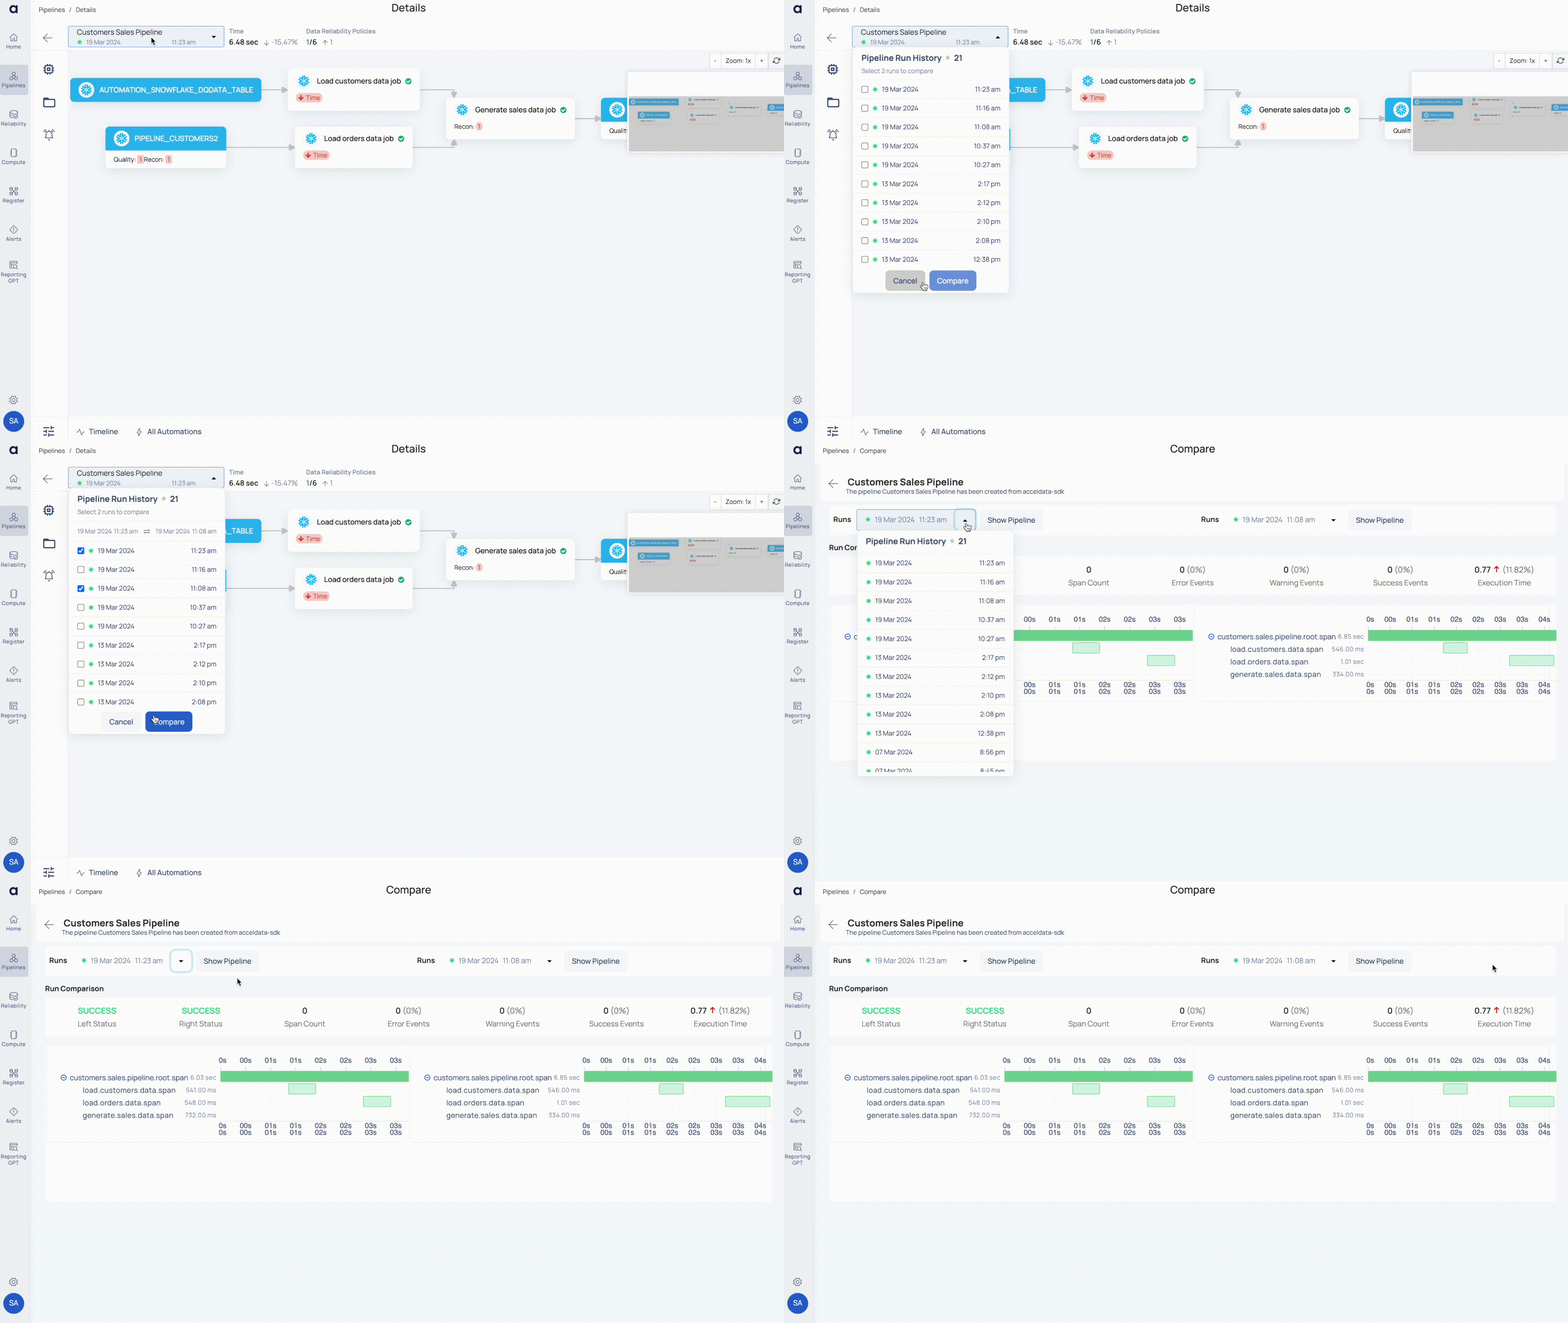
The following table describes the details of the Run Comparison panel:
| Field | Description |
|---|---|
| Left Status | Status of the run selected on left side. |
| Right Status | Status of the run selected on the right side. |
| Span Count | Number of spans defined for a particular pipeline. |
| Error Events | Number of error events. A downwards arrow implies a decline in error events. |
| Warning Events | Number of events with a warning. A downwards arrow implies a decline in warning events. |
| Success Events | Number of successful events. A downwards arrow implies a decline in success events. |
| Execution Time | Difference between the execution time of the two runs being compared. |
Pipeline Execution Time
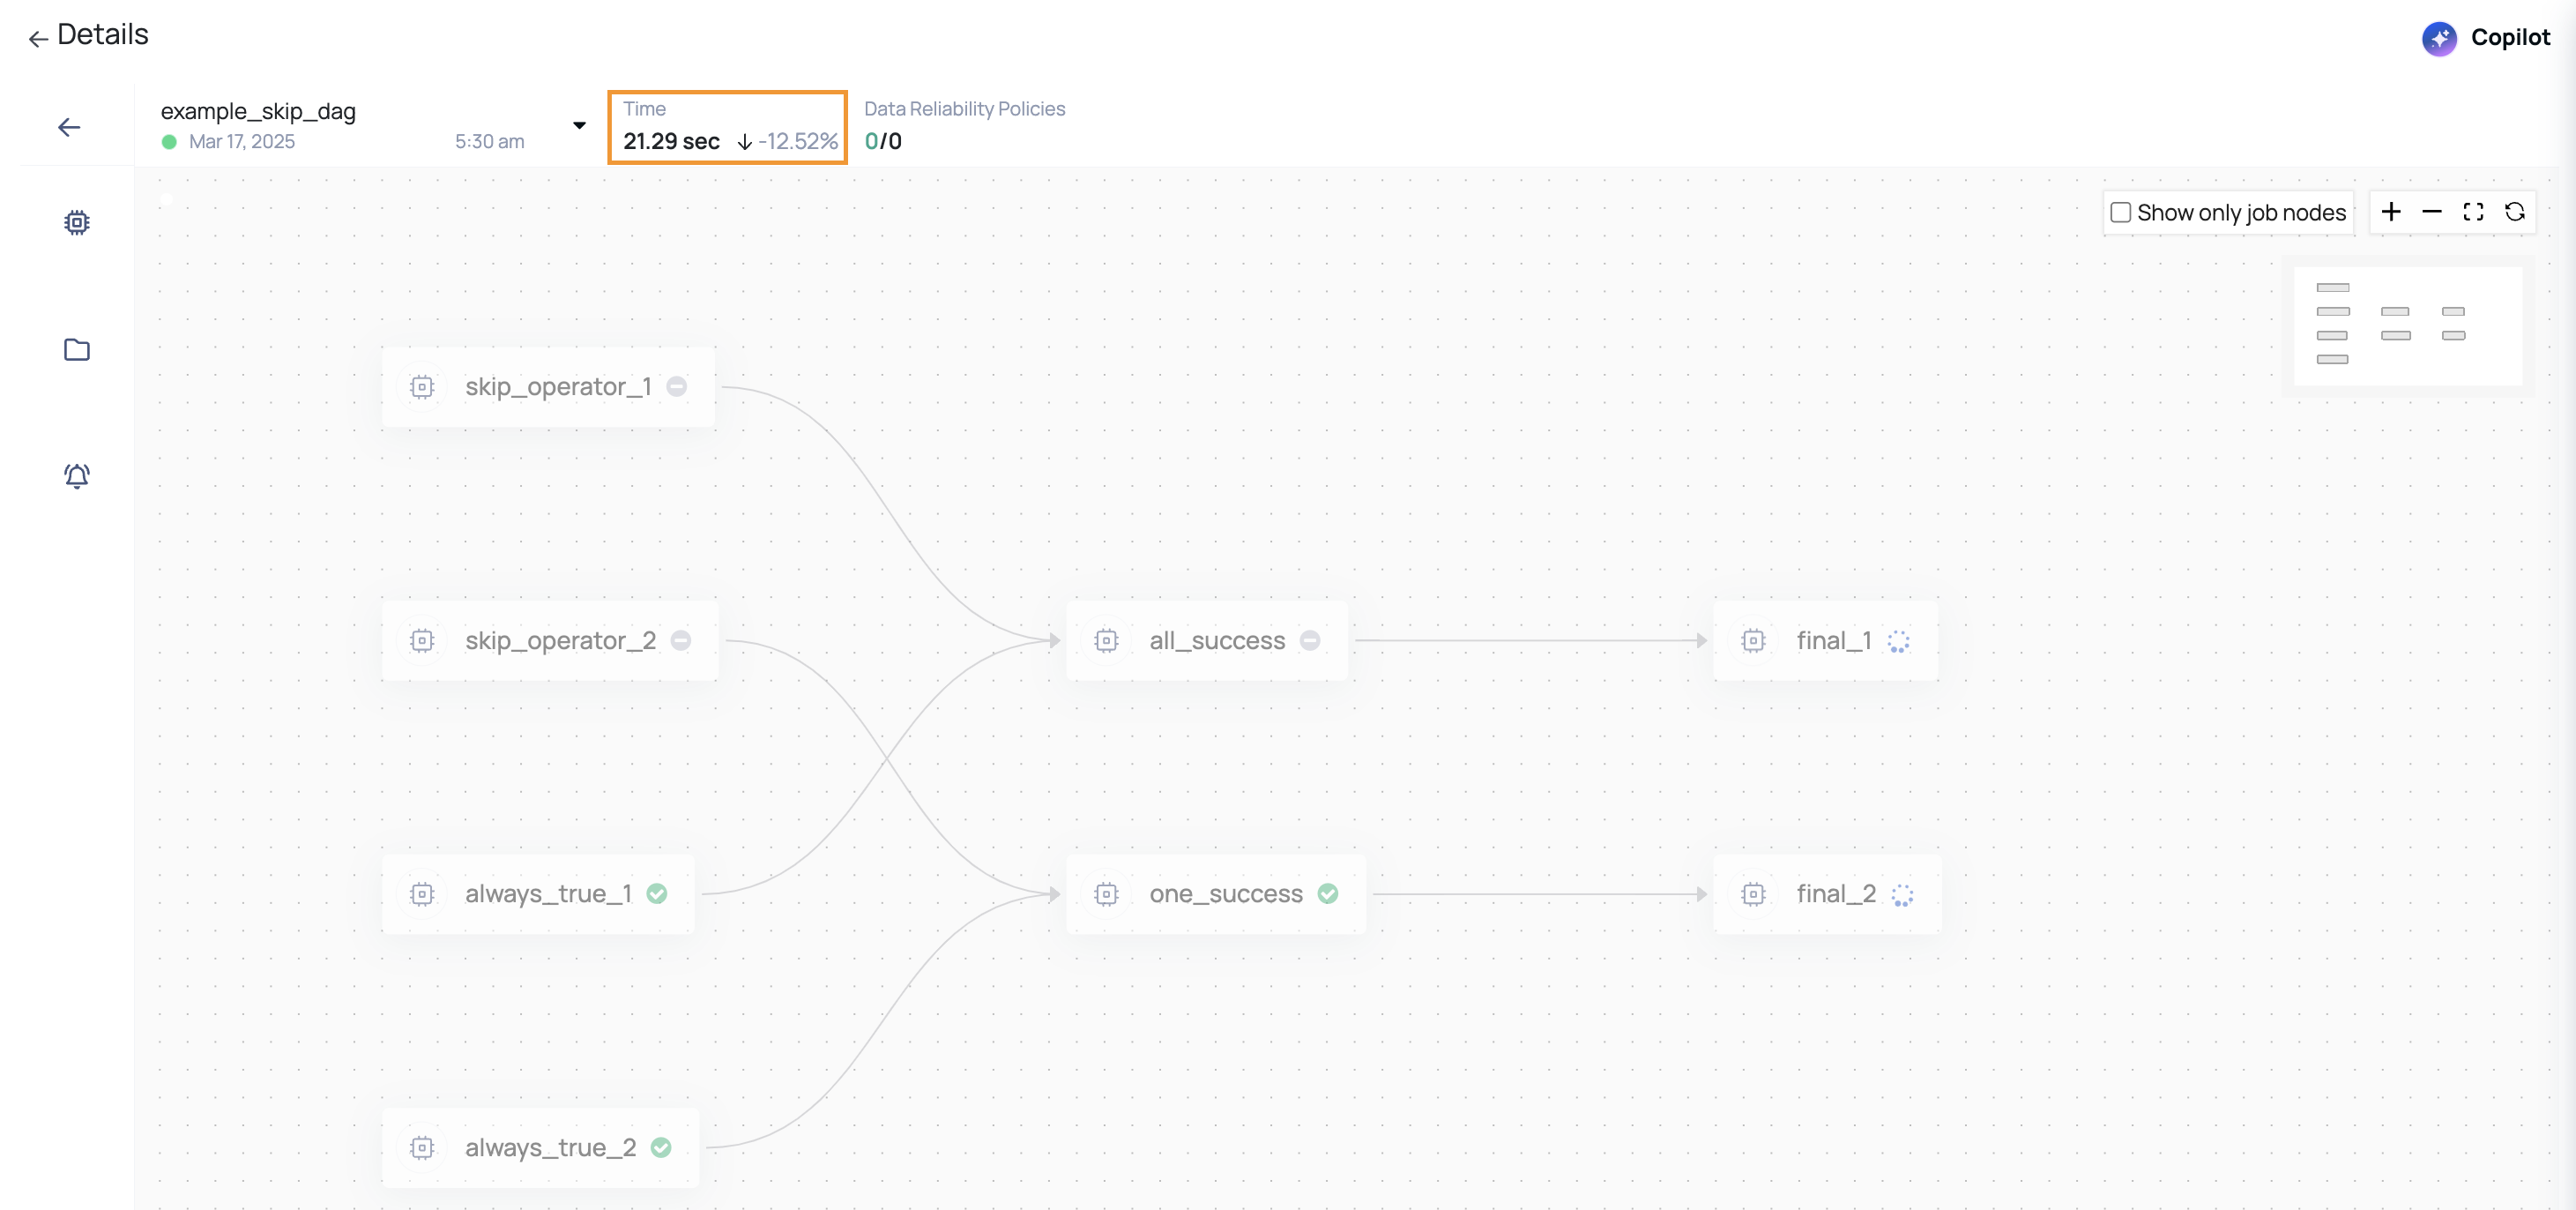
The Time section of the Pipeline detail’s view displays the pipeline execution time. You can also view the comparison of current execution time with the previous execution time. A downward arrow with a negative percentile value implies that the current run time was longer than the previous run time by the percentile value displayed. An upward arrow with a positive percentile value implies that the current run time was shorter than the previous run time by the percentile value displayed.
Data Reliability Policies
This section displays the number of data reliability polices present in the various assets of the pipelines. You can see the number of successfully executed policies out of total polices present in the pipeline assets. You can also see a comparison of increase or decrease in the number of policies, as compared to the previous pipeline execution.

By mastering the use of Timeline Spans and Pipeline Details, you can gain valuable insights into your pipeline executions and data reliability metrics. The ability to drill down into specific assets or jobs, compare runs, and monitor policy executions empowers you to optimize pipeline performance and maintain high data quality standards. Leverage these tools to enhance your pipeline management and drive better outcomes in your data processes.