Pipeline Controls
The Pipeline Controls page serves as the central configuration panel for alerts, allowing you to customize the baseline metrics according to your requirements.
To access the Pipeline Controls page, click the
Configure Comparison Baseline
In this section, you can compare the next pipeline execution with the average value of the desired number of previous executions or average value of the desired number of previous days. You can choose to include only successful pipeline executions. The result of this comparison is reflected in the Pipeline Execution Time and Data Reliability Policies section of the Pipeline detail view.
If you select Compared to average of last 10 run(s), the next execution's execution time is compared to the average value of the last 10 executions. If you select the Only include Successful runs check box, the average value of last 10 successful executions is compared against the next execution.
Configure Monitoring Policies
This section allows you to create policies on pipelines to monitor the execution time. You can set threshold for various pipeline metrics. When a pipeline exceeds its set threshold levels, an alert is generated on the Alerts section of the Pipeline detail view. You can create monitoring policy either on a Pipeline, Job, Span, of Event.
How to configure Pipeline Execution Failure settings?
In this section, you can configure the following settings. You must click the Edit button to configure the settings.
- Create Incident: Select this toggle switch to create the incident when the threshold level is breached.
- Incident Name: Select a name for the incident when it is generated. This name is displayed on the Alerts section of the Pipeline detail view.
- Severity: Select the severity level of the alert.
- Notification Channels: Select the notification channels to whom the alert notification must be sent. To learn more about Notification Channels, see Notifications.
Click Save to save the settings.
How do I create a Monitoring Policy?
You can create a monitoring policy either on a Pipeline, Job, Span, Event. You must select a metric on which the policy must be created and set the threshold levels. When the metric exceeds its threshold levels, an alert is generated in the Alerts section of the Pipeline detail view.
Click Add Monitoring Policy to add a new monitoring policy and select either Pipeline, Span, Job, or Event option. The monitoring policy is created on the selected option. If you select, Job or Span option, you must also select the Job or Span from the list on which the monitoring policy must be created. For a pipeline, the pipeline name is automatically populated.
Click the Add Metric button to add a metric.
- To configure metrics for pipeline, job, or span types, select the corresponding metric such as duration, start time, or end time and then proceed to step 3.
- To configure metric-type Events, select a monitor from the drop-down list or input the span. Next, select a metadata key from the provided list or enter a custom metadata key. Toggle between number or string options depending on the data type of the event. If the event is of type number, proceed to step 3. If it is a string, skip step 3 and proceed from step 4.
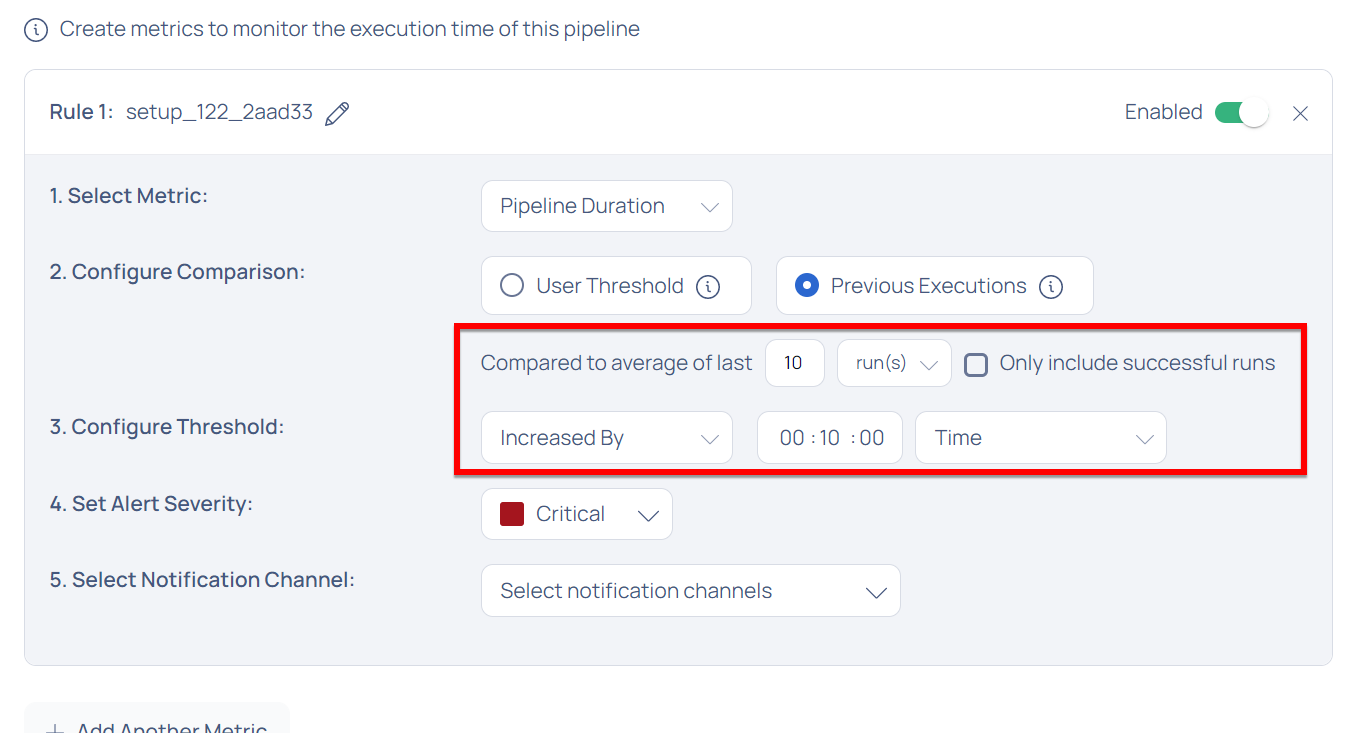
In the Configure Comparison section, select either User threshold or Previous Executions. If you select User threshold, you must define a custom threshold for the pipeline execution duration. This threshold can be above or below a certain time limit. If the Pipeline execution exceeds the set threshold, an alert is triggered.
If you select Previous Executions, you must select either the average value of desired number of previous executions or average value of desired number of previous days with which the next execution must be compared. You can also select only successful executions for comparison. You must then configure the Configure Threshold section accordingly.
In the following example, the next pipeline execution time is compared with the average value of last 10 execution times. If the next execution time exceeds the average of last 10 execution times by 10 minutes, an alert is triggered.
If you have selected either Pipeline End Time, or Pipeline Start Time metric in the Select Metric field, in the Configure Threshold field you must select the frequency of Runs. This can either be minute, hourly, daily, weekly, monthly, or yearly.
- Set the alert severity in the Set Alert Severity field.
- Select the notification channels in the Notification Channels field.
- Ensure that that the Metric is Enabled.
- Click Save.
Automated Data Reliability
The Automated Data Reliability option in ADOC allows you to automatically execute profiling, data quality, and reconciliation policies from a pipeline, reducing the complexity of pipeline monitoring, allowing you to understand reliability in the context of the pipeline run, and offering the ability to take direct action in the pipelines.
If a policy is configured to run on a schedule, attempting to configure data reliability automation for that policy will not be possible and will lead to an error.
Steps to Add the Automations
To configure the pipeline, perform the following:
- From the left main menu, click Pipelines.
- Select the pipeline name for which you want to automate data reliability. The pipeline details page is displayed.
- Click the
Pipeline Controls button in the bottom left corner of the page. The Pipeline Controls page is displayed. - Click the Automated Data Reliability option to view its panel.
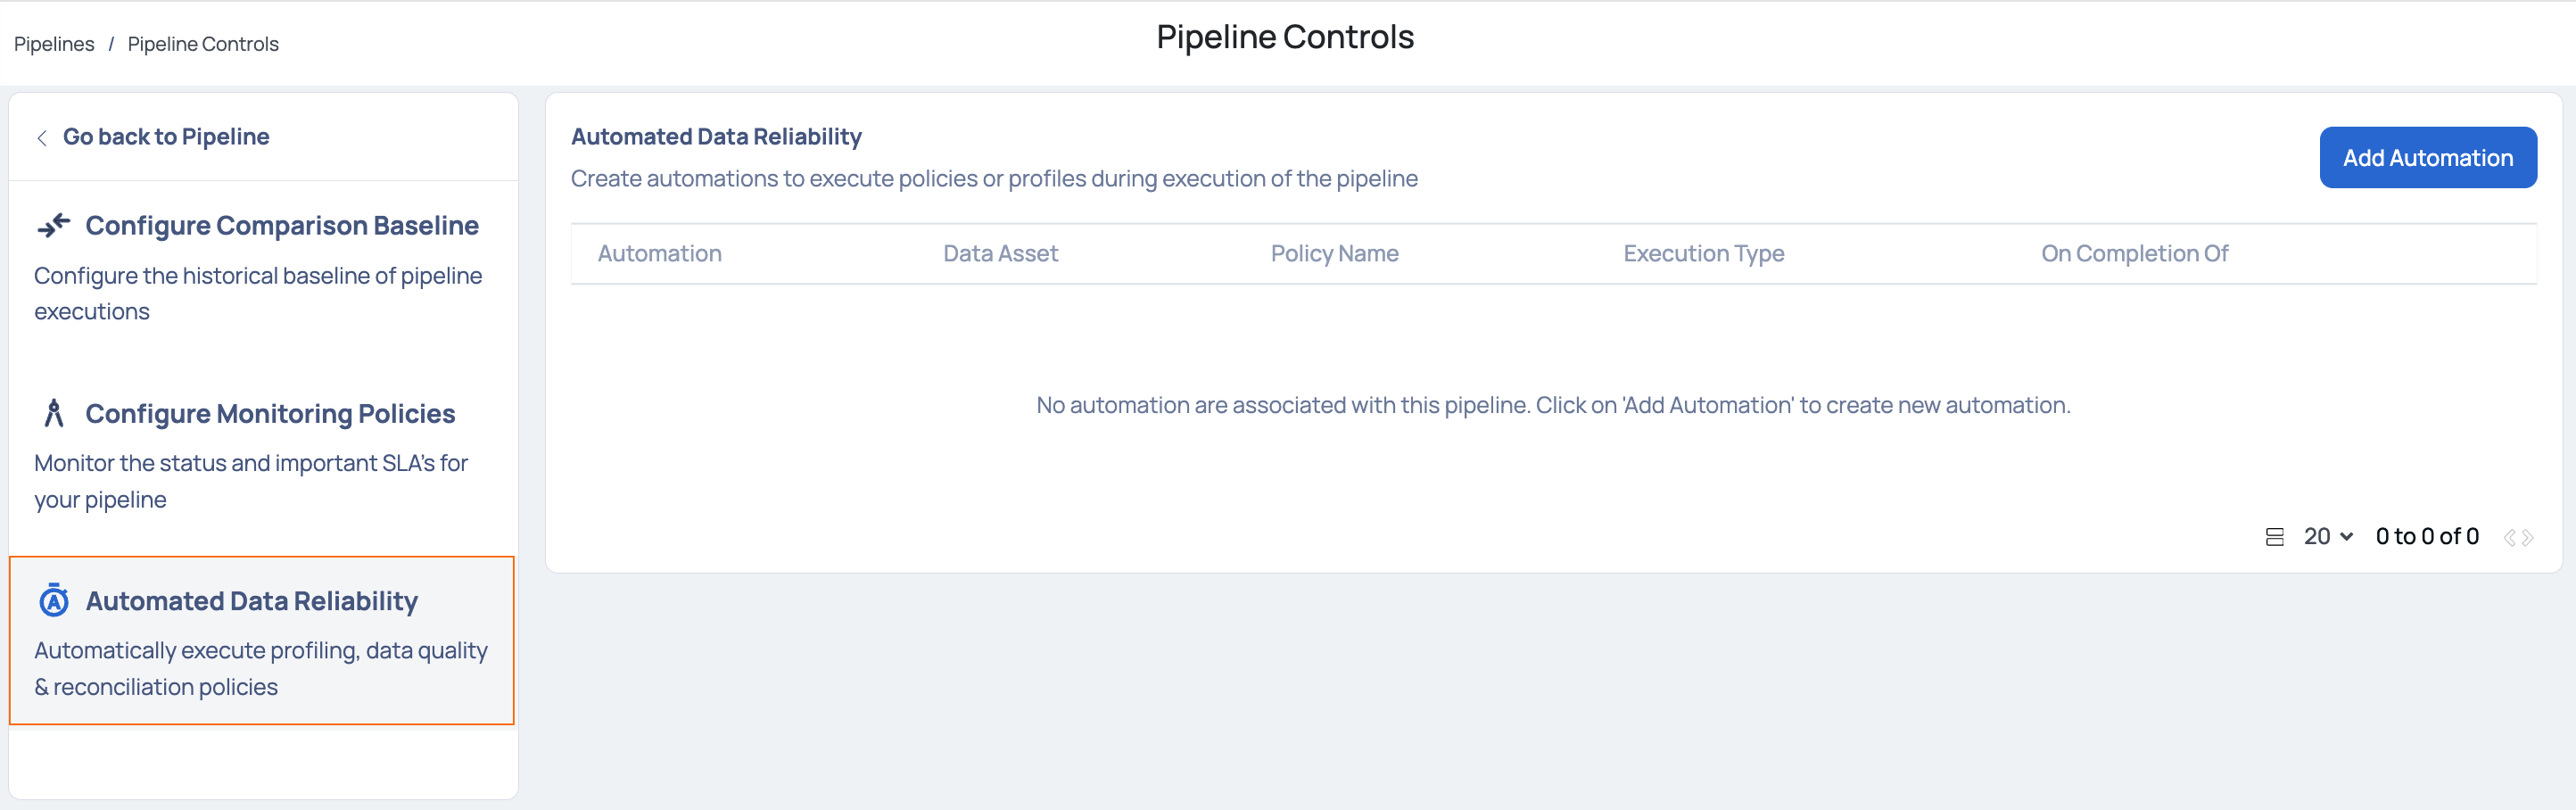
- Click the Add Automation button. The Setup Data Reliability Automation panel is displayed.
- Select or enter the following data:
| Field Name | Description |
|---|---|
| Execute the automation on completion of | Select one of the following options to execute the automation upon its completion:
You must also select one of the following trigger events on which to execute the automation:
|
| Select a Job Name | This input is only required if you want to execute the automation after completing a job. |
| Select a Span Name | This input is only required when you want to execute the automation upon the completion of a span. |
| Automation Type | Select one of the following automation types:
|
| Select a policy (or) Select an asset | The dropdown list permits you to search for a policy from the last 10 runs of the pipeline run history. Enabling the Search all policies toggle extends this search capability to include any policy. Likewise, when you have designated the automation type as Profiling, you can choose an asset from the last 10 runs of the pipeline run history. Enabling the Search all assets toggle broadens this search capability to encompass any asset. |
| Select Execution Type | Select one of the following types of executions to be performed:
|
Only one automation can be created for a specific policy or asset. Attempting to create more than one will result in an error message upon saving the automation.
- Click the Save button.
Viewing Automations
After saving your automation settings, go to the Pipeline Details page to see them. At the bottom, select the All Automations tab.
The All Automations tab shows details for all configured automations, organized by automation type. These details focus on Data Reliability.
Executed Data Reliability Policies
This tables showcases the data reliability policies that have been executed directly within the pipeline.
| Column Name | Description |
|---|---|
| Name | Name of the policy on which the automation was configured. |
| Triggered By | The trigger option is based on the type of event, such as a pipeline run, job, or span. |
| Policy Type | The type of policy selected for automation. |
| Status | Displays the status of the automation executions, such as successful or error. If the policy has been violated, you can view the error on the pipeline graph or on the alerts page. |
| Warning Threshold | The policy execution's warning threshold value. |
| Success Threshold | The success threshold value of the policy execution. |
| Score (or) Failed Reason | The score of the policy run. |
| Failed Reason | If the automation execution failed, then this column displays the reason for why it did. |
Executed Profiles
| Column Name | Description |
|---|---|
| Profile Name | Name of the policy on which the automation was configured. |
| Triggered By | The trigger option is based on the type of event, such as a pipeline run, job, or span. |
| Profile Type | The type of profile selected for the automation: Full or Incremental |
| Status | The status of the automation executions, such as successful or errored. |
| Rows Profiled | The number of rows profiled. |
| Anomalous | Displays any outliers found on profiling the asset. |
| Score | The score of the profile run. |
| Failed Reason | If the profile execution failed, then this column displays the reason for why it did. |