
This page explains what AIO is, who it's for, and where to start.
AIO is Acceldata's observability product for applications that call large language models (LLMs) or run agents. You instrument your application, and AIO shows what it did: each conversation, each request, and each step inside a request. If you build or run LLM or agent applications, AIO helps you see how they behave and catch problems.
AIO organizes everything you see into these parts:
- Projects scope your traces, evals, and rules. The Sessions, Traces, and Spans pages and a project's own pages show one project over one time range. The Home page summarizes all the projects you can access.
- Sessions are conversations. A session groups the traces that share a conversation ID.
- Traces and spans are the OpenTelemetry data your application sends. A trace usually covers one unit of work, such as a chat turn, a workflow run, or a scheduled job.
- Rules are per-project checks that evaluate the telemetry AIO captures.
- Evals measure the quality of your application's output.
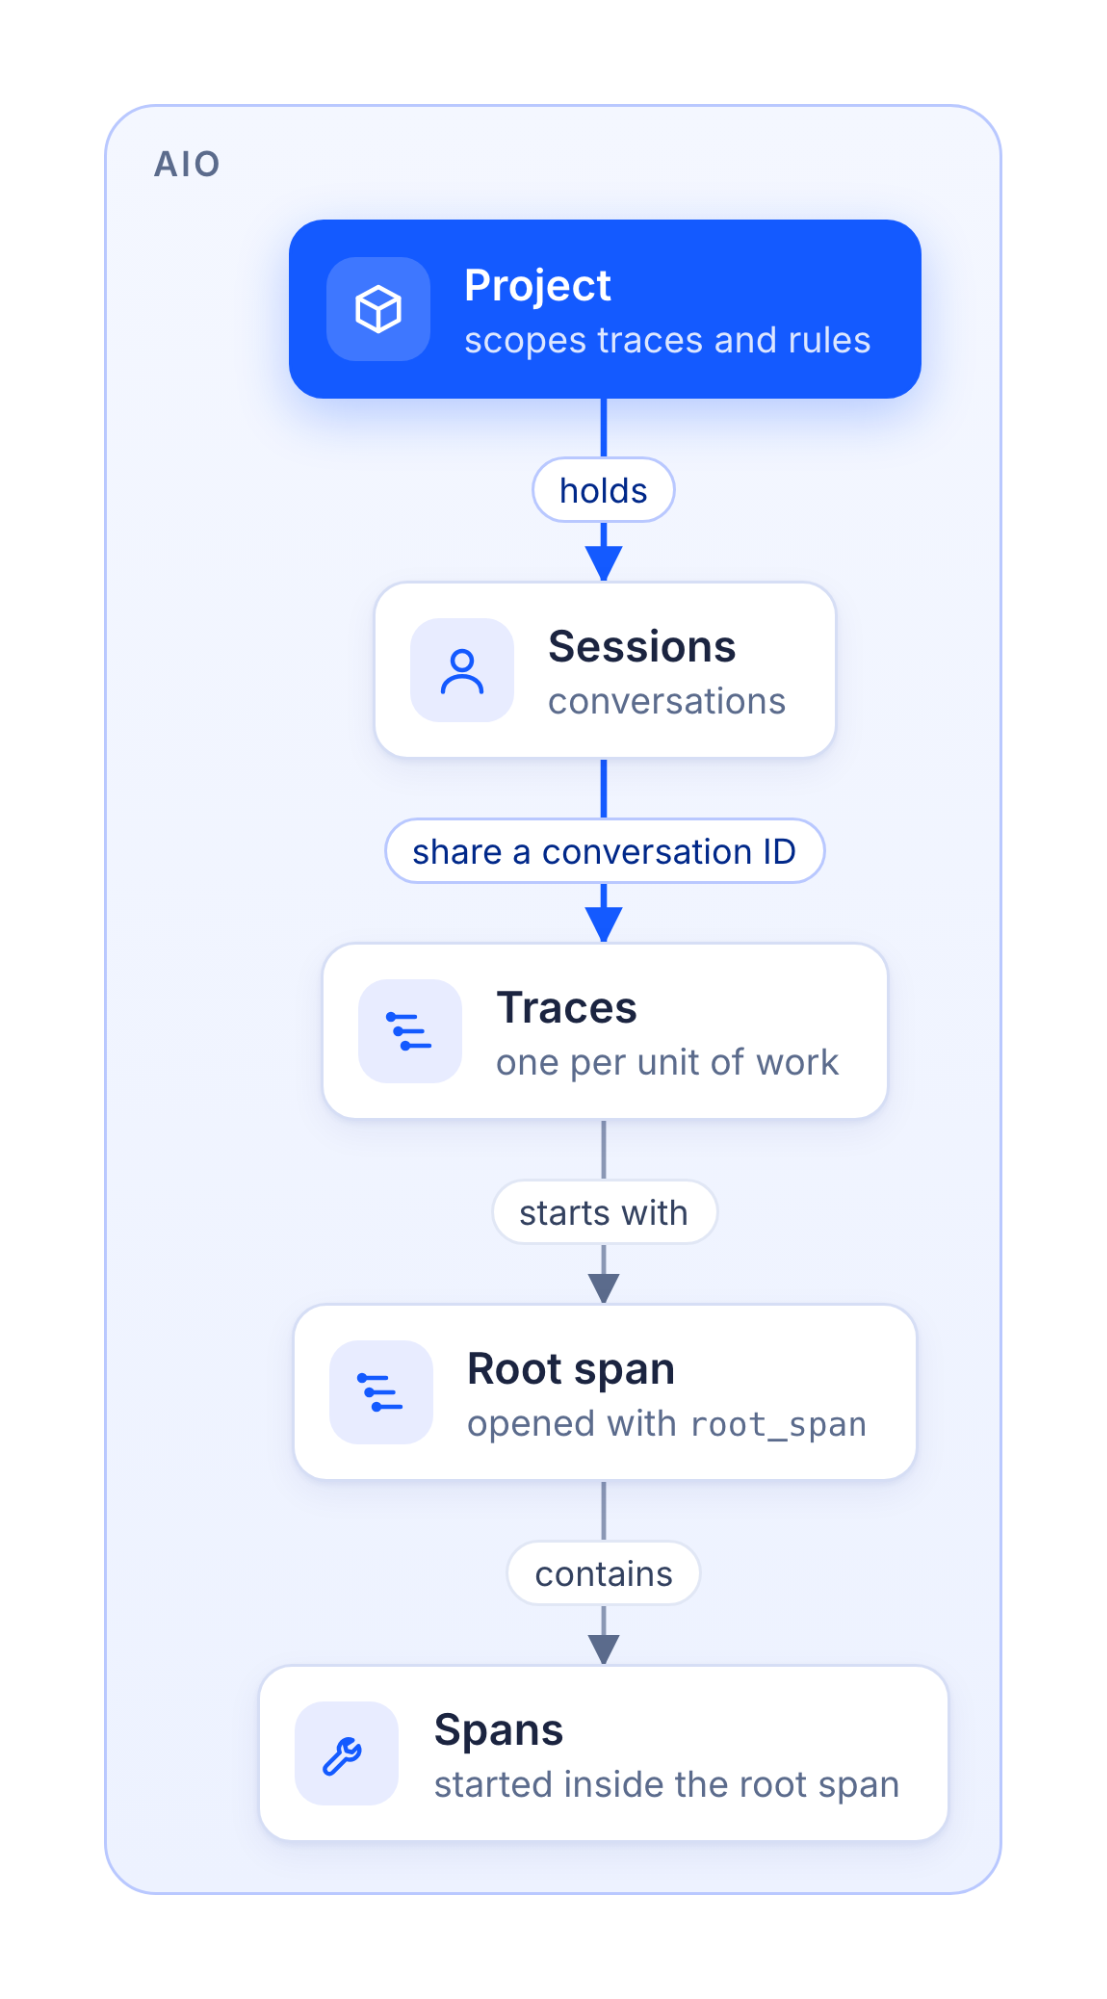
For definitions of these and other terms, see the Glossary.
How it works
- Sign in and start from Home. AIO opens at the Home page. It summarizes cost, tokens, LLM calls, models, sessions, users, rules, and failed traces across the projects you can access. For details, see Home dashboard. From Home, select the project count under the greeting to open the Projects list, which lists the projects you can view. For each project, it shows totals for the selected time range, such as traces, sessions, tokens, and errors.
- Create a project. A project holds your application's telemetry. To create one, you need permission to manage resources. For the steps, see Create a project. To start with a sample application instead, see Start from a sample app.
- Connect your application.Create an API key for the SDK, then instrument your code with the Python SDK, acceldata-aio-tracer. The SDK sends OpenTelemetry data that's tagged with your tenant and your project. On the Projects page, the connection icon in a project's row opens that project's Connection Info page. If you already use OpenTelemetry or OpenLIT, send traces through OpenTelemetry or OpenLIT instead.
- Explore your telemetry. Select a project name to open the project. Inside a project, the tabs are Overview, Sessions, Traces, Spans, Rules, and Quality coverage. You see the Rules tab only if you can view the project. For details, see Explore traces and Check quality coverage. To learn how the menu, tabs, and time range work, see Find your way around.
- Check your application automatically. Set up rules to evaluate the telemetry in a project, and evals to measure output quality.
Have a suggestion?