
This page shows you how the AIO UI is laid out, so you can move between projects, telemetry, and rules without getting lost.
The Sessions, Traces, and Spans pages and a project's own pages each show one project over one time range. Home is different. It summarizes every project you can access. Once you know where the project and the time range are set, and how the menus and tabs connect, every page works the same way. Both the project and the time range are kept in the page URL, so a link you share opens the same view for the person who receives it.
How it works
Start at Home
AIO opens at Home, which summarizes cost, usage, sessions, users, rules, and failed traces across all the projects you can access. To learn what each part of Home shows, see Home dashboard.
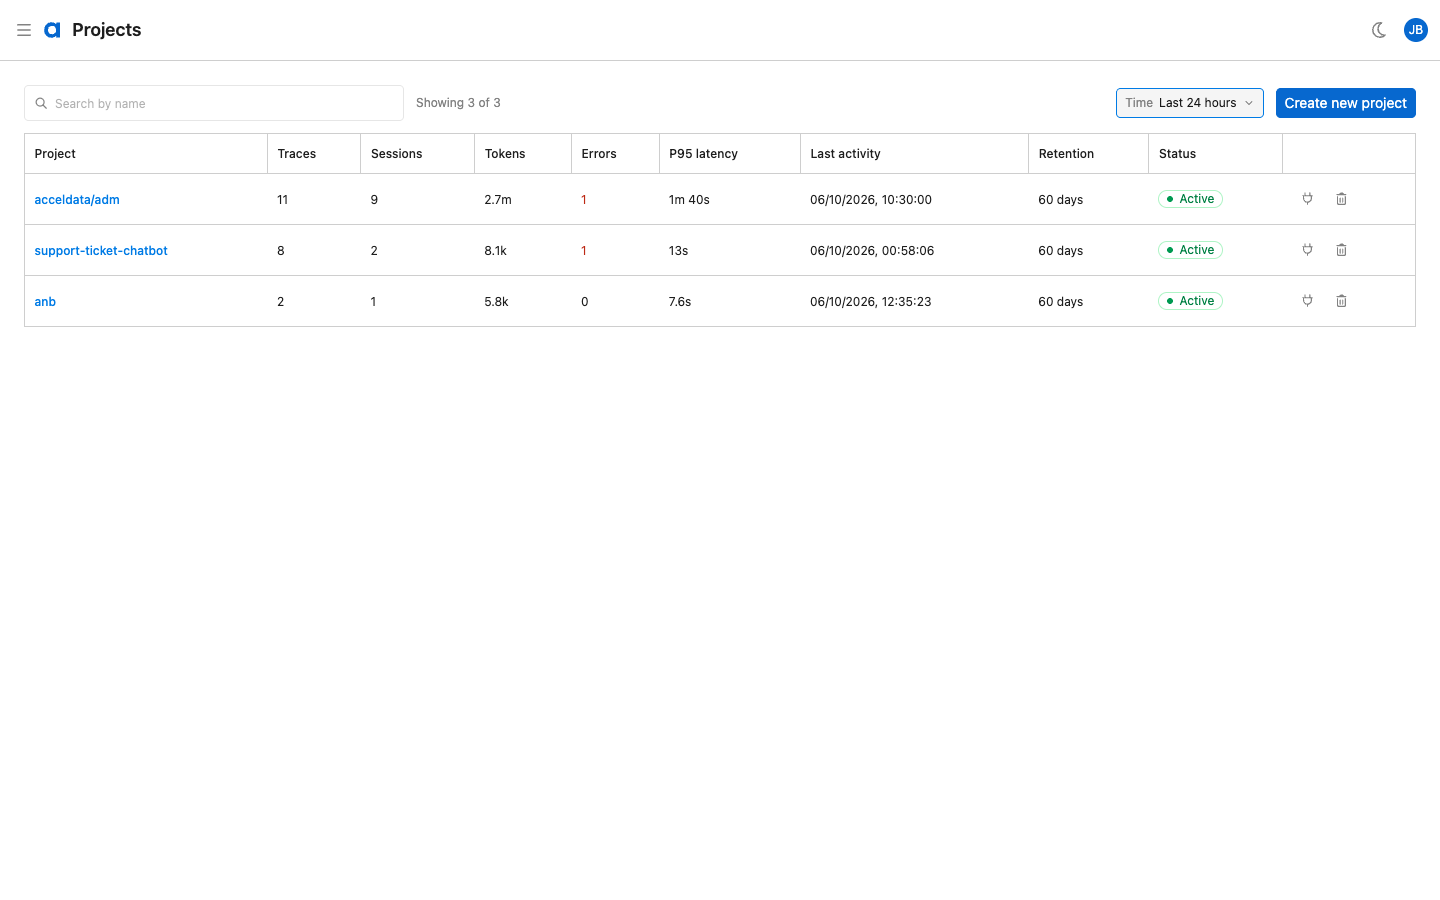
To work with one project, go to the Projects list. You can get there from the project count under the greeting on Home, from the navigation menu, or from the Projects item in the breadcrumb trail. The list shows the projects you're allowed to view, with totals for traces, sessions, tokens, errors, and latency over the selected time range. Select a project name to open that project's page. To find a project, enter part of its name in the Search by name box.
Use the top bar
The top bar runs across every page. From left to right, it holds:
- The menu button. It opens the navigation menu.
- The Acceldata logo. Select it to go back to Home.
- The breadcrumb trail. It shows where you are, for example "Projects › Support bot › Traces". The last item is the page heading. Select any earlier item to go to that level, or select the ← arrow to go up one level. Breadcrumb links keep your project and time range.
- The theme button. Select Switch to dark mode or Switch to light mode. Until you choose, AIO follows your operating system's setting, and it remembers your choice in this browser.
- Your avatar. It opens the user menu.
Tabs, the project picker, the Time selector, search, and filters aren't in the top bar. They're part of the page itself.
Open the navigation menu
Select the menu button at the far left of the top bar to open the navigation menu. It slides in over the page. The menu is the same one other Acceldata apps use, so it can take you to other Acceldata apps as well as to AIO pages. It highlights the area you're in, even on a project's pages. For example, a project's traces highlight the Traces entry, and a project's own page highlights the Projects entry.
What happens when you choose an entry depends on the entry:
- An AIO entry opens that page in AIO.
- An entry for another Acceldata app loads that app in the same browser tab.
- An entry set to open in a new tab opens in a new browser tab.
Switch between a project's tabs
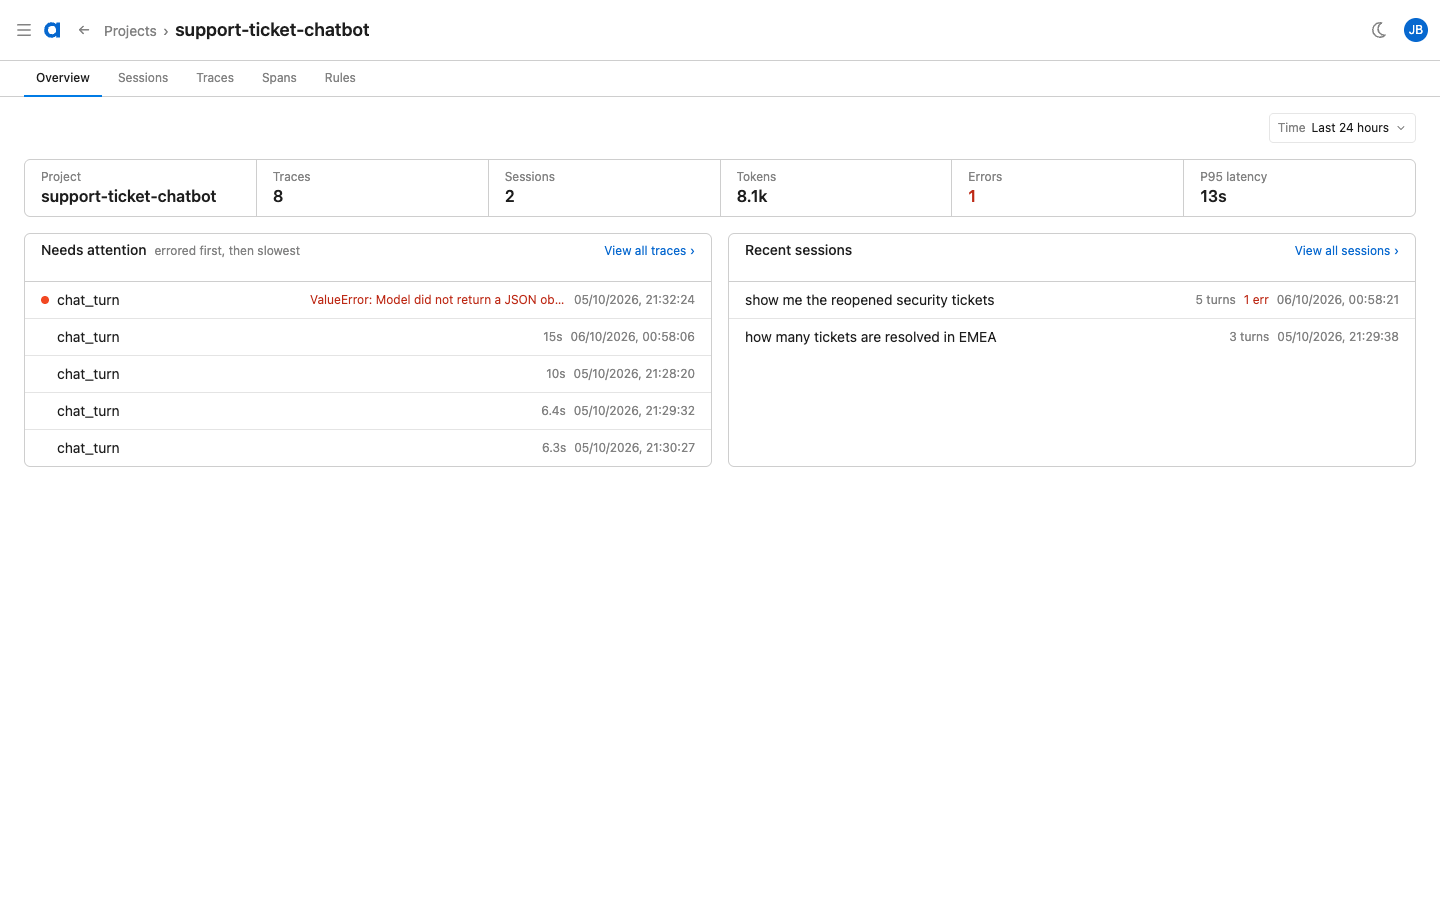
When you open a project, a row of tabs appears at the top of the page: Overview, Sessions, Traces, Spans, Rules, and Quality coverage. Overview summarizes the project, with its totals, the traces that need attention, and recent sessions. The Sessions, Traces, Spans, and Rules tabs list the project's sessions, traces, spans, and rules. Quality coverage shows the data the project's agents use. For details, see Check quality coverage.
The Rules tab appears only if you're allowed to view the project's rules. For details, see Project permissions.
When you switch tabs, your time range and any filters come with you. From Overview, only the time range carries over.
Choose between shared and per-project pages
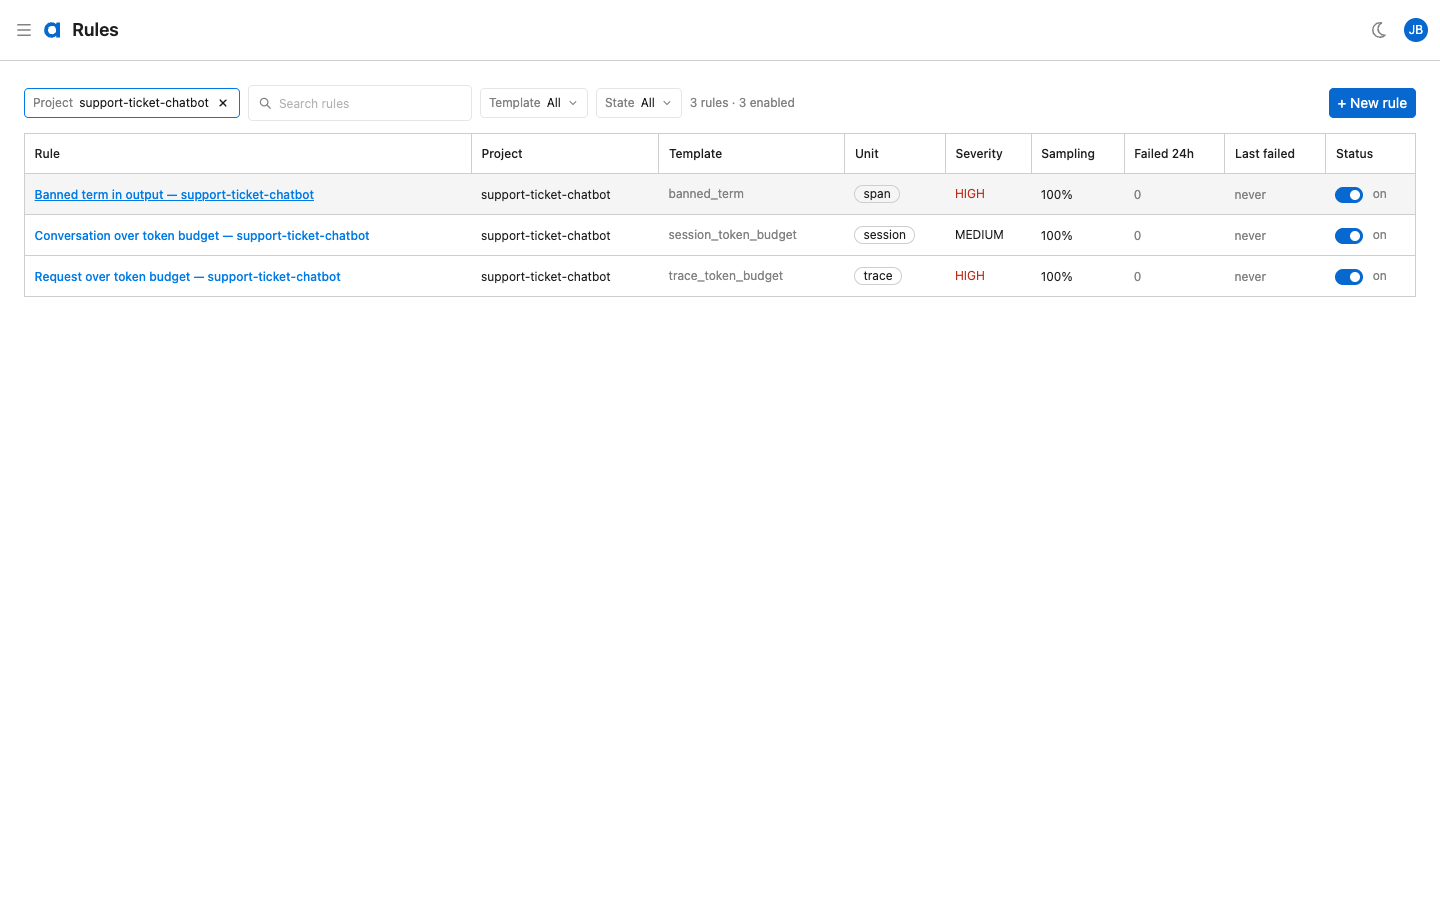
The Sessions, Traces, Spans, and Rules pages each exist in two versions. The URL decides which one you're on.
Per-project version | Shared version | |
|---|---|---|
Where you find it | Inside a project, under | At the top level, for example |
How the project is chosen | Fixed by the page you're on | With the Project picker on the page |
Tab row | Includes Overview, Rules, and Quality coverage | Sessions, Traces, and Spans only. The Rules page has no tab row. |
Quality coverage has only the per-project version.
On a shared Sessions, Traces, or Spans list, nothing appears until you choose a project. The page shows "Pick a project to see traces". Choose a project from Project, or select Browse projects to choose from the Projects list and come back to the page you were on. Choosing a project keeps your time range.

On the shared Rules page, the Project picker starts at All projects.
If a link names a project that doesn't exist in your account, the page says so, for example "No project called “support-bot”". Select Pick a project to go to the Projects list.
Set the time range
The Time selector sets the window that every list and total counts over. It's on Home, on the Projects list, on a project's Overview, on the Sessions, Traces, and Spans lists, and on Quality coverage.
Choose one of these options:
- Last 15 minutes
- Last hour
- Last 24 hours, the default
- Last 7 days
- Last 30 days
- Last 60 days
- Last 90 days
Home offers only Last 24 hours, Last 7 days, Last 30 days, and Last 90 days, and it starts at Last 30 days. If you arrive at Home with a range it doesn't offer, such as Last 15 minutes, Home switches to Last 30 days.
The window always ends now, and there's no all-time option. A range is always set, so you can't clear it. Ranges longer than the project keeps its data are listed but turned off, marked "beyond retention". When no project is chosen, none of the ranges is turned off. To learn how long data is kept, see Data retention.
Your choice carries over as you move between a project's Overview, its lists, and the pages you open from them. To run a list's query again with fresh data, select Refresh.
Use the user menu
Select your avatar at the right end of the top bar to open the user menu. The avatar shows your initials, and the menu shows your name at the top.
- Select My Profile to open your Acceldata user profile.
- Select Logout to sign out.
At the bottom of the menu, you'll find version details: the server version, the UI version, and the build date. Include them when you report a problem.
Have a suggestion?