About the Nodes Page
Initial Analysis of Nodes
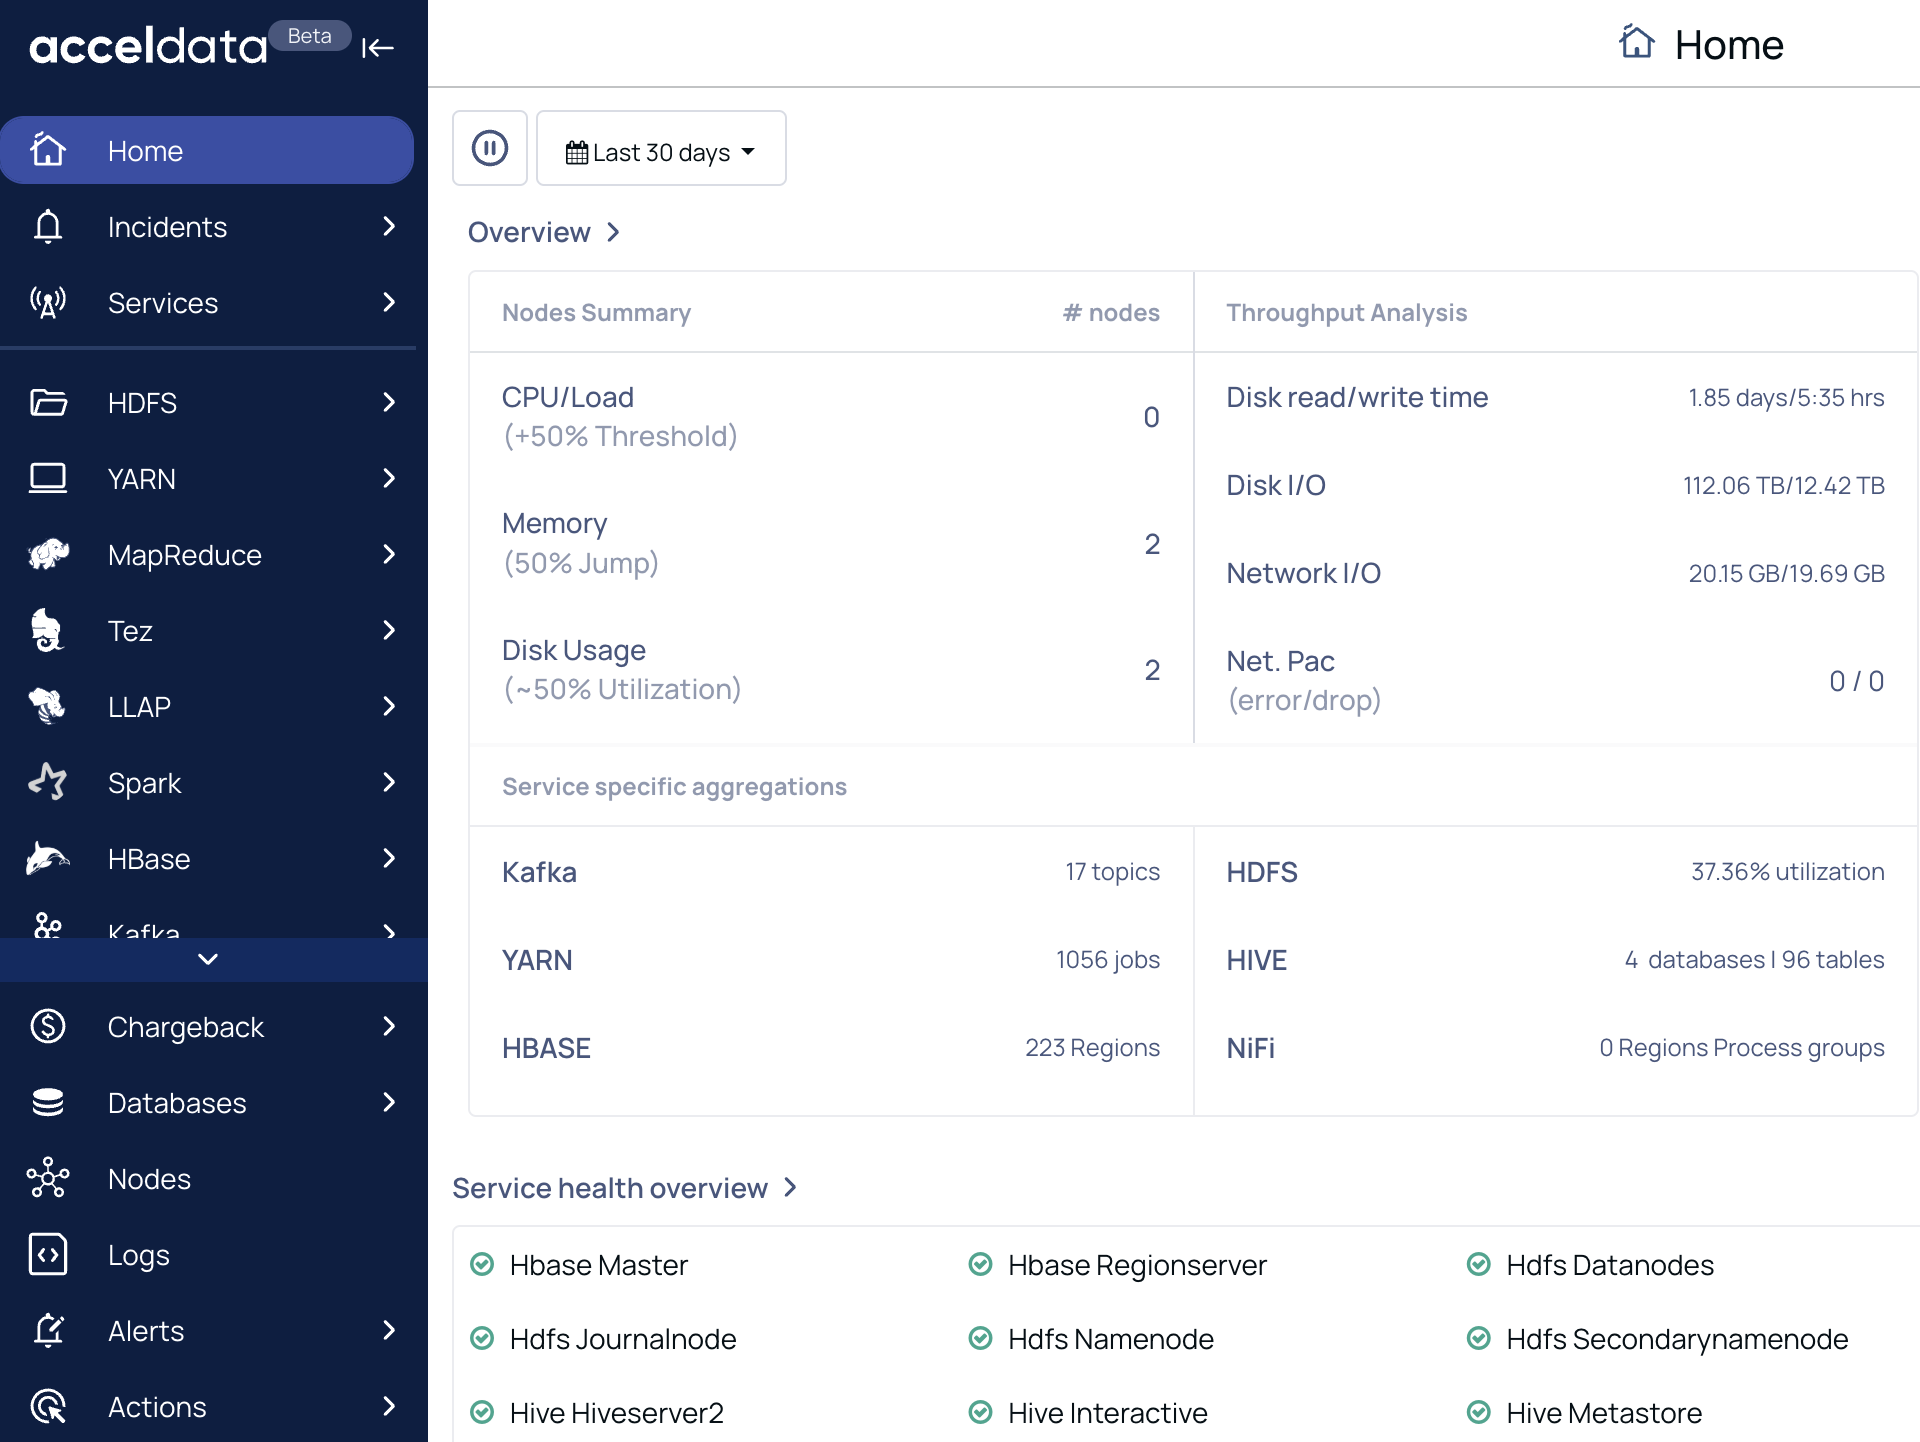
For the initial analysis of Nodes, navigate to the Pulse UI Home page, and under Overview, you can find the following capabilities that describe the health of the nodes:
Nodes summary — Displays the following details:
- The count of nodes where the number of nodes with CPU load exceeds the +50% threshold.
- The count of nodes where memory usage has increased significantly (by 50% or more).
- The count of nodes with disk utilization is around 50%.
Throughput Analysis — Displays the following throughput analysis details:
- Disk read/write time — shows the total time spent on reading and writing operations to the disk on nodes. A shorter time indicates faster disk performance.
- Disk I/O (Input/Output) — shows the amount of data read from and written to the disk on nodes. A higher value suggests heavy disk usage.
- Network I/O — shows the amount of data sent and received over the network. This measures network activity and bandwidth usage.
- Network packets — shows the number of packets transmitted over the network, including any errors or drops. Zero errors or drops indicate a stable and reliable network connection.
Service-specific aggregation — displays the summarized data or metrics specific to individual services with a larger data ecosystem. For example, you might be using services such as Kafka, HDFS, YARN, HBase, etc. for various purposes in your ecosystem. The Pulse service-specific aggregation capability summarizes the metrics of these services, such as the number of active topics in Kafka, the utilization percentage of HDFS, the number of jobs in YARN, etc. These metrics quickly help monitor and assess the cluster's health without checking the detailed logs or configurations.
Service health overview — This displays the list of services running on your ecosystem and their status as up or down.

Comprehensive Analysis of Nodes
For the comprehensive analysis of Nodes, click Overview. The Nodes details page shows the following capabilities:
- The Services running on Nodes — Displays the list of services running on nodes with details, including on how many nodes the service is active and inactive. For more information, see Services Running on Nodes.
- The Node details — Displays the metrics details such as CPU and Memory Usage, IO Usage, Network Usage, Disk Usage, etc. For more information, see Node Details.
- The Node Aggregated details — Displays aggregated usage of the CPU, Memory, Input/Output, Input/Output Time, and Disk metrics of the nodes that you selected to compare. For more information, see Node Aggregation Details.
Overall Tab
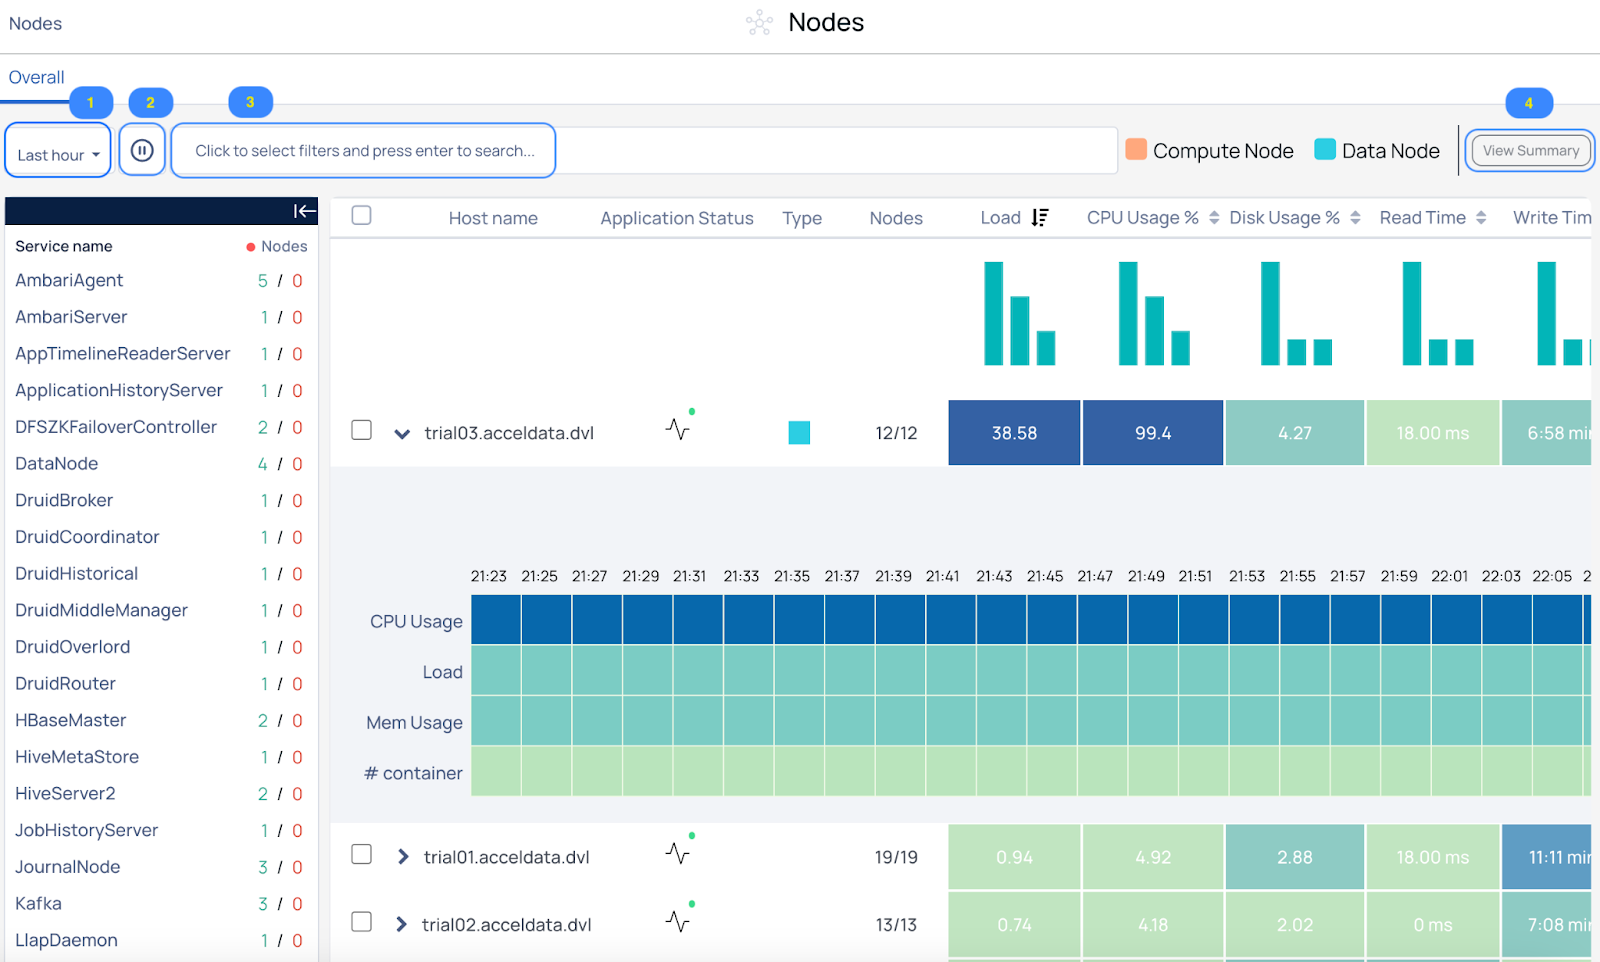
The overall tab provides the following functionalities.

| Sr.No | Functionality | Description |
|---|---|---|
| 1 | Timestamp | Choose an option to select a time period (For example, Today, Last 12 hours, Last 3 Months, etc.) or choose a “custom date and time” of your choice and click Apply. |
| 2 | Refresh the status | Click the ⏵ (Play) and ⏸ (Pause) buttons at the top left of the page, to toggle between play and pause respectively. Click the Play button to refresh the cluster status every ten seconds and the Pause button to temporarily stop the refresh. |
| 3 | Search for records | Click on the Search bar and select the required parameters from the drop-down menu for the value you are searching for. For more information, see Search for Jobs or Records. |
| 4 | View Summary | Select two or more nodes from the Overall tab to check the aggregated summary details of nodes, and click the View Summary button. The aggregated details for the selected hosts are displayed on the [Node Aggregated Details](Node Aggregated Details) page. |
Search for Jobs or Records
You can use the search box to search for jobs or records.
For detailed guidelines to create and perform search operations, see Searching in Pulse.
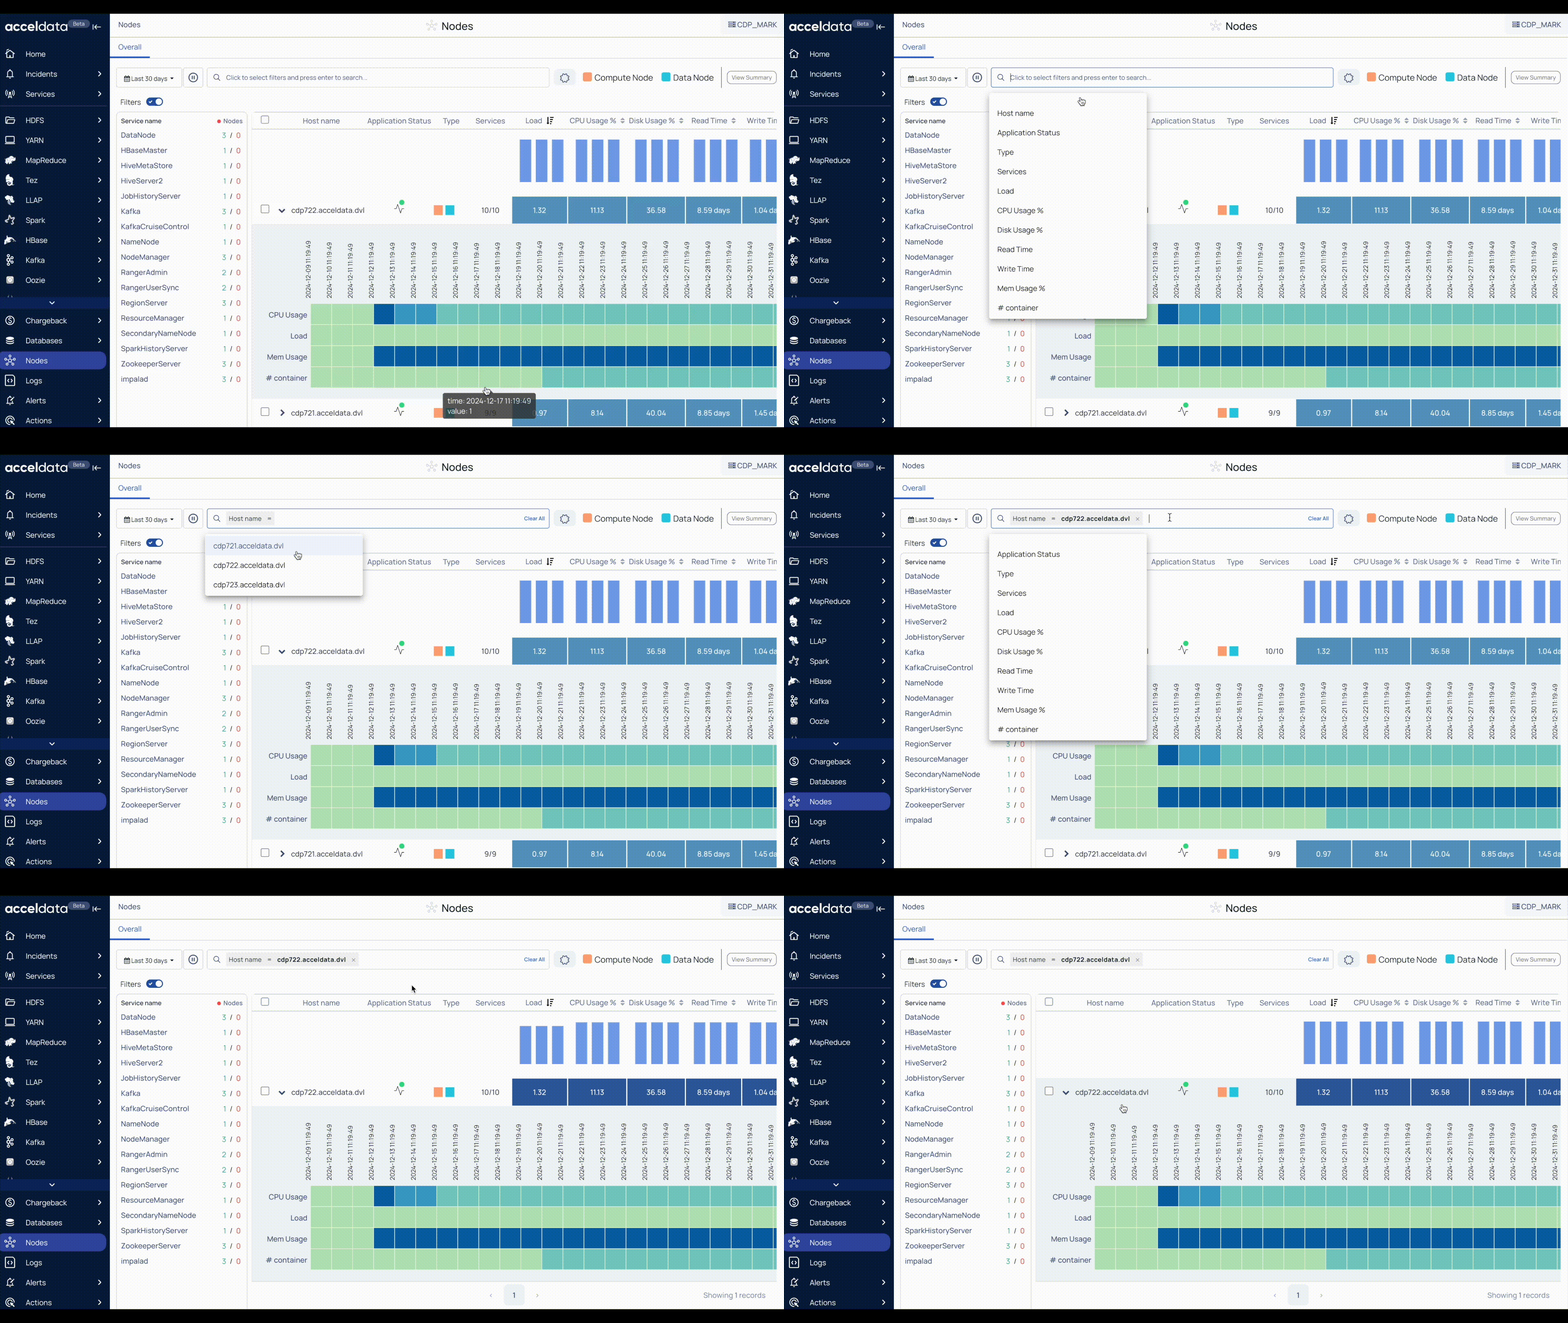
Follow the below steps to search for a record on the Nodes page:
- Log in to the Pulse UI and navigate to Pulse UI Home and click on Overview.
- On the Nodes page, navigate to the search bar and select the required parameters from the drop-down menu for the value you are searching for. For example, if you are searching for host
cdp722, select 'Hostname" from the drop-down, then=, followed by the host name from the drop-down menu in the search bar. - Press enter to search for the data.

For the String Data type fields, you can use the =~ operator. This operator allows you to search strings by entering partial strings. You can also use regular expressions to search for a required value.
Nodes Metrics
To sort the Load column value, click the icon to sort in ascending or descending order.
| Metric | Description |
|---|---|
| Checkbox | Click the checkbox to select or deselect the host. |
| Host name | Click on the hostname to view details of the host on the Node Details page. |
| Application Status | The status of the application is either connected or disconnected. Click the icon to view the list of applications. |
| Type | The type of node is either a Compute Node or a Data Node. |
| Service | The number of services up and down. |
| Load | The average of the number of tasks waiting in a kernel run queue over a period of time. |
| CPU Usage % | The amount of CPU utilized (in %). |
| Disk Usage $ | The amount of disk utilized (in %). |
| Read Time | The time taken to perform read operations in the node. |
| Write Time | The time taken to perform write operations in the node. |
| Mem Usage % | The amount of memory utilized (in %). |
| # of Container | The number of YARN containers running on a node. |
FAQs
Why is there no data being displayed for JVM GC Count and JVM GC Time on the Node Details page for Spark Master and Spark Worker Nodes?
These charts are not supported for Spark in the current release. In a future release, this will be supported.