Monitoring the Application Metrics
The Application metrics such as application name, type, ID, final status (Succeeded or Failed), user, memory, CPU, etc. usage help you understand the application details in-depth.
Steps to access the Application Explorer page to analyze the Yarn Workloads:
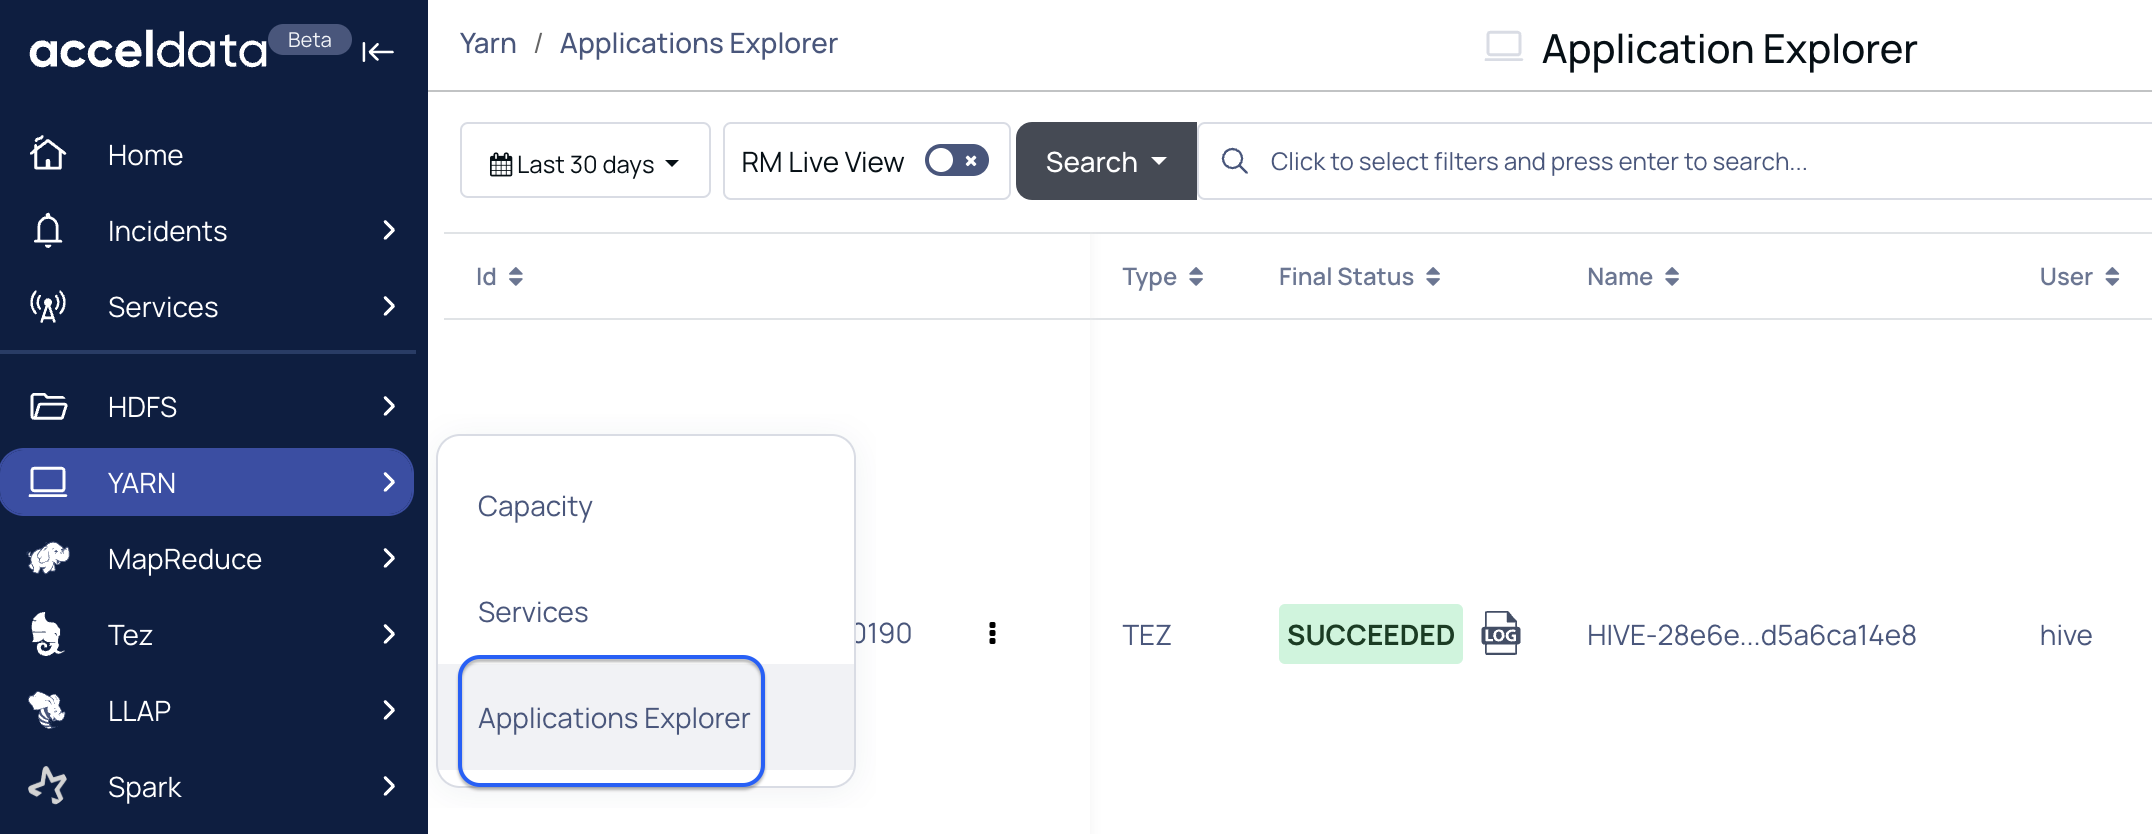
- Log in to Pulse UI and select YARN from the left navigation menu.
- On the YARN pane, select Application Explorer. The Application Explorer page appears with workload details.
Functionalities
| Functionality | Description |
|---|---|
| Timestamp | Choose an option to select a time period (For example, Today, Last 12 hours, Last 3 Months, etc.) or choose a “custom date and time” and click Apply. |
| RM Live View | Enable this to fetch a real-time overview of the cluster's resource utilization and application status in YARN. |
| Searching Jobs | Create a query with metric details such as ID, Type, Variance, name, etc., and corresponding details to search for the application details. |
| Save a Search Query | Click the Save Search icon to store a query for future use. |
| Saved Search Queries | Use the search drop-down menu to view and select previously saved queries. |
| Modify Table Columns | Click the Settings icon to search for columns, add or remove them, and rearrange their order as needed. |
| Refresh the Results | Click the Refresh icon to retrieve real-time data. |
Searching the Application Details
You can perform the following steps to search for a record.
- On the Application Explorer page, navigate to the Search bar.
- On the Search bar, select a search parameter. Pulse provides you with multiple search parameters.
- Select a suitable operator, enter the search term, and click the enter key.
Saving a Search Query
You can save and store a search query to run in the future.
- On the Application Explorer page, navigate to the Search bar.
- Enter a search query and click the Save Search icon (+).
- Enter the name with which you want to save a query and click Save.
The saved searches are available in the Search drop-down option.
Checking the Application Details
You can view the specifics of the running applications by clicking on their IDs.
Checking the Recommendations
For jobs of every application type you submit, you can view recommendations to optimize the performance of your jobs. These recommendations are based on jobs submitted by applications in the YARN queue of your Hadoop cluster.
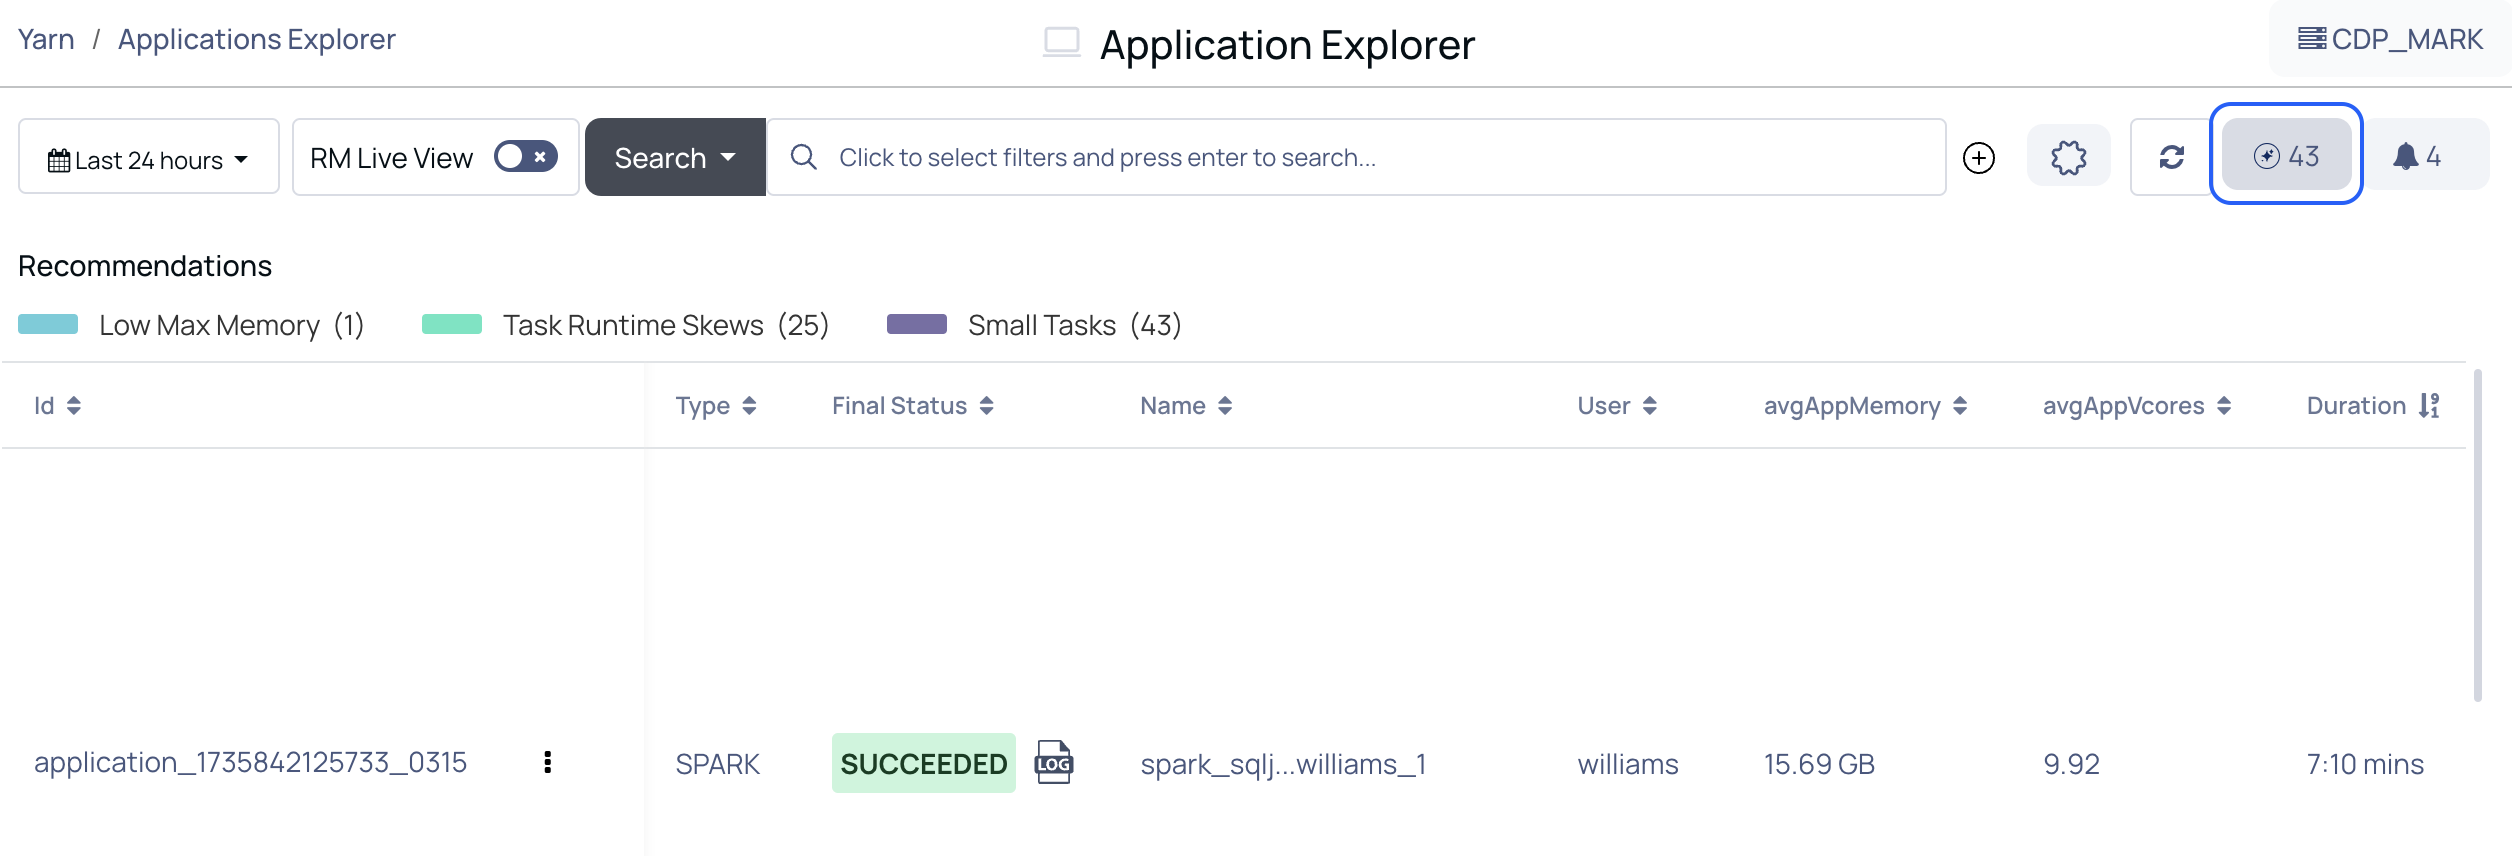
To view recommendations for the optimization of jobs, do the following.
- Click the Recommendations button at the top. The Recommendations tile is displayed.
- On the Recommendations tile, the recommendations are segregated into three categories. You can click on them to filter the results accordingly.
- Low Max Memory: This recommendation indicates applications that are using significantly less memory than allocated. Allocating excess memory to tasks when it’s not fully utilized can lead to inefficient resource usage and reduced cluster throughput. Reducing the maximum memory allocated for such tasks can improve overall resource utilization.
- Task Runtime Skews: This refers to tasks within an application that have significantly varying runtimes. Some tasks may be finished quickly, while others take much longer.
- Small Tasks: This represents tasks that process only a small amount of data, resulting in inefficient task execution due to overhead costs (e.g., task setup time, I/O operations).
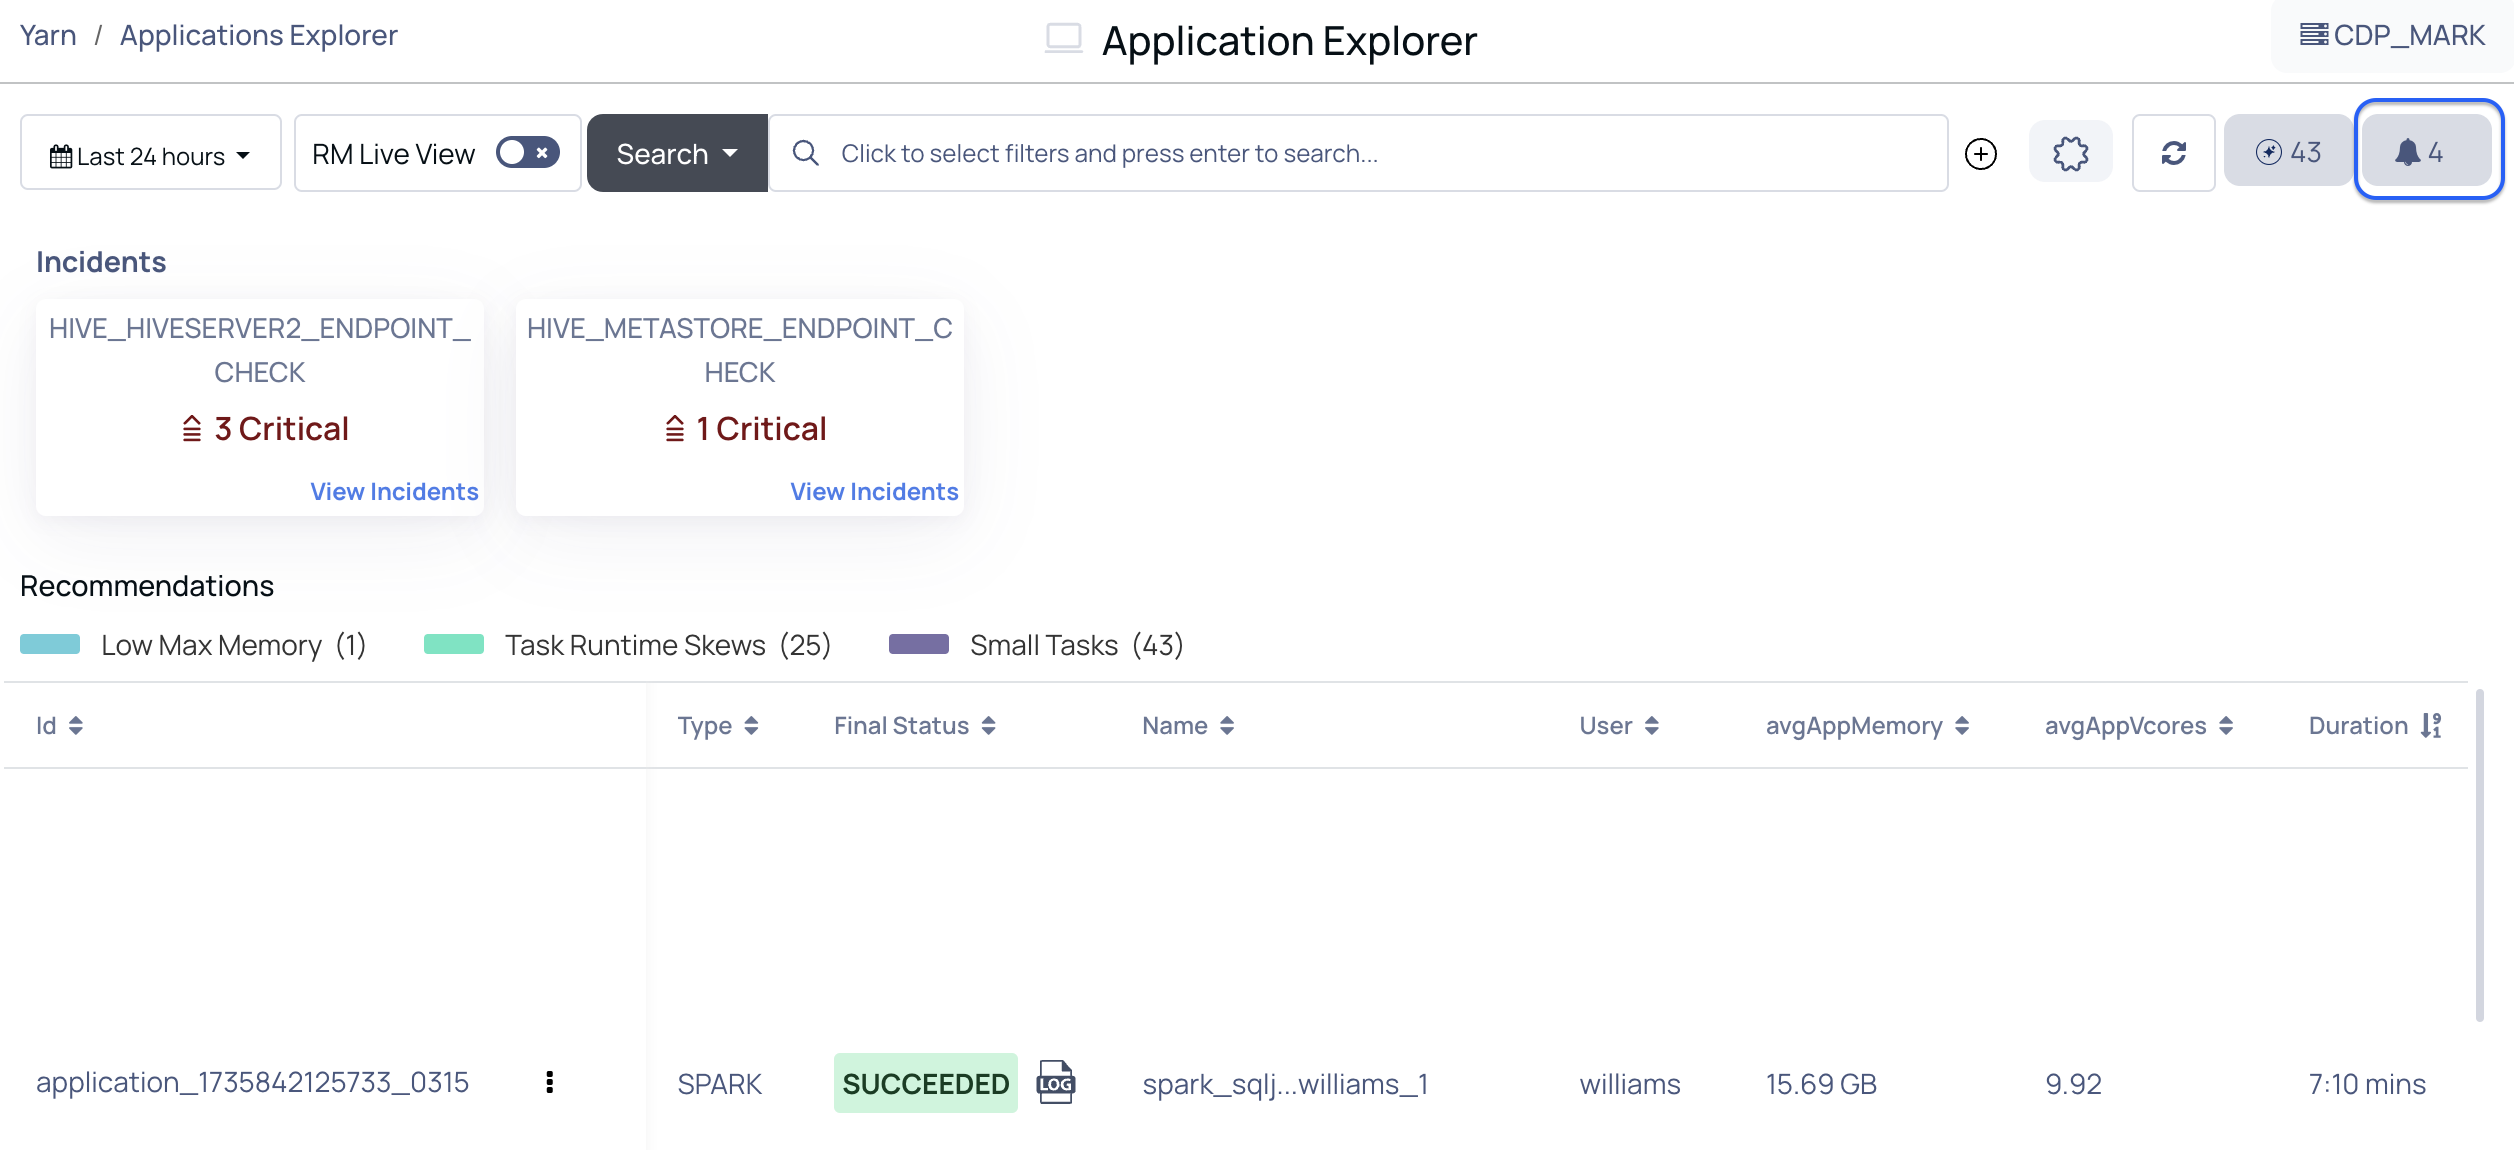
Checking the Incidents
To view incidents in the application explorer, do the following.
- Click the Incidents button at the top. An incident tile is displayed. The incident is displayed in the following format: Number of incidents, service name whose incident was reported, View incidents link. For example,
2 Critical Incidents, Hadoop Service, View Incidentsstatus means that two incidents were raised by Hadoop service. - Click View incidents to know more. The Incidents window is displayed.
Incidents Format
The Incidents page displays the list of incidents raised by a service. Each incident is displayed in the following format.
(Incident name ) (Time start time and end time of the incident) (The host on which the incident was raised) (Status of the incident, whether cleared or raised).
The following image is an example of the incident format.

Incident Details
To view the incident details, click on the incident name to expand the details.
The Details and Alert tabs are displayed.
- The Details tab displays all details of the incident.
- The Alert tab lets you edit the alert raised by the incident. Click the Edit button to edit the fields of the alert.
- From the incident details window, you can also do the following to view the date and time at which the incident was raised and evaluated.
- Click Raised at to expand detailed information on the date and time at which the incident was raised.
- Click Evaluated at to expand detailed information on the incident evaluation.
Metrics
By default, the table in the dashboard allows you to view the following metrics of jobs carried out by applications installed in YARN.
| Option | Description |
|---|---|
| ID | The ID of the application. |
| Variance | The value that displays by how many times the application is running slow. |
| Type | The type of application. |
| Final Status | The status of the application when the associated job is completed execution. The final status can be either of the following. Succeeded, Failed, Killed, Undefined, Unknown. |
| Name | The name of the job. |
| User | The name of the user executing the job. |
| avgAppMemory | The average amount of memory consumed by the job. |
| avgAppVcores | The average amount of vCores used by the application. |
| Duration | The time consumed to complete the job. |
| Queue | The name of the queue the application resides in. |
| Started | The time at which the job in the application started. |
| Ended | The time at which the job in the application ended. |
| maxContainerCore | The maximum number of container cores used. |
| maxAppMemory | The maximum amount of memory allocated to applications (in MB). |
| cpuUsePercent | The amount of CPU used (in %) by the application. |
| avgContainerCore | The average number of container cores used. |
| avgContainerMemoryMb | The average amount of container memory used (in MB). |
| maxMemoryMb | The maximum amount of memory used (in MB). |
| memoryUsePercent | The amount of memory used (in %). |
| containers | The number of containers used by the application. |
| hosts | The list of hosts the application executed jobs on. |
| memoryMbSec | The rate of memory utilization. |
| coresSec | The rate of core utilization. |
| totalTime | The total time taken to execute the job. |
The metrics table might display the following icons for a record. Click these icons to know more.
- The
alert button displays the service(s) of the application that might require attention. - The
tachometer button displays more details of the selected application ID. - The three horizontal dots button displays the following options.
Adding and Removing Columns
To add or remove a column to the Applications Explorer table, perform the following:
- In the top right column of the table, click the table
settings icon. A Select Column window appears. - From the available list of columns, select the column name you want to add to the table or deselect a column name you want to remove from the table.
- Click Apply. The table is modified.
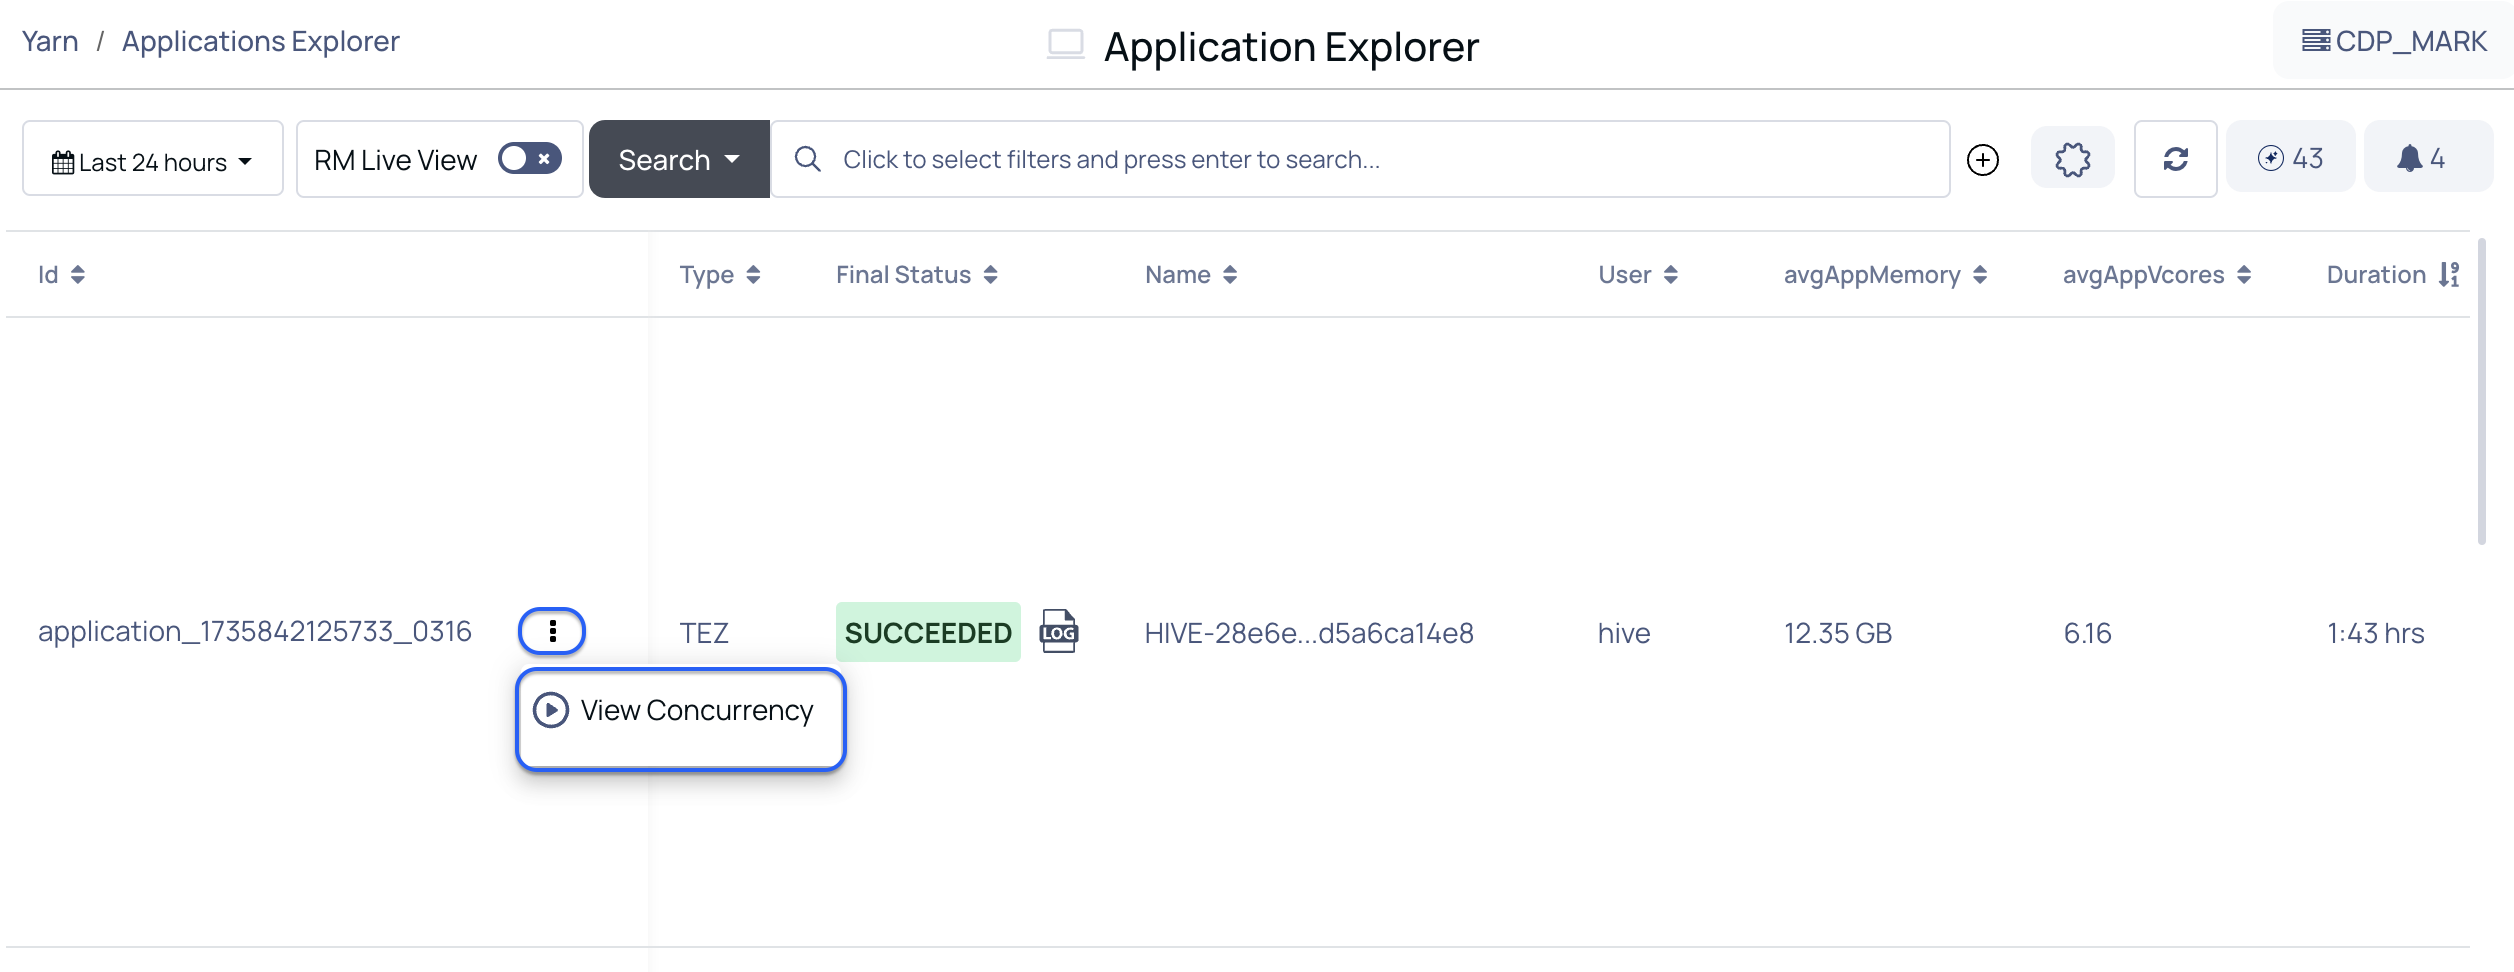
Checking the Concurrency
Click on the three horizontal dots button > View Concurrency. It displays the list of jobs that were running at the same time as the selected application ID.
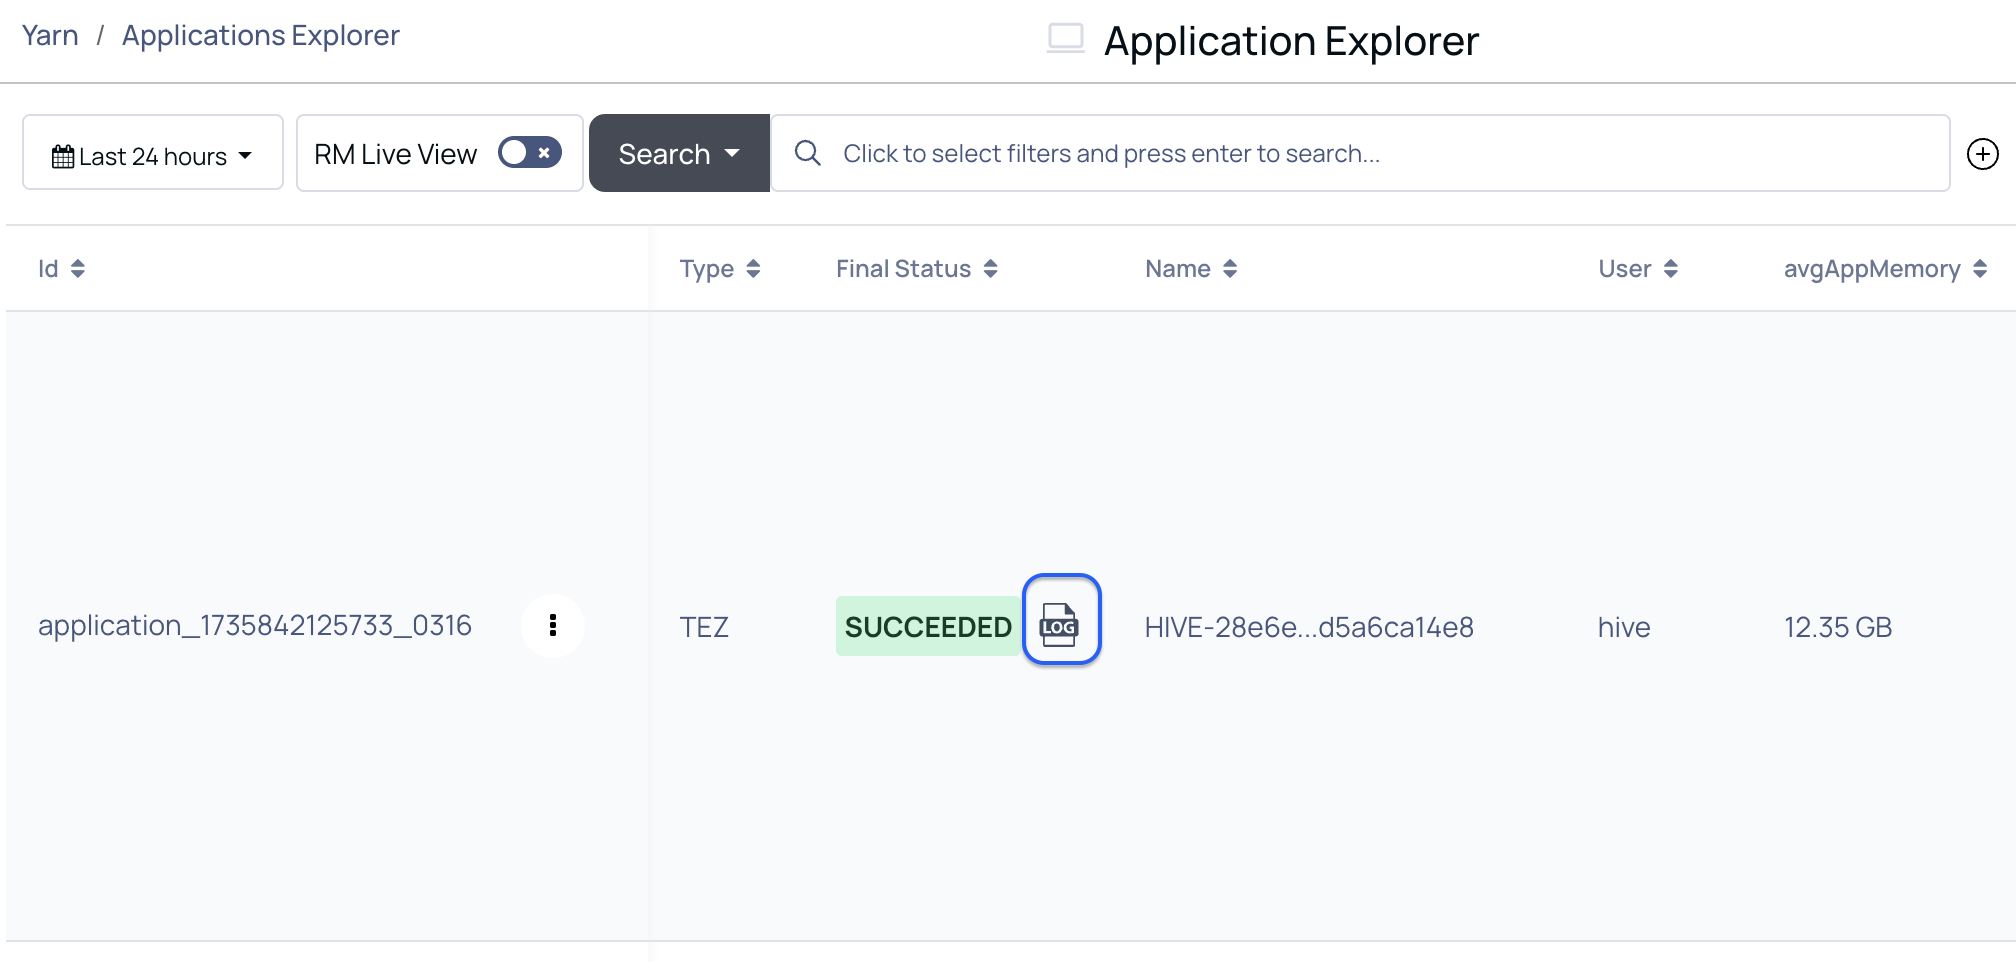
Checking the Logs
To view a record's status log, click the Log icon in the ID column of the desired record, as shown below.