
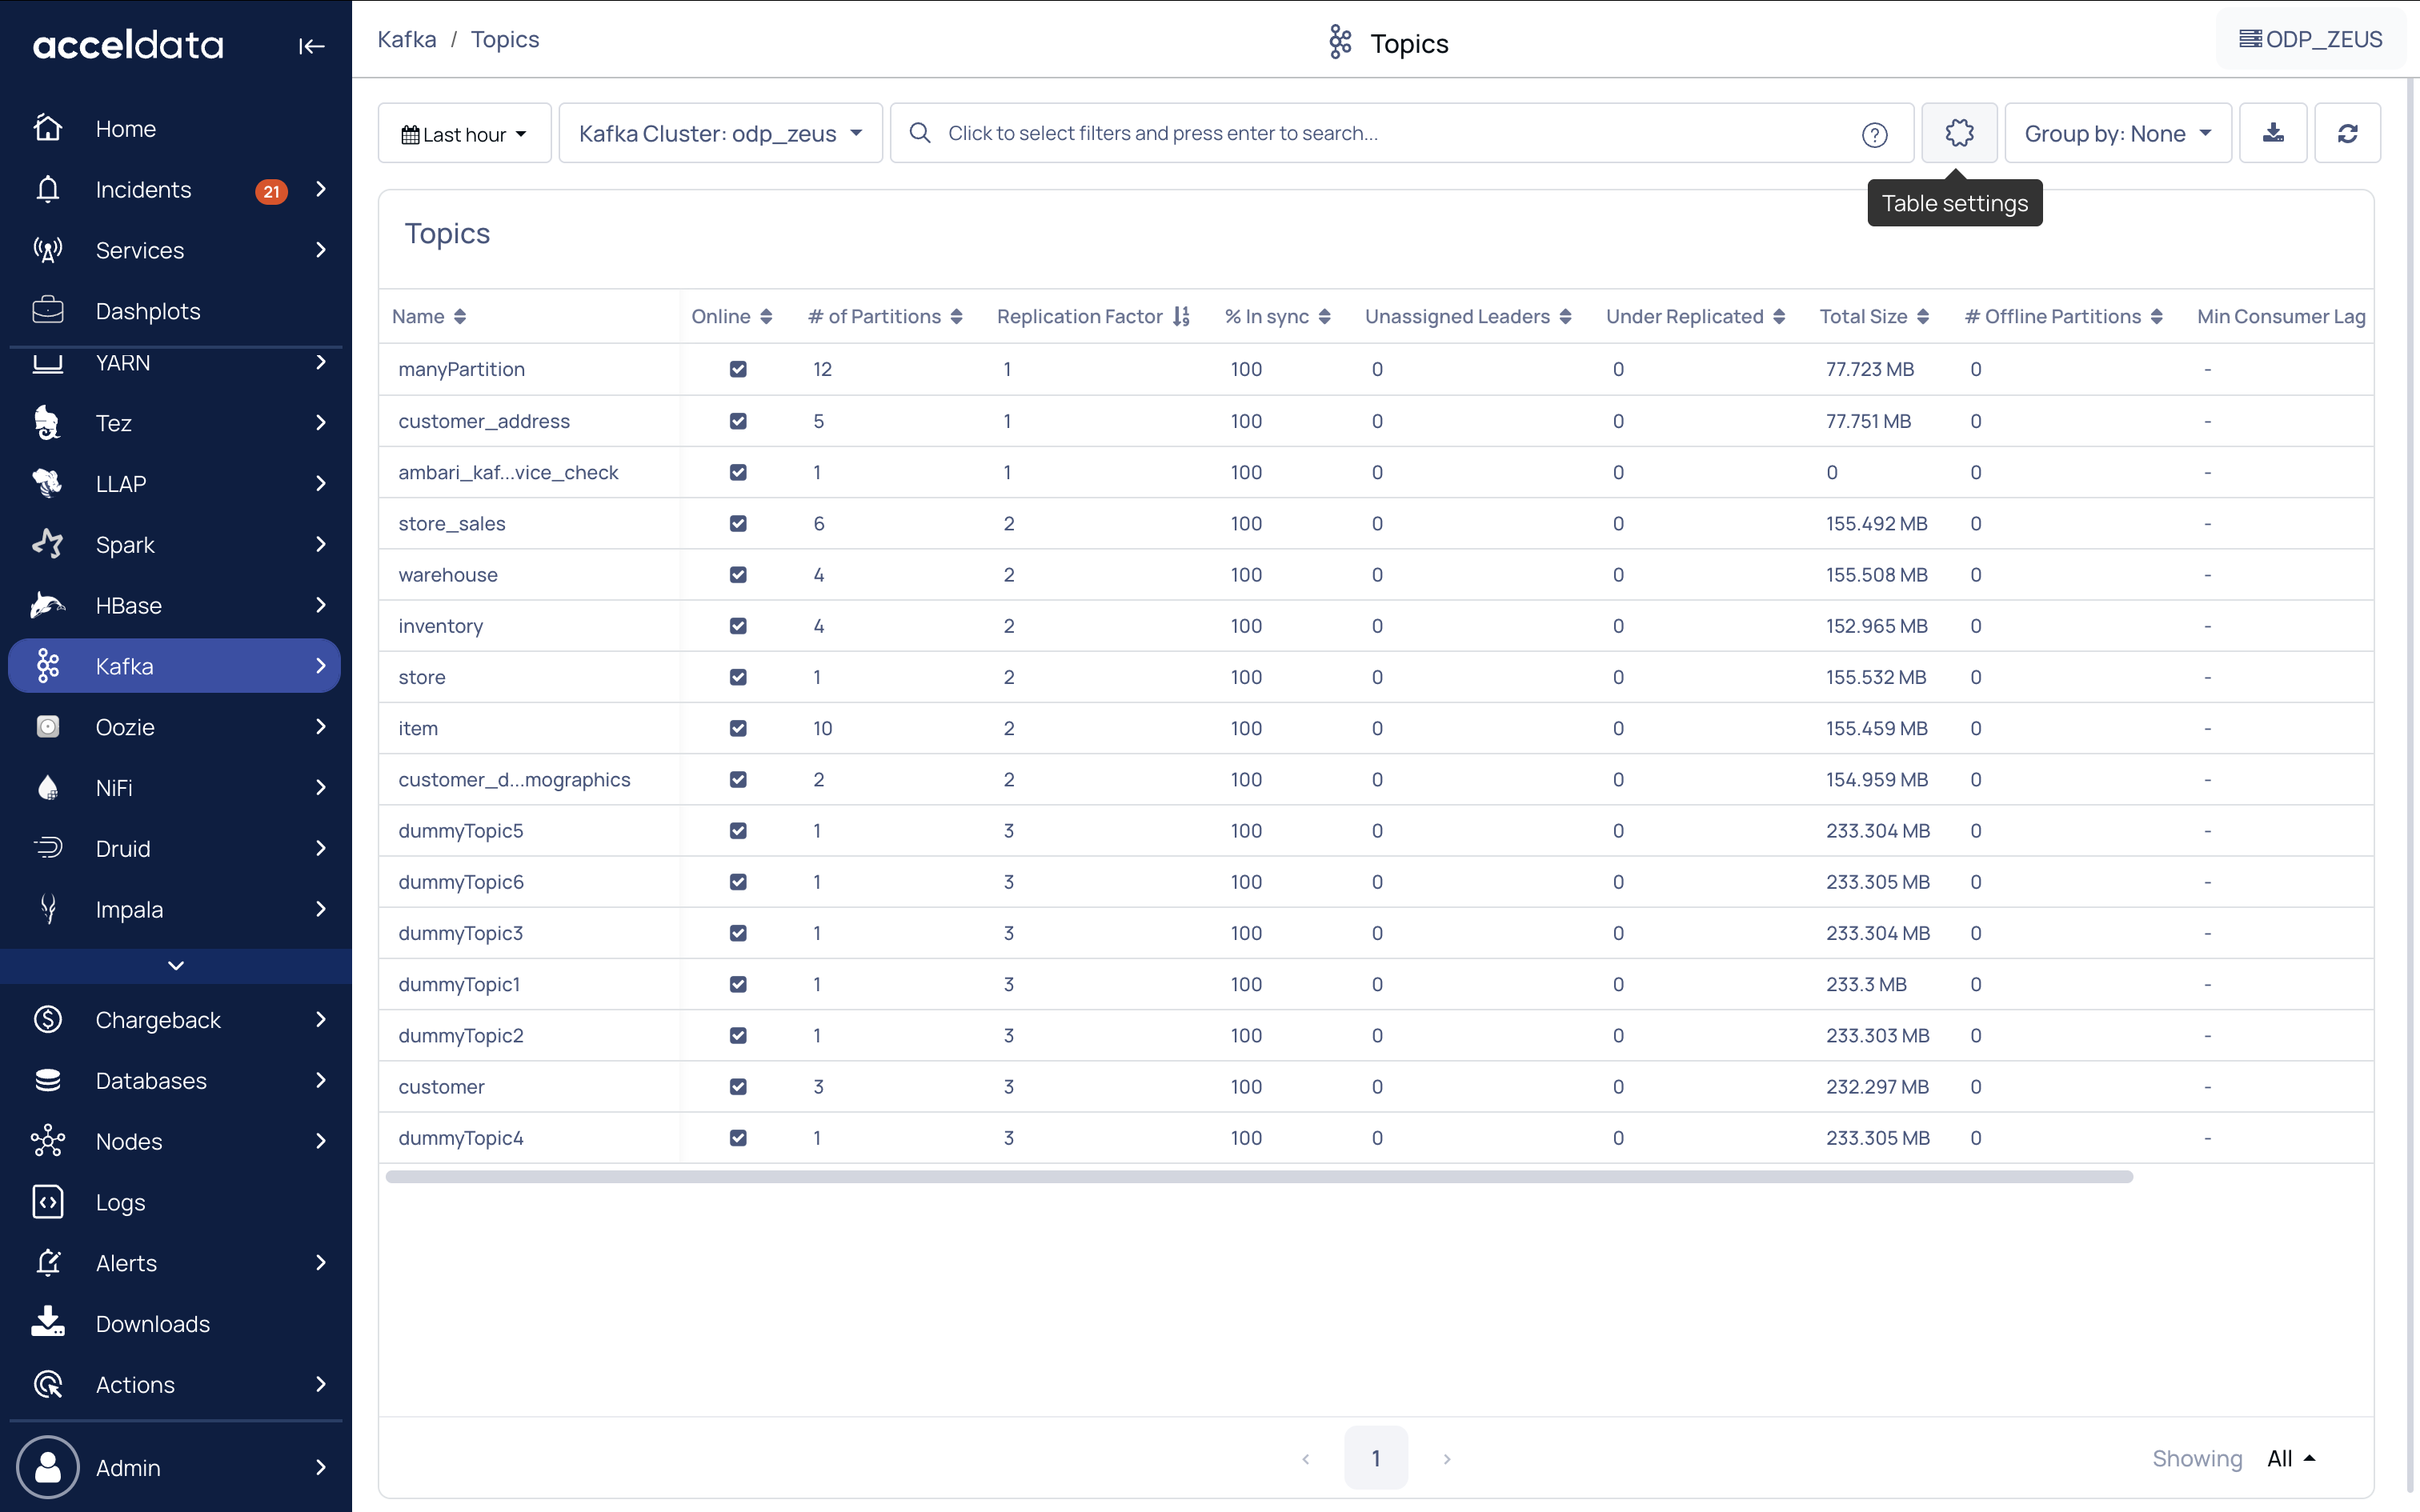
A Topic is a unit or component where streaming and publishing data is stored. Multiple streaming data can be stored and can be published to one or more channels or consumers. The Kafka Topics dashboard displays a list view of all topics created in the Kafka cluster.
You can view the following metrics for existing topics in a Kafka cluster.
Click a topic to view the Kafka Topic Details page.
Adding Metrics
By clicking on the Table Settings icon on the right side of the screen, you can now add the appropriate metrics. The following example demonstrates this.
Metric | Description |
|---|---|
Name | The name of the topic. |
Online | This state shows that the Kafka topic is online and receiving messages from the producer. |
# of Partitions | Number of partitions created in the topic. |
Replication Factor | Defines the number of copies a topic has in a Kafka cluster. These copies are used in the event of a failover. If Replication Factor is N, Kafka can tolerate up to N-1 failures. |
% in sync | The percentage value at which the topics are in sync with the topics in replication factor. |
Data In/Out | Amount of data streamed in and streamed out of a topic. |
Total Replica Fetcher Lag | The Fetcher Lag measures the lag in the quantity of messages per follower replica. |
Bytes In Mean Rate | Average rate of incoming data. |
Bytes Out Mean Rate | Average rate of outgoing data. |
# of Consumers | Number of consumers or subscribers of a topic. |
# of Consumer Groups | Number of groups fetching data from a topic. |
Consumer Lag | Represents how far the consumer unit is from fetching data from the producer. |
Unassigned Leaders | Number of partitions with leaders not assigned. |
Retention | The time limit for message retention. Messages get discarded after the displayed period. Note If no values are displayed, then the default value is taken for retention. |
Avg Size | The average partition size of a topic. |
Under Replicated | Number of partitions that are under replicated. |
Total Size | The total size of the topic. |
# Offline Partitions | Number of offline (unavailable) partitions. |
Min Fetch Lag | Minimum lag between the current consumer offset and the highest offset. |
Max Fetch Lag | Maximum lag between the current consumer offset and the highest offset. |
Click to download the metrics data in XLSX format.
Click on Table Settings on the top right corner to view and select columns.
Grouping by Brokers
To group the topics by Brokers, click the Group by drop down and select Brokers.
Grouping by Brokers displays the following metrics.
To view the topics in a broker, click the row of a broker.
Metric | Description |
|---|---|
Broker Id | The ID of the broker in the Kafka cluster. |
# of Partitions | Number of partitions created in the broker. |
# of Leaders | Number of leaders that Zookeeper elects for coordination. |
Under Replicated Partitions | Number of partitions yet to be replicated. |
Bytes in/out | Amount of incoming and outgoing data. |
Request Handler Idle Ratio | Ratio of time or fraction of time at which the request handler is idle. The values can be 0 or 1 or any value between 0 and 1. 0 represents that no resources are available to use and 1 represents that all resources are available. |