
The MapReduce Query Details page contains the following panels.
To reduce resource usage in environments, you can disable MapReduce query analysis and Hive metastore lookups by adding the following properties to the
acceldata_<cluster_name>.conffile:
mr.analysis.enabled = false— Disables MapReduce query analysis.metastore.lookup.enabled = false— Disables Hive metastore lookups.
These settings are optional. All query details remain available even if these properties are not enabled. Both features are enabled by default.
Summary Panel
The summary panel displays the following information.
Field Name | Description |
|---|---|
User | The name of the user that executed the job. |
Status | The status of the job that can be one of the following: Succeeded, Failed, Killed, Undefined. |
Duration | The time taken to run the query. |
Start Time | The time at which the query execution started. |
End Time | The time at which the query execution ended. |
# of Applications | The number of applications used by the query. |
Memory | The amount of memory used by the query. |
VCore | The number of VCores consumed by the query. |
Query Trends
The Query Trends panel displays a chart showing the pattern of jobs running at a particular time, based on the following factors.
Metric | Description |
|---|---|
Elapsed Time | The time taken to run the jobs at a particular time. |
VCores | The number of VCores consumed to execute the query within a timeframe. |
Memory | The amount of memory used to execute the query within a timeframe. |
Configuration Difference
Click Compare Runs to compare different runs of the query. Select the runs that you want to compare. You can choose from upto 10 previous runs of the query. The metrics that are different are highlighted and displayed at the very top of the comparison result.
Query
The Query panel displays the SQL query along with the Join details and the details of table(s) used in the query. To copy SQL, click and to beautify the SQL, click .
NoteTo view the table details click on the table name. The MapReduce Table Details for the table is displayed.
Tables with Small Files
If any of the table accessed by the query has small files attached to it, you can see those table names with an yellow border. The legend at the top of the Query table indicates the same.
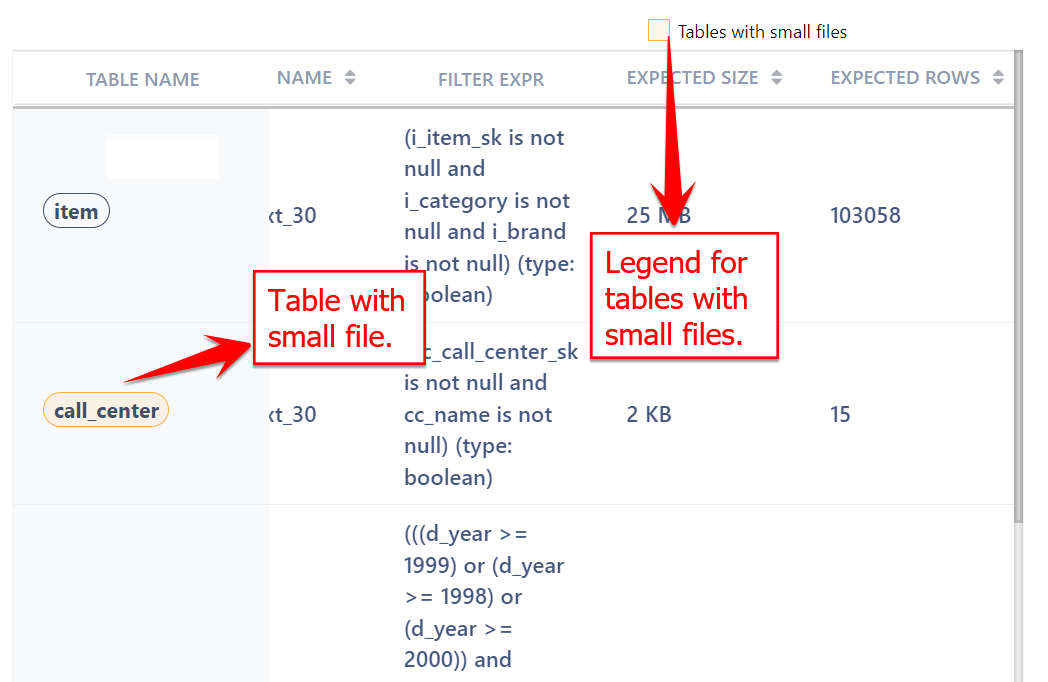
Application Stats
The Application Stats tab displays the details of applications used in the query by elapsed time. You can sort the data by Start Time and Duration.
Note To view the application details click on the elapsed time in the chart. The MapReduce Details for the application is displayed.
Query Plan
Query Plan is a logical representation of how MapReduce executes the query, where a query is broken into different stages. The query plan is displayed in JSON format. Click the icon to copy the query into the clipboard.