
MemSQL Dashboard
The MemSQL module provides comprehensive visibility into the operations and health of MemSQL clusters. It works with the existing database audit logs, metrics, alerts and events.
The module has the following features:
Identify slow/inefficient queries and monitor key database and system metrics. This enables you to optimize the performance of MemSQL clusters.
Monitor user logins, audit events, and also monitor project and organizational activity. This provides visibility into the security of your MemSQL environment.
Click MemSQL --> Dashboard in the left pane to access the MemSQL dashboard.
The dashboard contains several aggregated values in the summary tiles. You can click the number on each field to view the detailed information about that metric.
Name | Description |
|---|---|
User Queries | Total number of user queries run. |
User Queries Rate | The number of user queries being run per hour. |
Pipeline used | The number of data ingestion pipelines used to process queries. |
Pipeline runs | The total number of pipeline runs. |
Succeeded | The number of pipeline runs executed successfully. |
In progress | The number of pipeline runs that are in progress. |
Failed | The number of pipeline runs that failed to execute. |
Queued | The number of pipeline runs waiting for execution in the queue. |
MemSQL Memory Usage
The MemSQL Memory Usage chart depicts the usage of physical memory (RAM) across different process types over a timeline.
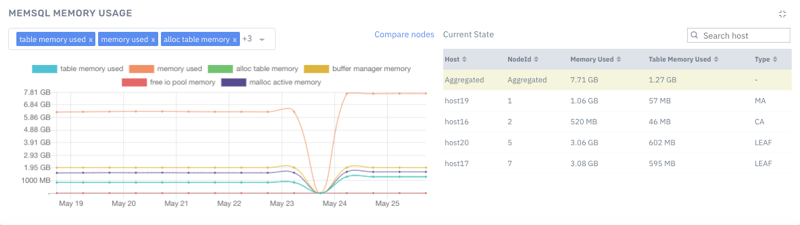
The table on the right of the tile displays the following information for hosts.
Host: The name of the connected MemSQL node.
NodeID: The ID of the connected MemSQL node.
Memory Used: The memory used by the MemSQL node.
Table Memory Used: The table memory used by the MemSQL node.
Type: The type of MemSQL node, either of the following.
Child Aggregator node (CA)
Master Aggregator node (MA)
Leaf node (LEAF)
You can use the Search field to search for a host by name.
By default, the sum(aggregate) of memory across all nodes over the past 24 hours is displayed, at 3 hour intervals. You can use the Time dropdown menu to select different timelines.
The data capture interval is 1 minute. You must manually refresh the page to view the latest info on the charts.
The following table describes the various memory types.
Type of Memory | Description |
|---|---|
Table memory used | The amount of memory a table uses in a host. |
Max table memory | The maximum memory capacity of a table available in a host. |
Memory used | The amount of memory used by a MemSQL node. |
Max memory | The maximum memory available to a MemSQL node. |
Alloc table memory | The amount of the memory stored inside of all rowstore tables. |
Buffer manager cached memory | The memory that was allocated by the Buffer Manager, but is now cached and not in use. |
Buffer manager memory | The memory that is allocated by the buffer manager for built-in memory allocators of MemSQL. |
Free IO pool memory | The amount of unused IO pool memory. |
Malloc active memory | The memory allocated directly from the Linux OS and managed by the C runtime allocators. This memory is different from the memory allocated by the buffer manager. |
Malloc transaction cached memory | The memory allocated to caching transaction objects. |
For more information, refer to MemSQL v7.0 documentation.
Comparing Nodes
To compare memory usage of connected hosts, do the following.
In MemSQL Memory Usage tile, click Compare nodes.
Select the hosts you want to compare.
In the Comparison Metrics drop-down menu, select the type of memory you want to compare.
Hover over the line graph to see the memory usage of selected nodes with respect to time.
MemSQL Aggregators
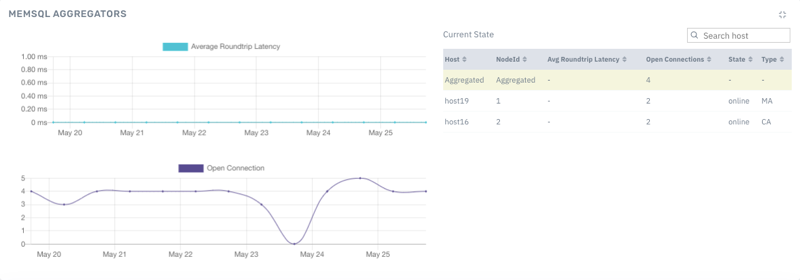
The MemSQL Aggregators chart displays the following information for the Master Aggregator and Child Aggregator nodes.
Average Roundtrip Latency: Represents the network delays present on a node.
Open Connections: Represents the number of open connections on a node.
MemSQL Leaves
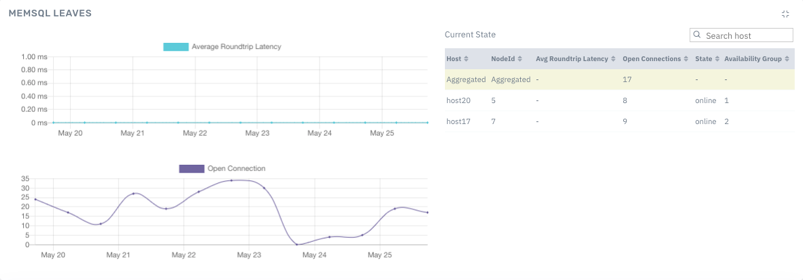
MemSQL Leaves displays the following information for the MemSQL Leaf Nodes.
Average Roundtrip Latency: Represents the network delays present on a node.
Open Connection: Represents the number of open connections on a node.
MemSQL Resource Pool
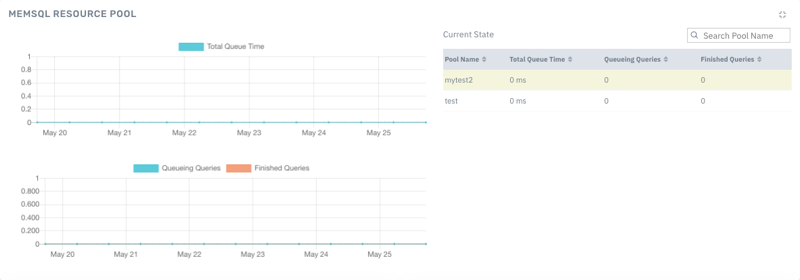
The MemSQL Resource Pool chart displays the following information about MemSQL Resource pools.
Total queue time: The total waiting time of all the queries for a particular resource pool.
Queuing queries: The number of queries in the resource pool currently in queue.
Finished queries: The number of queries in the resource pool that are completed.
Type the name of the resource pool in the search field to view results for a particular pool.
Viewing Other MemSQL Charts
The MemSQL dashboard displays several charts for other metrics.
Chart Name | Description |
|---|---|
Query execution count | Displays the number of queries executed on the overall MemSQL Cluster. |
Average query time | Displays average query execution time and total query execution time of queries executed on the overall MemSQL Cluster. |
Top 10 Tables (by query) | Displays the top 10 tables currently in use |
DDL/DML | Displays the number of DDL and DML queries run in a time frame. |
SQL types | Displays the number of SQL queries run. (Select, Create, Insert, Update) |
Top 10 pipelines (by #runs) | Displays the top 10 pipelines by the number of runs. |
Top 10 pipelines (by sum of rows) | Displays the top 10 pipelines by the sum of rows in the tables. |
Top 10 pipelines (by batch time) | Displays the top 10 pipelines by longest time taken per batch. |
Acceldata Pulse connects to your MemSQL installation and presents an analysis of your existing ecosystem. Hence, we assume that you are already familiar with MemSQL concepts and terminology. In Acceldata documentation, any terminology used for MemSQL should be read in conjunction with MemSQL’s own definitions. Acceldata’s terminology will be called out and defined separately. You can refer to MemSQL online documentation here: https://www.memsql.com/.