This tab displays the summary metrics of the tasks that completed within the selected Spark stage. To view the Spark Stage Details, perform the following:
Go to left navigation bar and click Spark>Jobs. The Jobs page is displayed.
Click Jobs.
Recommendations
The table in the Spark Stage Details tab provides the summary metrics of the completed tasks.
The following table provides description of the metrics:
Metric | Description |
|---|---|
Percentile | A number where certain percentage of jobs fall below that number. For example, 95th percentile indicates that a certain amount of jobs executed within xx seconds, which is faster than 95% of the jobs in queue. |
Duration | Time taken by the stages to complete. |
Executor CPU Time | Total CPU time taken by the executor to run the task (in milliseconds). |
Executor Deserialize Time | Time taken by the executor to deserialize tasks. |
JVM GCTime | Time spent by the JVM in garbage collection while executing a task. |
Result Serialization Time | Time spent to serialize a task result. |
Peak Execution Memory | The memory used during shuffles, aggregations, and joins by internal data structures. |
Shuffle Write Time | Time spent to write serialized data on all executors. |
Shuffle Bytes Written | Bytes written to the host. These bytes are read by a shuffle later when needed. |
Note Click on the type of stage. The details of the stage ID and percentile ratio are displayed.
Tasks Analysis by Metrics
The Tasks Analysis by Metrics displays the following charts:
JVM GC Time
Peak Execution Memory
Executor Deserialize Time
Data Locality
Shuffle Bytes Read
Shuffle Bytes Written
Input Bytes Read
Output Bytes Written
To see task analysis in bar charts for each metric, click any row in Details table.
The bar chart represents two kinds of values:
The percentile value
The average percentile value
Info The red outline indicates values with a difference of more than 30%.
Executors
This tab displays the following aggregated metrics of executors in hosts for the selected stage ID.
Metric | Description |
|---|---|
EID | The executor ID. |
Host | The host on which the executors are running. |
Failed Tasks | The number of failed tasks in the executor. |
Killed Tasks | The number of terminated tasks in the executor. |
Succeeded Tasks | The number of successfully completed tasks in the executor. |
Task Time | The time spent on the tasks. |
Memory Bytes Spilled | The amount of deserialized form of the data in memory at the time it is spilt. |
Input Bytes | The number of bytes read from the executor in that stage. |
Output Bytes | The number of bytes written to the executor in that stage. |
Shuffle Read | The amount of serialized data read on the executor. |
ShuffleWrite | The amount of serialized data written to the executor. |
To view the host details, click the host name.
Task
Metric | Description |
|---|---|
Task ID | The ID of the task. |
Status | The status of the task, which can be one of the following:
|
Task Locality | The type of task in the host which can be on. |
Host | The hostname where the task resides on. |
Duration | Time elapsed in completing the task. |
JVM GC Time | Time spent by the JVM in garbage collection while executing a task. |
Result Serialization Time | Time spent to serialize a task result. |
Peak Execution Memory | The memory used during shuffles, aggregations, and joins by internal data structures. |
Input Read Bytes | Bytes read from the executor in that stage. |
Shuffle Read Blocked Time | The time spent by tasks staying blocked and waiting for shuffle data to be read from remote machines. |
Shuffle Records Read | Number of records written to the host. These records are read by a shuffle later when needed. |
Shuffle Remote Reads | The shuffle bytes read from remote executors. |
Trace
The Trace tab displays the logs of that Stage ID. You can detect the internal state of the jobs running in the stage you are currently viewing.
This tab also displays the log for any errors that occur in the tasks of that stage.
DAG
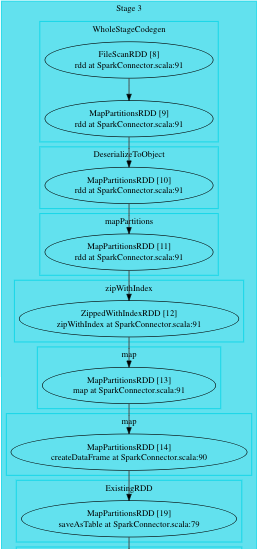
The Direct Acyclic Graph (DAG) displays a flow diagram of the Spark job.
DAG is a work scheduling graph with finite elements connected in edges and vertices. These elements are also called RDDs (Resilient Distributed Datasets). The RDDs are fault-tolerant in nature.
The order of execution of the jobs in DAG is specified by the directions of the edges in the graph. The graph is acyclic as it has no loops or cycles.