This dashboard provides an overall picture of cluster efficiency, allocations (requested resources), and optimization opportunities by identifying the gap between requested vs actually used CPU/memory.
Steps
- In the Pulse UI, go to Cluster Efficiency on the left pane.
- Select Step Interval (how often the dashboard update) and Time Period.
- In Cost Settings:
- Cloud Provider: Select the cloud service provider.
- Instance Type: Select the instance type.
- Click Save Settings.
You can see the dashboard details are updated based on the selection.
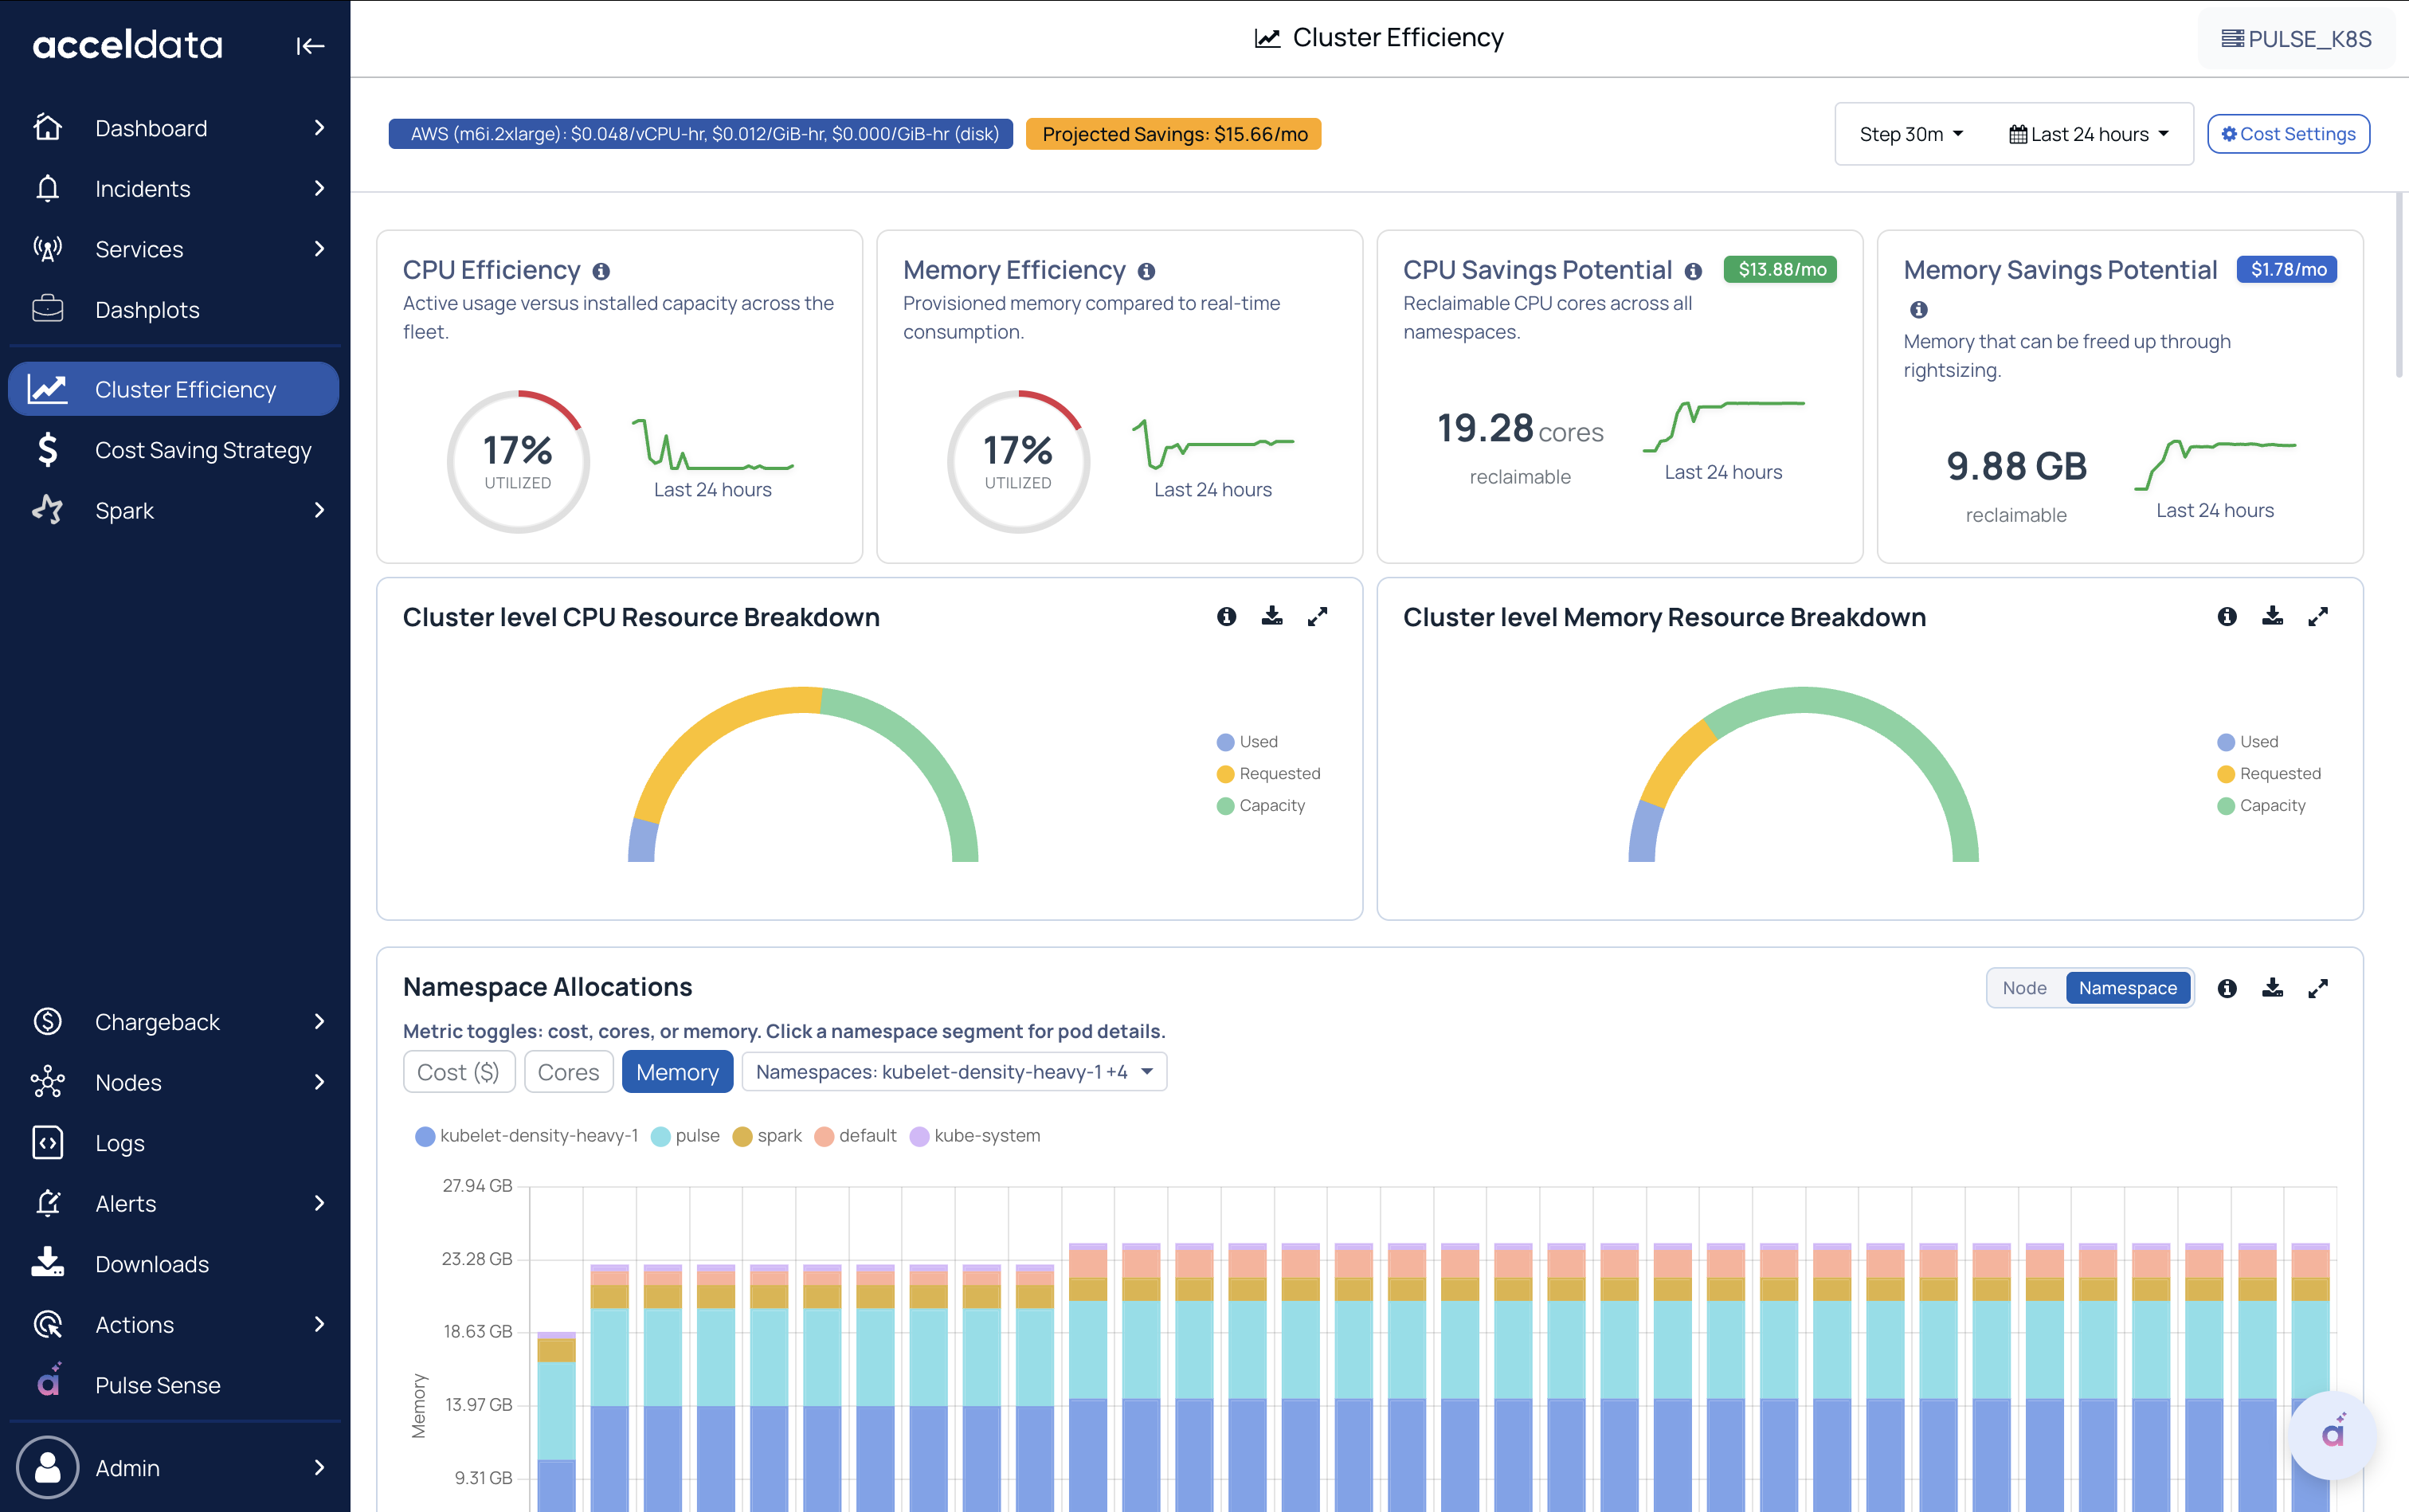
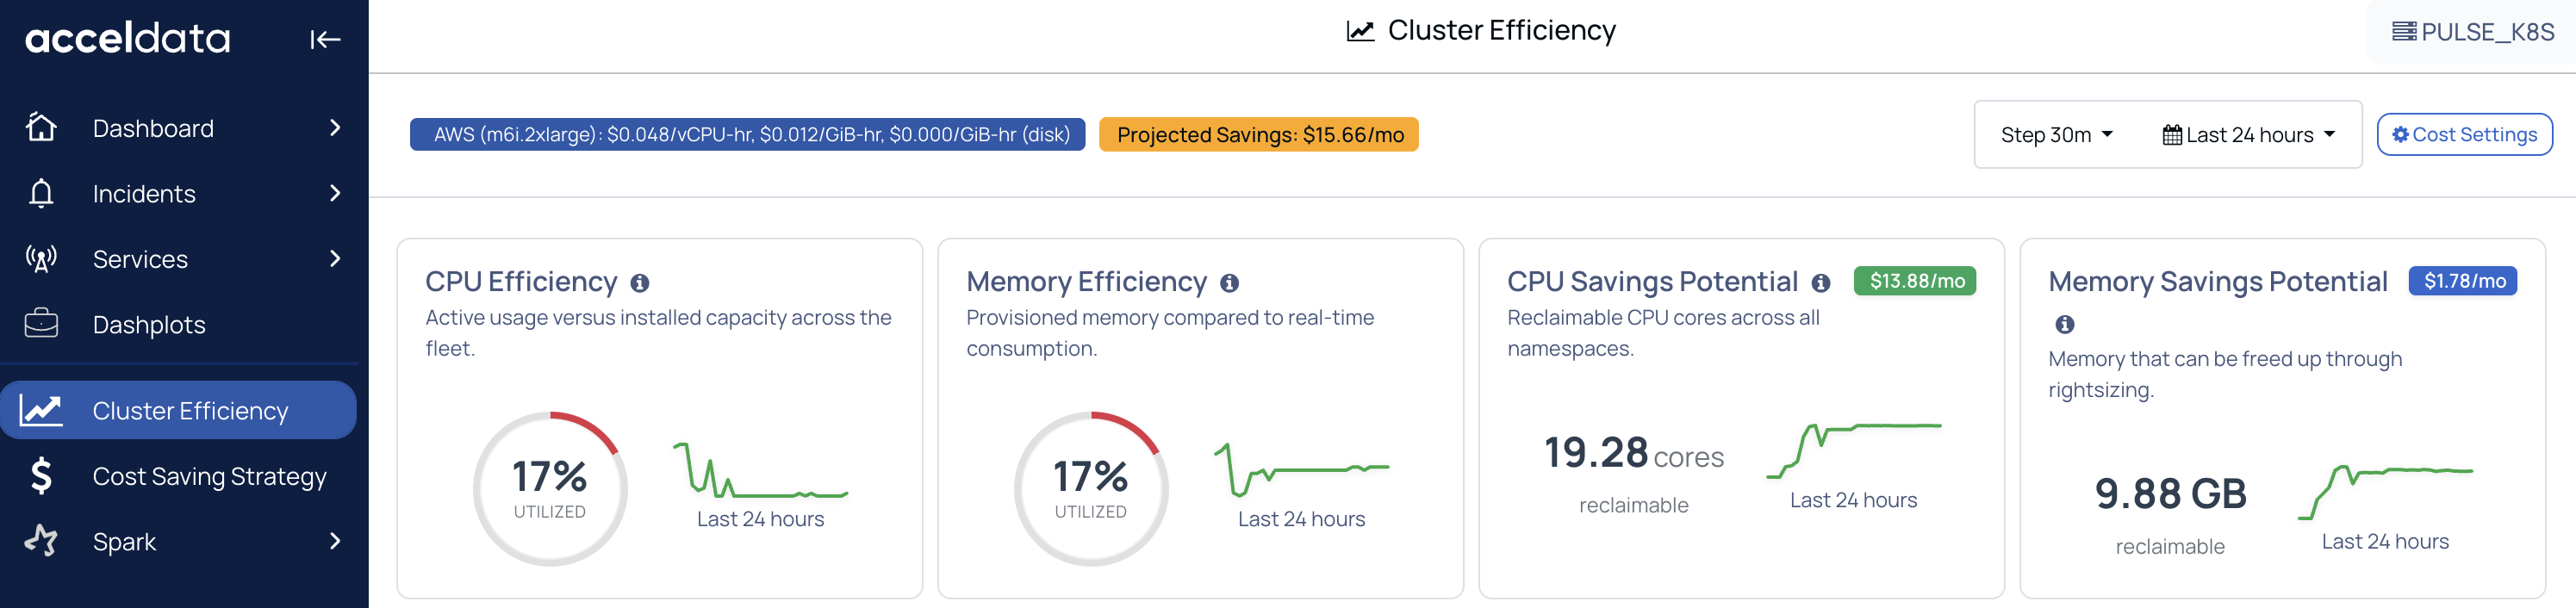
Efficiency and Savings Potential
CPU Efficiency
- Shows how much CPU is actually used compared to the cluster’s total CPU capacity over the selected time range.
- Lower efficiency typically indicates the CPU is over-requested or underutilized across workloads.
Memory Efficiency
- Shows how much memory is actually used compared to the cluster’s total memory capacity.
- Helps identify memory over-allocation at a cluster level.
CPU Savings Potential
- Shows the difference between how much all the pods combined are requesting and how much the actual utilization is on the cluster level.
Memory Savings Potential
- Estimates reclaimable memory (GB) using the same request-vs-usage gap for memory.
- Helps quantify how much memory could potentially be freed up.
Cluster-Level CPU Resource Breakdown
Breaks down CPU into:
- Used (actual consumption)
- Requested (what pods asked for)
- Capacity (total available in the cluster)
This gives us the overall picture of the cluster resources' state.
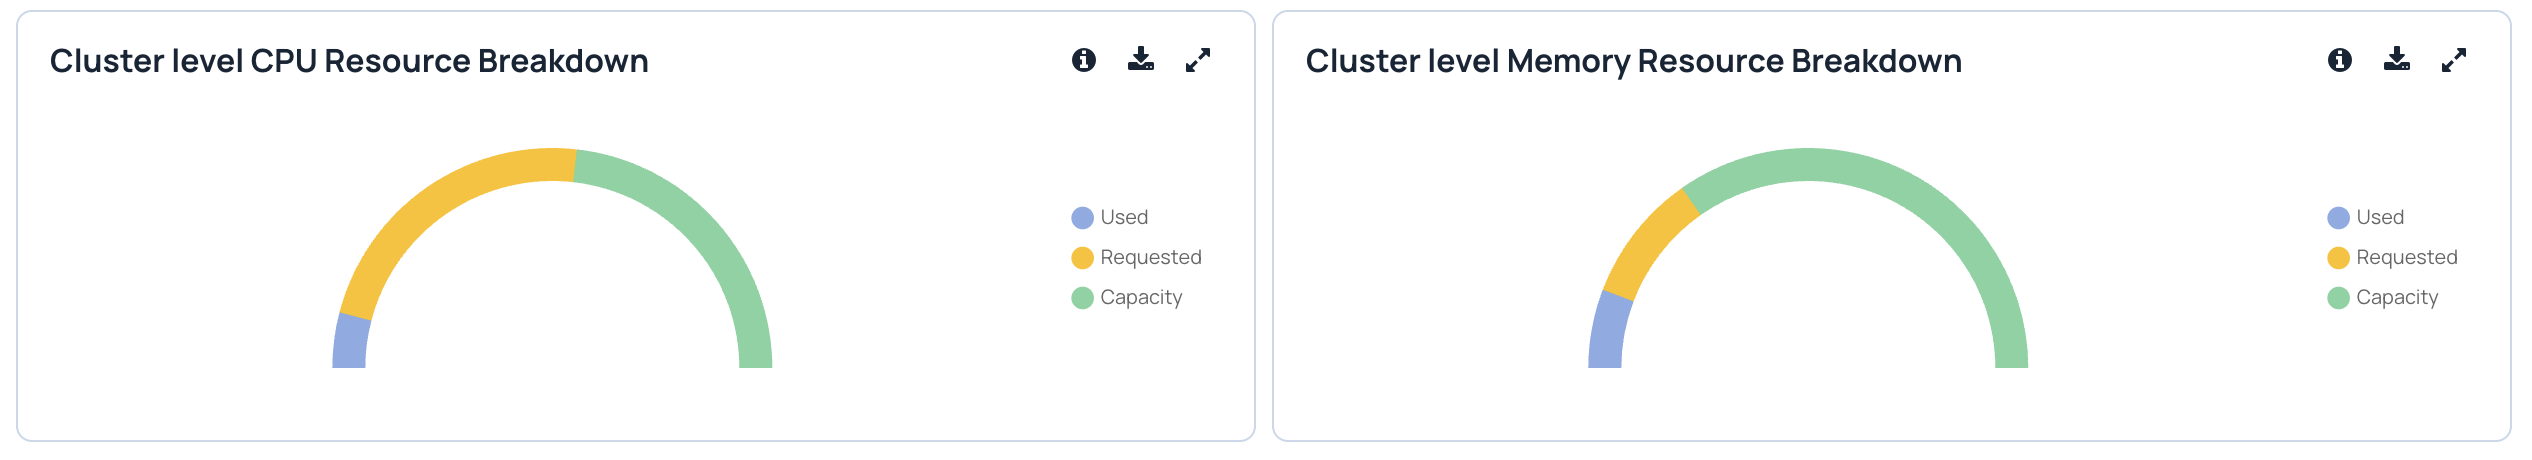
Cluster-Level Memory Resource Breakdown
Same breakdown for memory:
- Used, Requested, and Capacity
- Shows whether memory inefficiency is due to over-requesting.
Namespace Allocations
Time-series view of how much resource is requested (allocated) per namespace.
You can switch between node and namespace-level allocations.
- In node and namespace, you can switch between Cost, Cores, and Memory, and filter nodes and namespaces to understand which nodes and namespaces are driving allocations.
In this context, “Allocated” refers to what workloads were requested, not necessarily what they used.
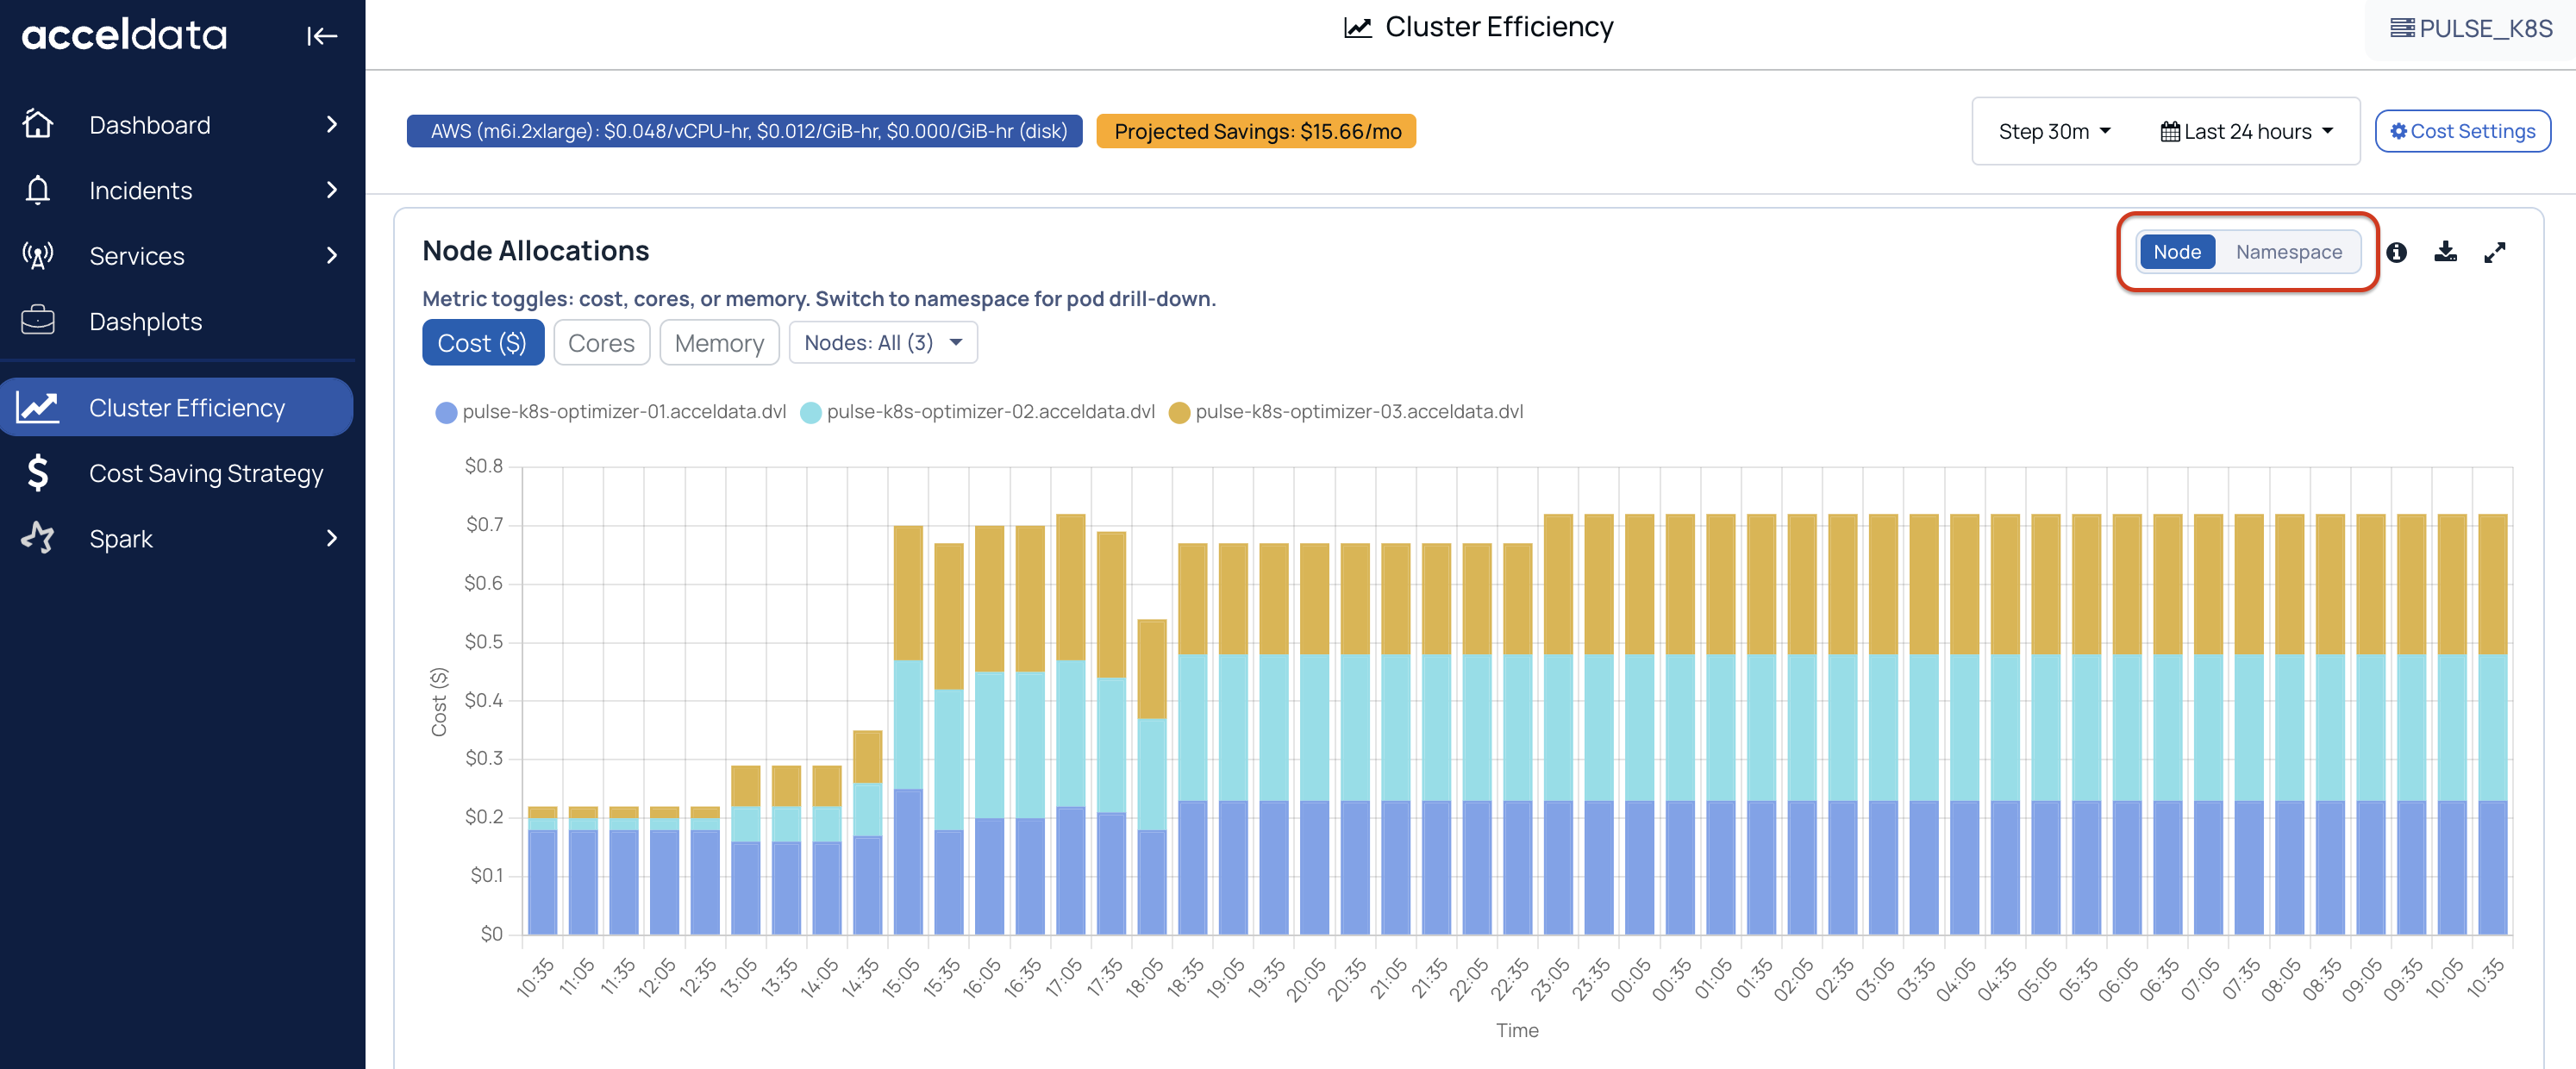
Click on a namespace to view pod details.
POD Allocation:
- Pod Count
- CPU Requests
- Memory Requests
- CPU Limits
- Memory Limits
POD Details:
- CPU Usage, CPU Request, CPU Waste, CPU Efficiency
- Memory Usage, Memory Request, Memory Waste, Memory Efficiency
Namespace Waste or Node Waste
- Shows waste per namespace and node based on the difference between requested and used resources.
- Clicking a namespace provides pod-level details (requests, usage-related efficiency/waste, and cost impact).
Click on a namespace to view pod details.
POD Allocation:
- Pod Count
- CPU Requests
- Memory Requests
- CPU Limits
- Memory Limits
POD Details:
- CPU Usage, CPU Request, CPU Waste, CPU Efficiency
- Memory Usage, Memory Request, Memory Waste, Memory Efficiency
CPU vs Memory Efficiency by Namespace
This helps in comparing namespace efficiency:
- One axis = CPU efficiency
- Other axis = memory efficiency
Namespaces closer to the “balanced” zone (100 percent) indicate healthier request-to-usage alignment; extremes indicate under- or over-request patterns.
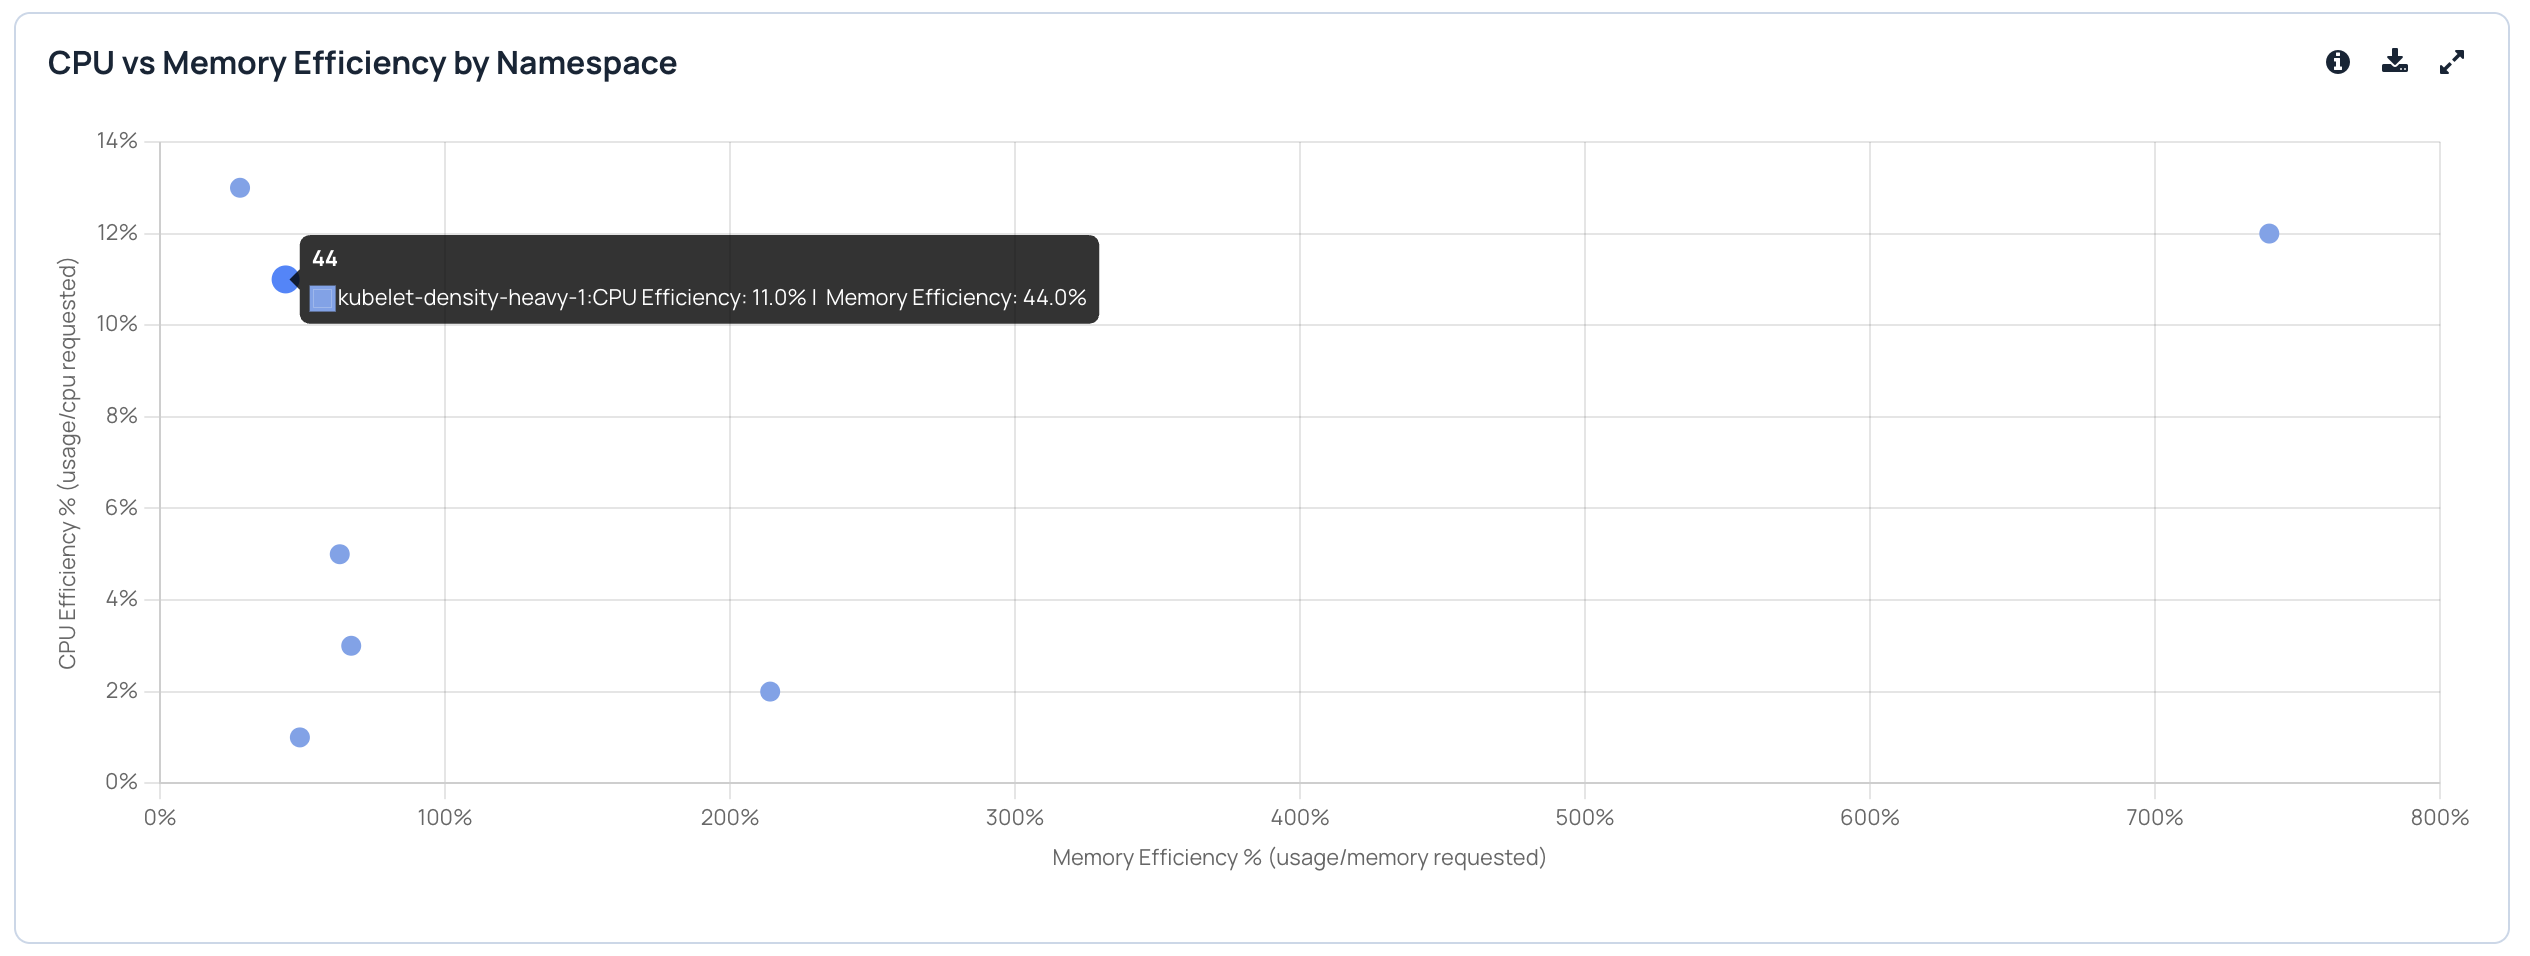
- If the efficiency is more than 100 percent, it means that the request value is a lot different than the actual usage.
- If the efficiency is less than 100 percent, it means that the usage is less than the requested value.
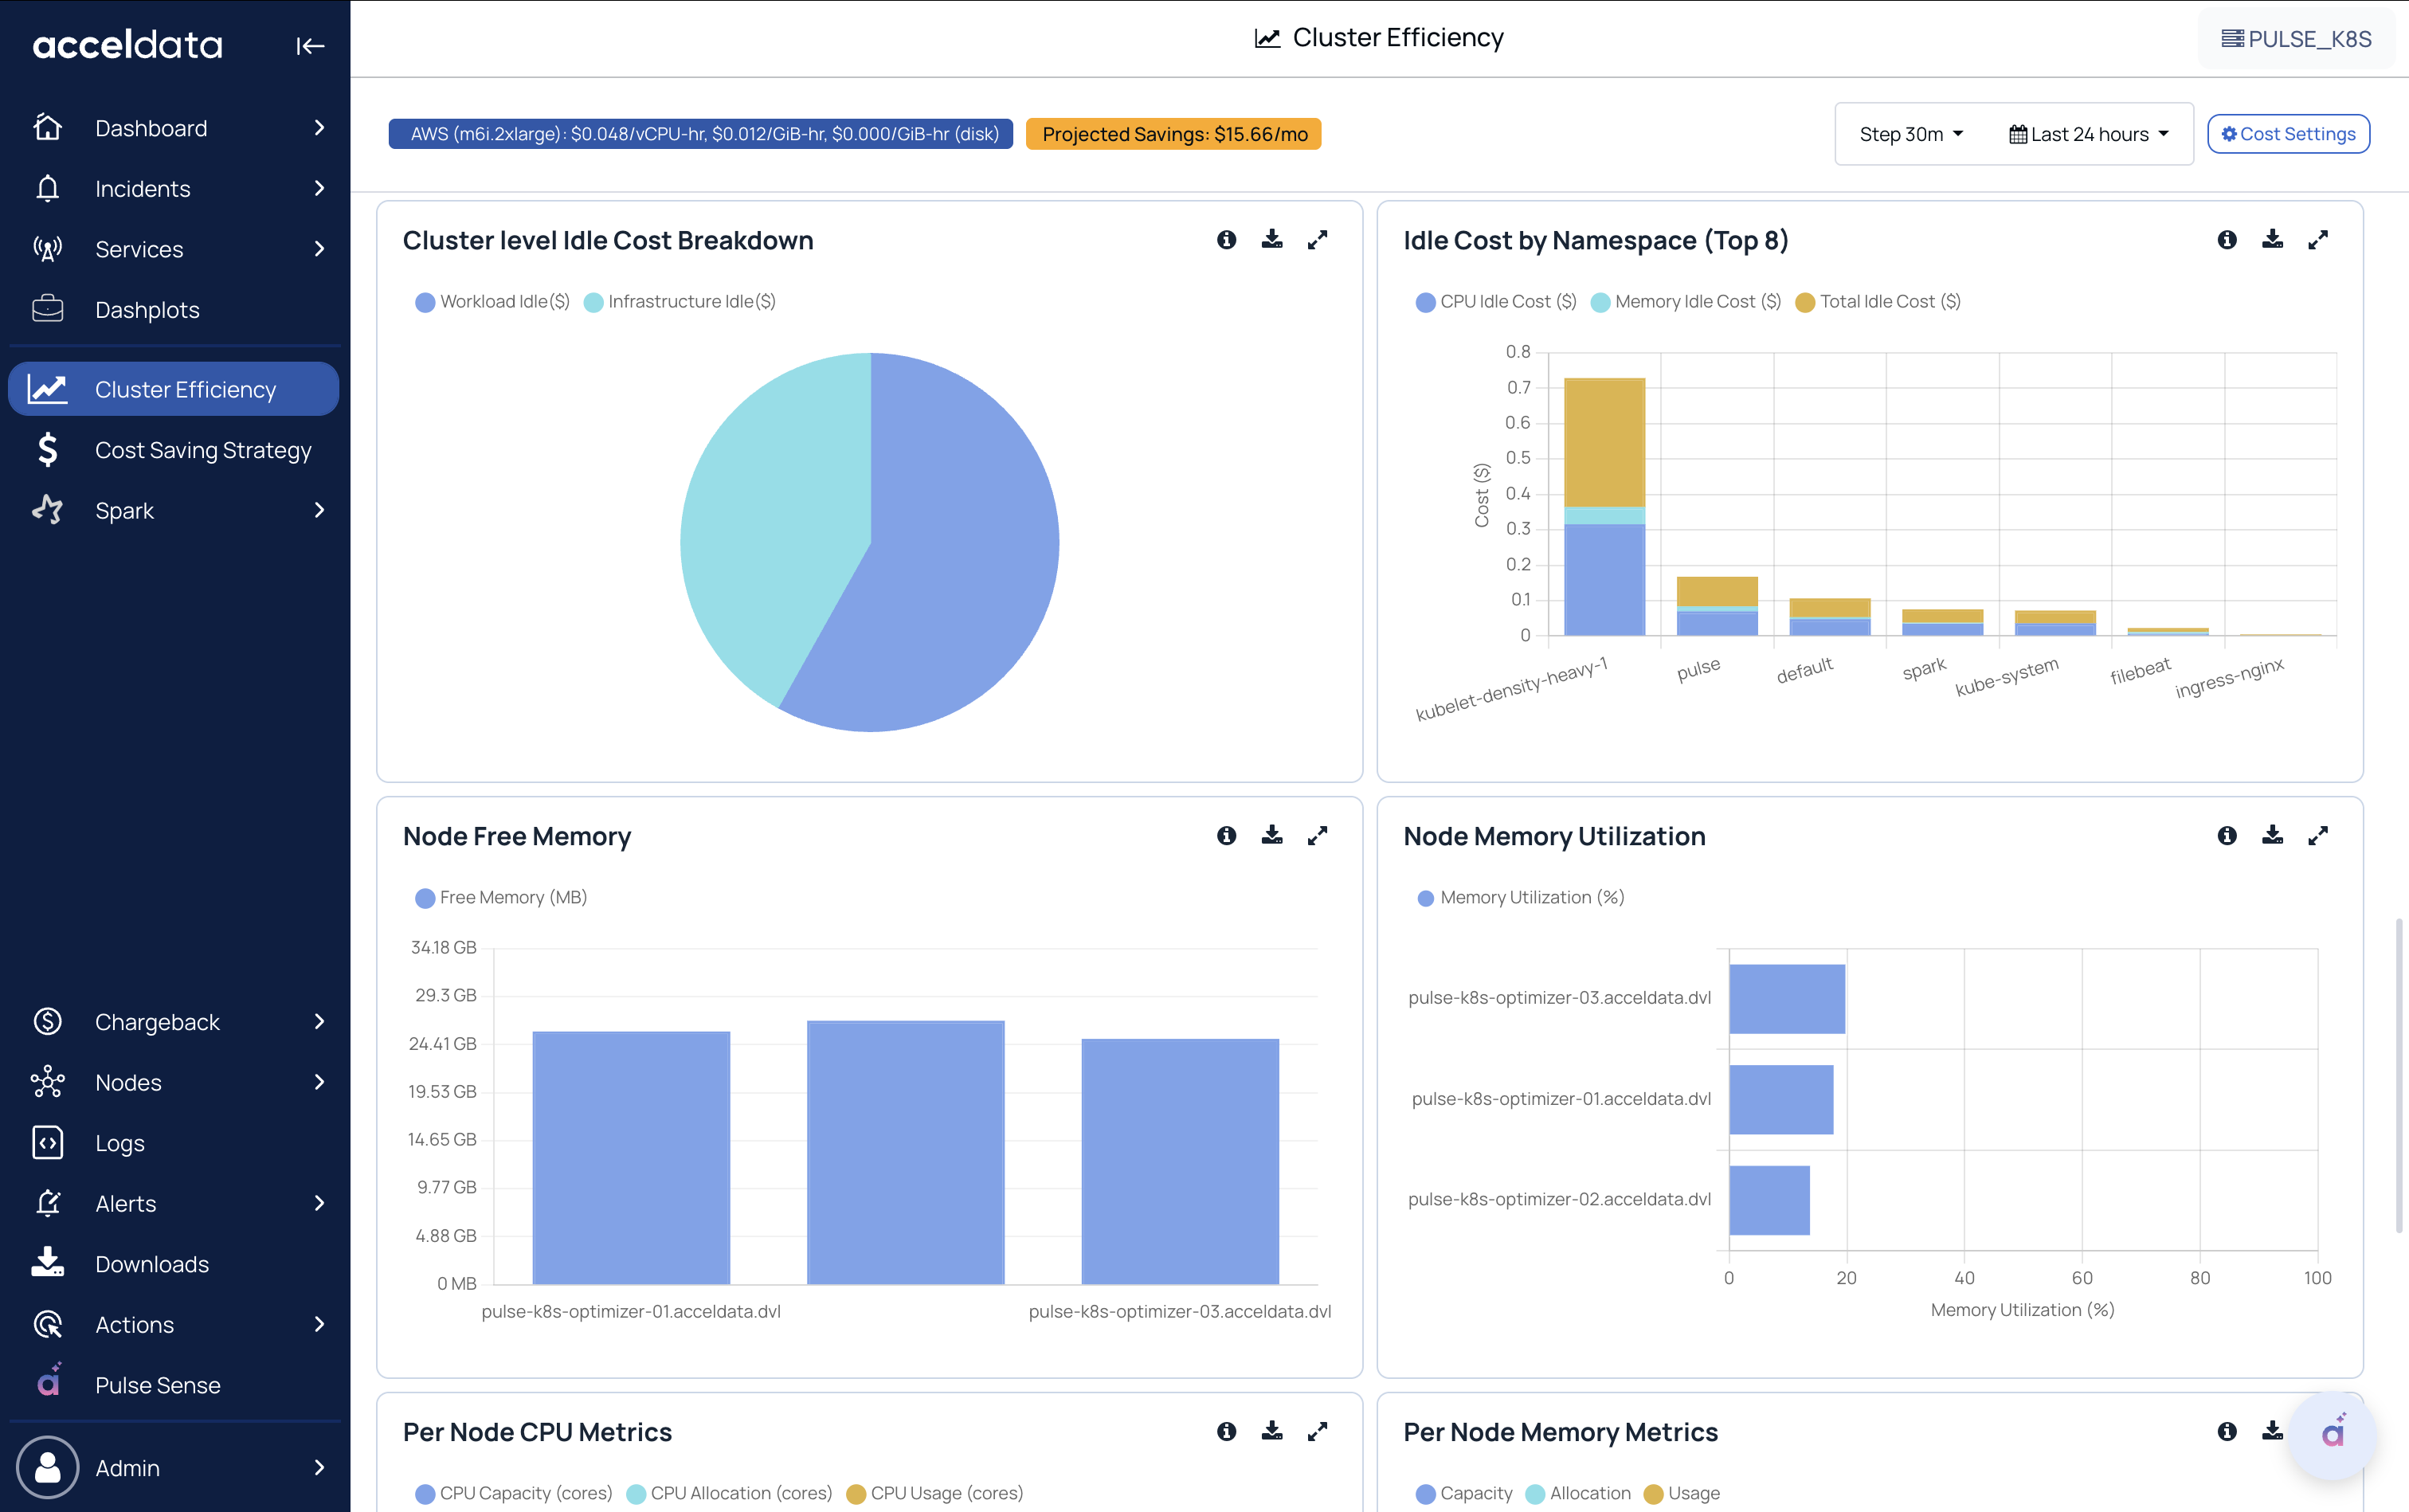
Cluster-Level Idle Cost Breakdown
Splits idle cost into:
- Workload idle (idle due to workload over-requesting)
- Infrastructure idle (idle due to cluster/node-level capacity not being utilized)
Idle Cost by Namespace (Top 8)
- Ranks namespaces that contribute the most to idle cost (CPU + memory).
- Useful to prioritize optimization efforts.
###
Other Details
Node Free Memory
- Shows available (free) memory per node.
- Useful for capacity planning and spotting nodes with headroom.
Node Memory Utilization
- Shows memory utilization % per node.
- Helps detect hotspots or imbalances across nodes.
Per Node CPU Metrics
- Compares CPU Usage vs CPU Allocation at the node level.
- Helps identify nodes with consistent over-allocation or underutilization.
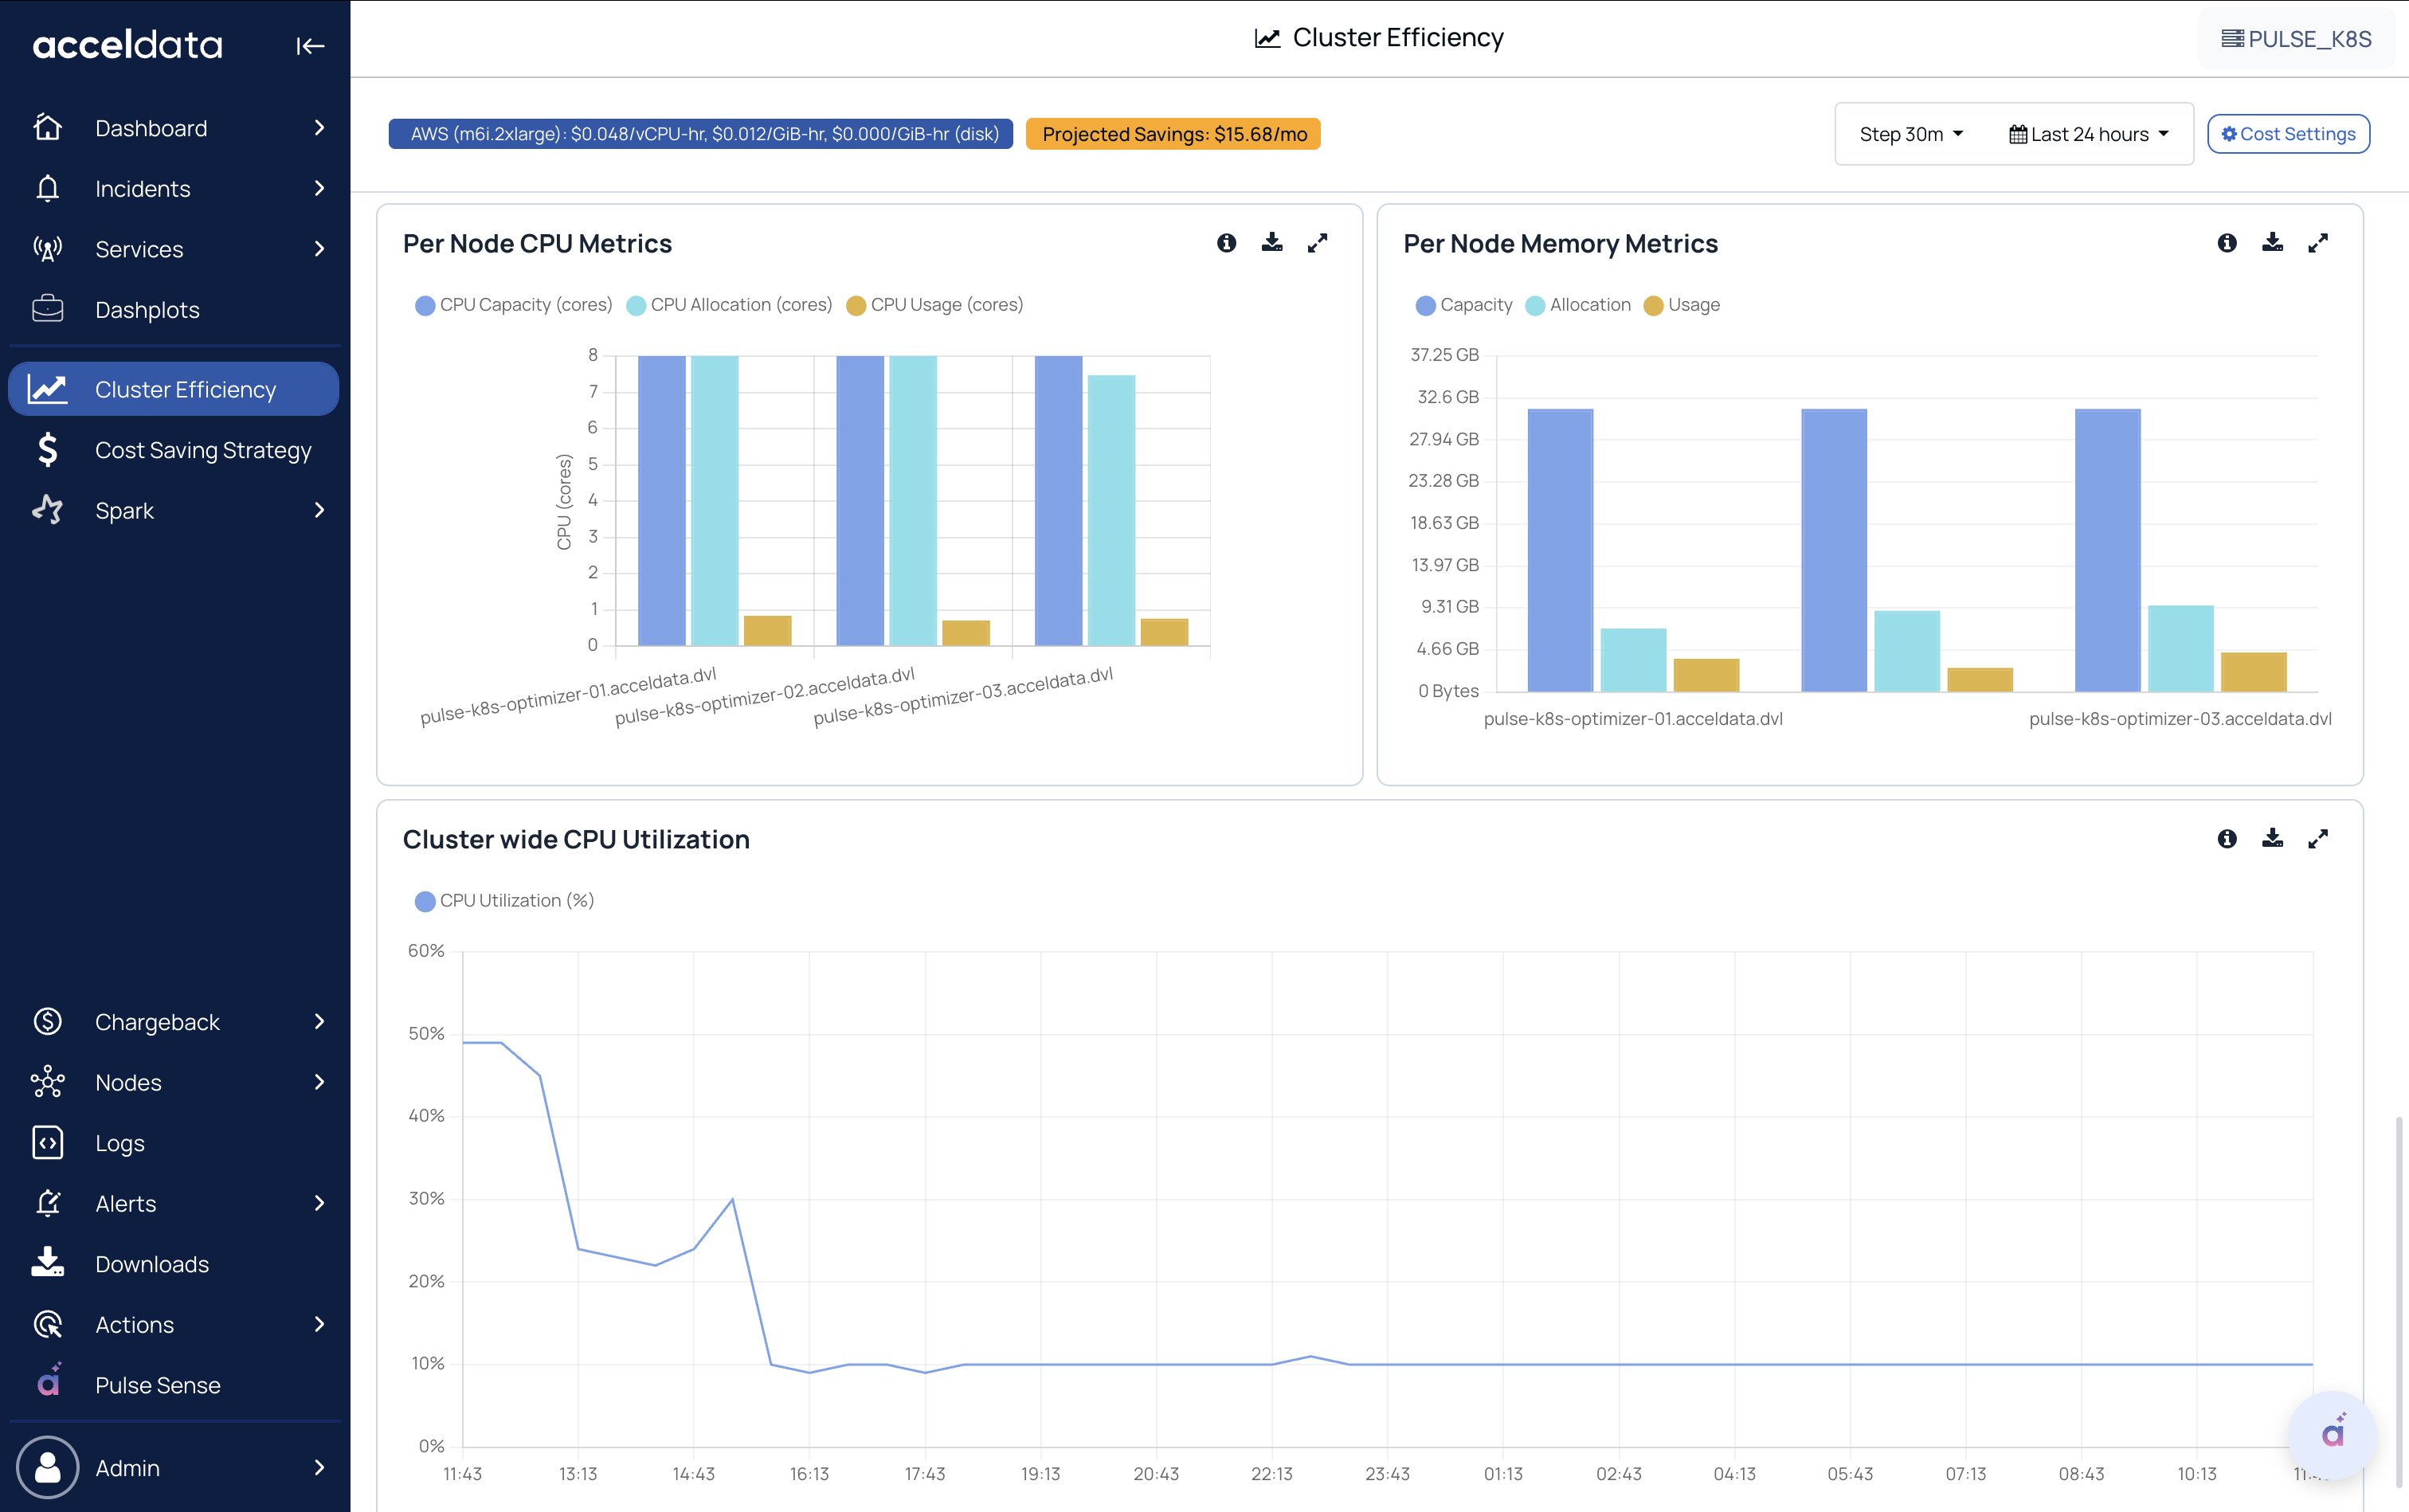
Per Node Memory Metrics
- Compares Memory Usage vs Memory Allocation at the node level.
- Highlights nodes where memory is frequently over-requested.
Cluster-Wide CPU Utilization
- Time-series trend of overall CPU utilization across the cluster (all nodes combined).
- Helps correlate workload activity and cluster scaling behavior.