You can use the Savings potential capability to find and act on the biggest Kubernetes cost-saving opportunities in your cluster.
Pulse groups recommendations into six strategies—one automated strategy that can reclaim unused CPU and memory capacity, and five advisory strategies that help you identify and clean up waste (idle workloads, over/under-sized containers, and unused or over-provisioned storage).
Each strategy highlights where the waste is, the estimated savings, and the resources involved, so you can prioritize actions confidently.
Steps
- In the Pulse UI, go to Cost Saving Strategy.
- The cost-saving strategies appear.
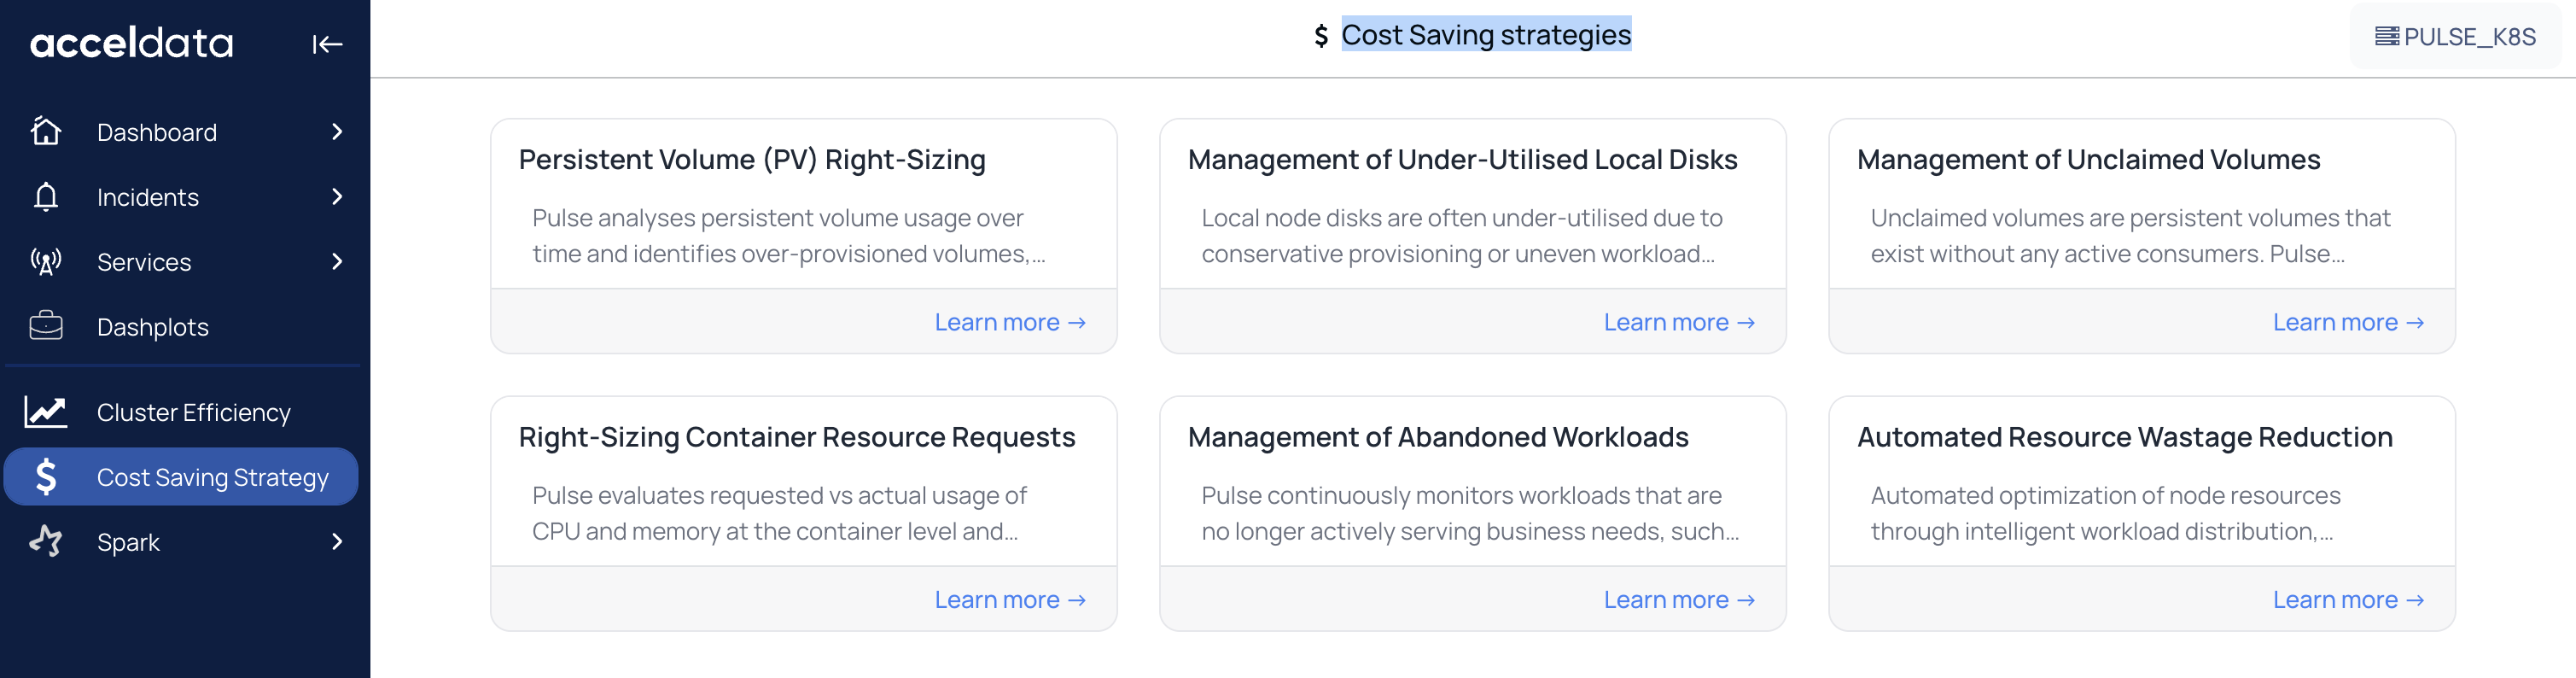
Automated Resource Wastage Reduction
Pulse automatically reuses unused requested capacity to improve node utilization and reduce infrastructure costs.
Summary Panel
You can see the following details in the summary panel.
- CPU Efficiency and Memory Efficiency
- CPU Cost Saved and Memory Cost Saved
- PODs Optimized: Pods that could run because reclaimed capacity was made available.
- Total Saved
- Pods Optimized represent pods that were able to run beyond the original node capacity due to reclaimed resources from the optimizer.
- CPU Cost Saved and Memory Cost Saved reflect the resource requests of those optimized pods.
A visual graph shows unutilized and optimized resources at the namespace, node, and and levels.
Also, you can see the ROI tab that provides a concise overview of the benefits provided by the optimizer.
####
The Namespace Tab
Filter by Cost, Cores, or Memory to view:
- Namespace-Level Unutilized Resources
- Namespace-Level Optimized Resources
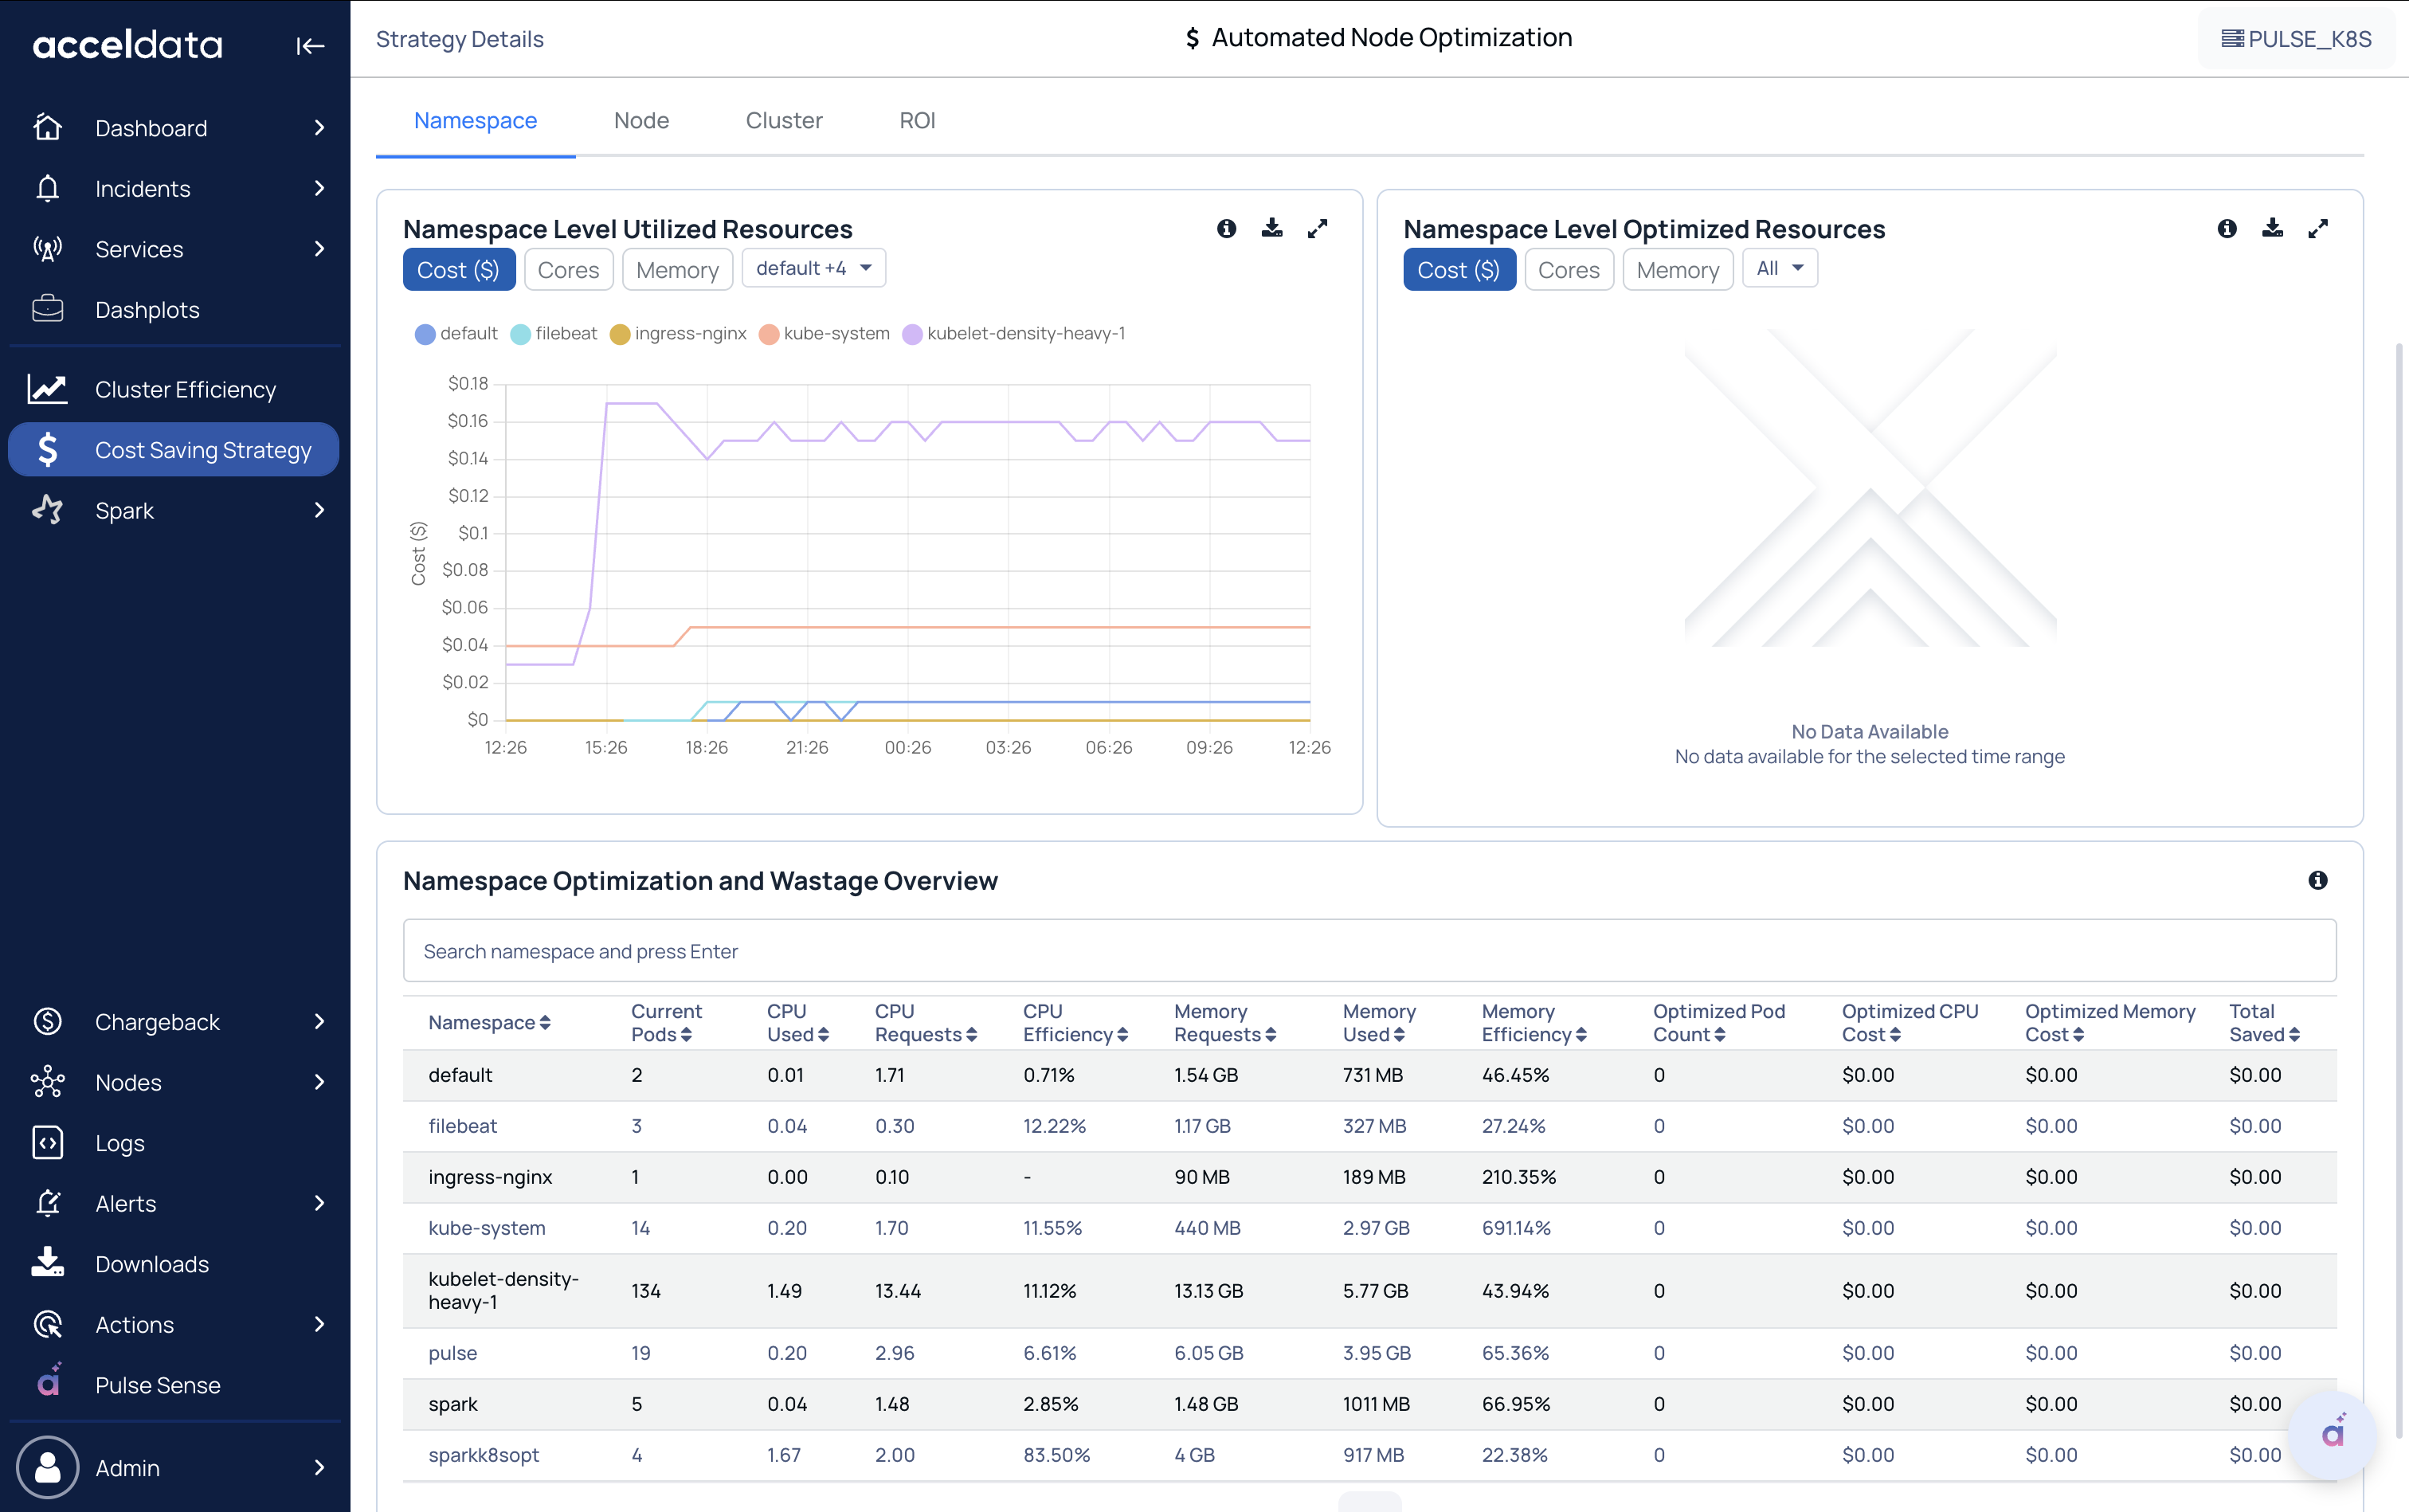
Namespace Optimization and Wastage Overview
For each namespace, Pulse provides the following metrics:
- Pods running currently
- CPU Requests, CPU Used, and CPU Efficiency
- Memory Requests, Memory Used, Memory Efficiency
- Optimized Pod count, Optimized CPU cost, and Optimized memory cost
- Total saved
When the Kubernetes Optimizer is enabled, CPU or memory wastage (CPU/Memory Request − CPU/Memory Used) may appear higher. This occurs because the optimizer allows more pods to run using reclaimed capacity.
The Nodes Tab
Filter by Cost, Cores, or Memory to view:
- Node-level Unutilized Resources
- Node-level Optimized Resources
- Concurrent Running Pods by Node
- Node Level Resource Requests
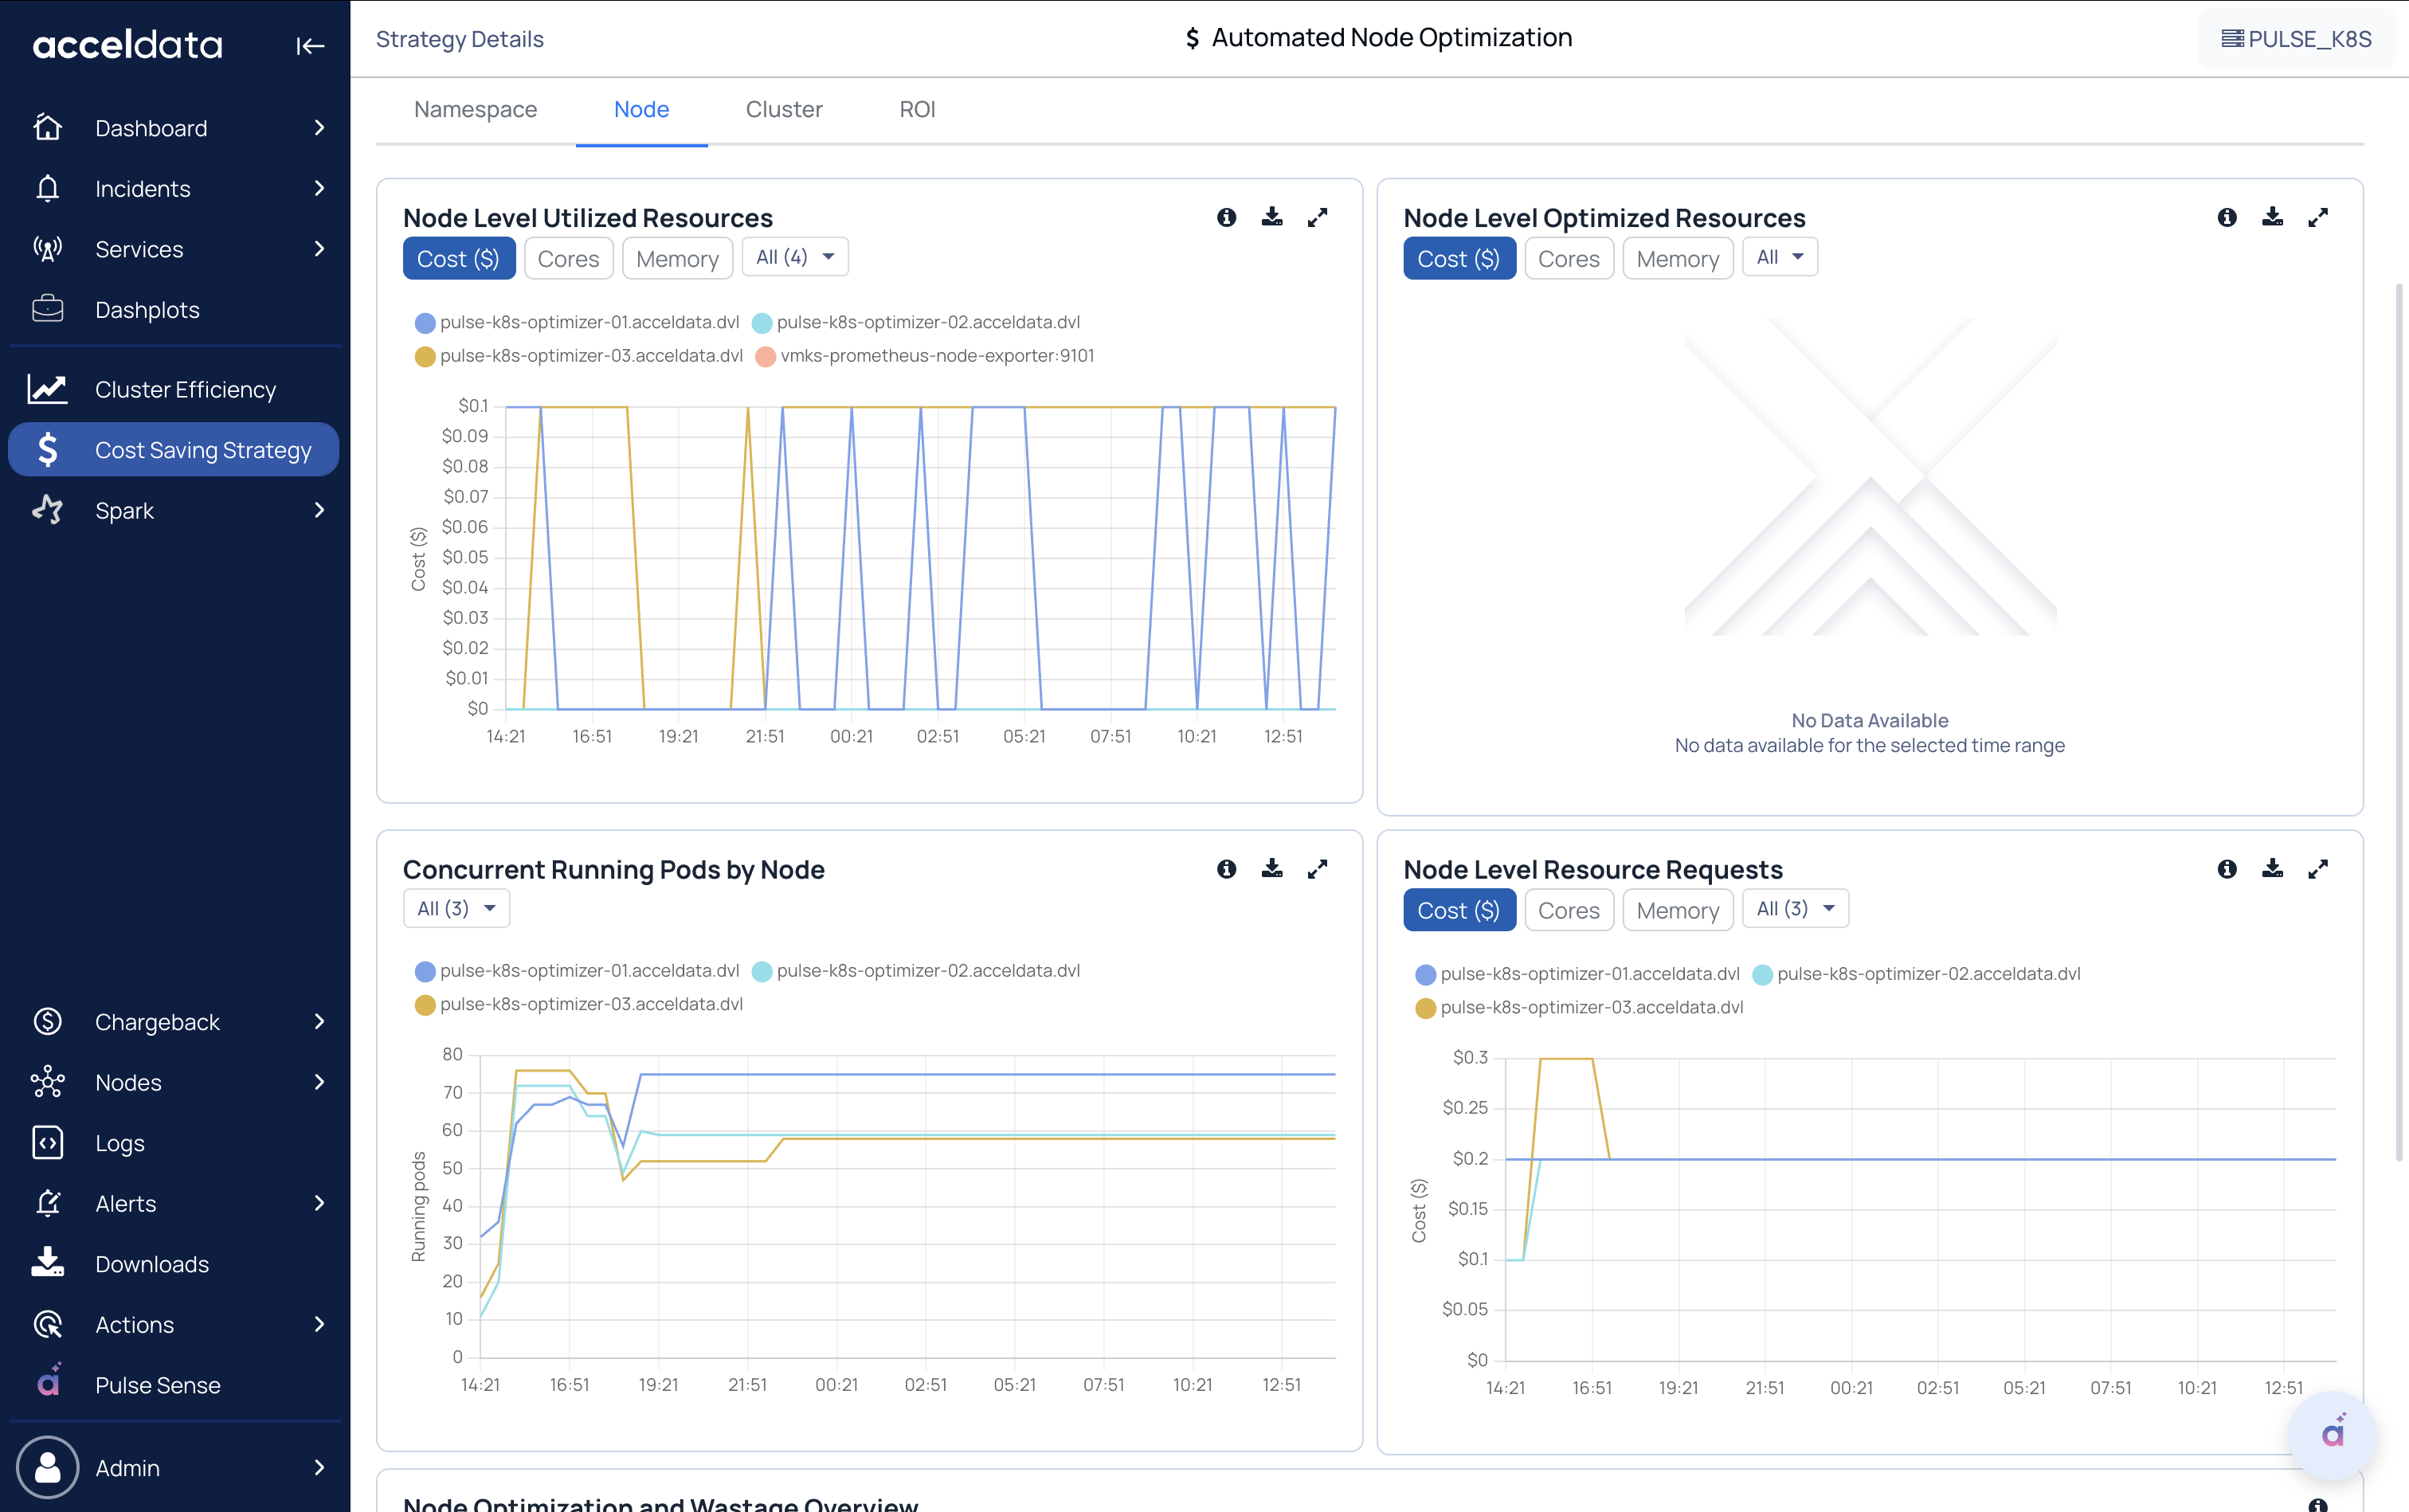
Node Optimization and Wastage Overview
For each node, Pulse provides the following metrics:
- No of Pods running currently, POD limit
- CPU Requests, CPU Used, CPU Efficiency
- Memory Requests, Memory Used, Memory Efficiency
- Optimized Node Count, Optimized CPU Cost, Optimized Memory Cost
- Total Saved
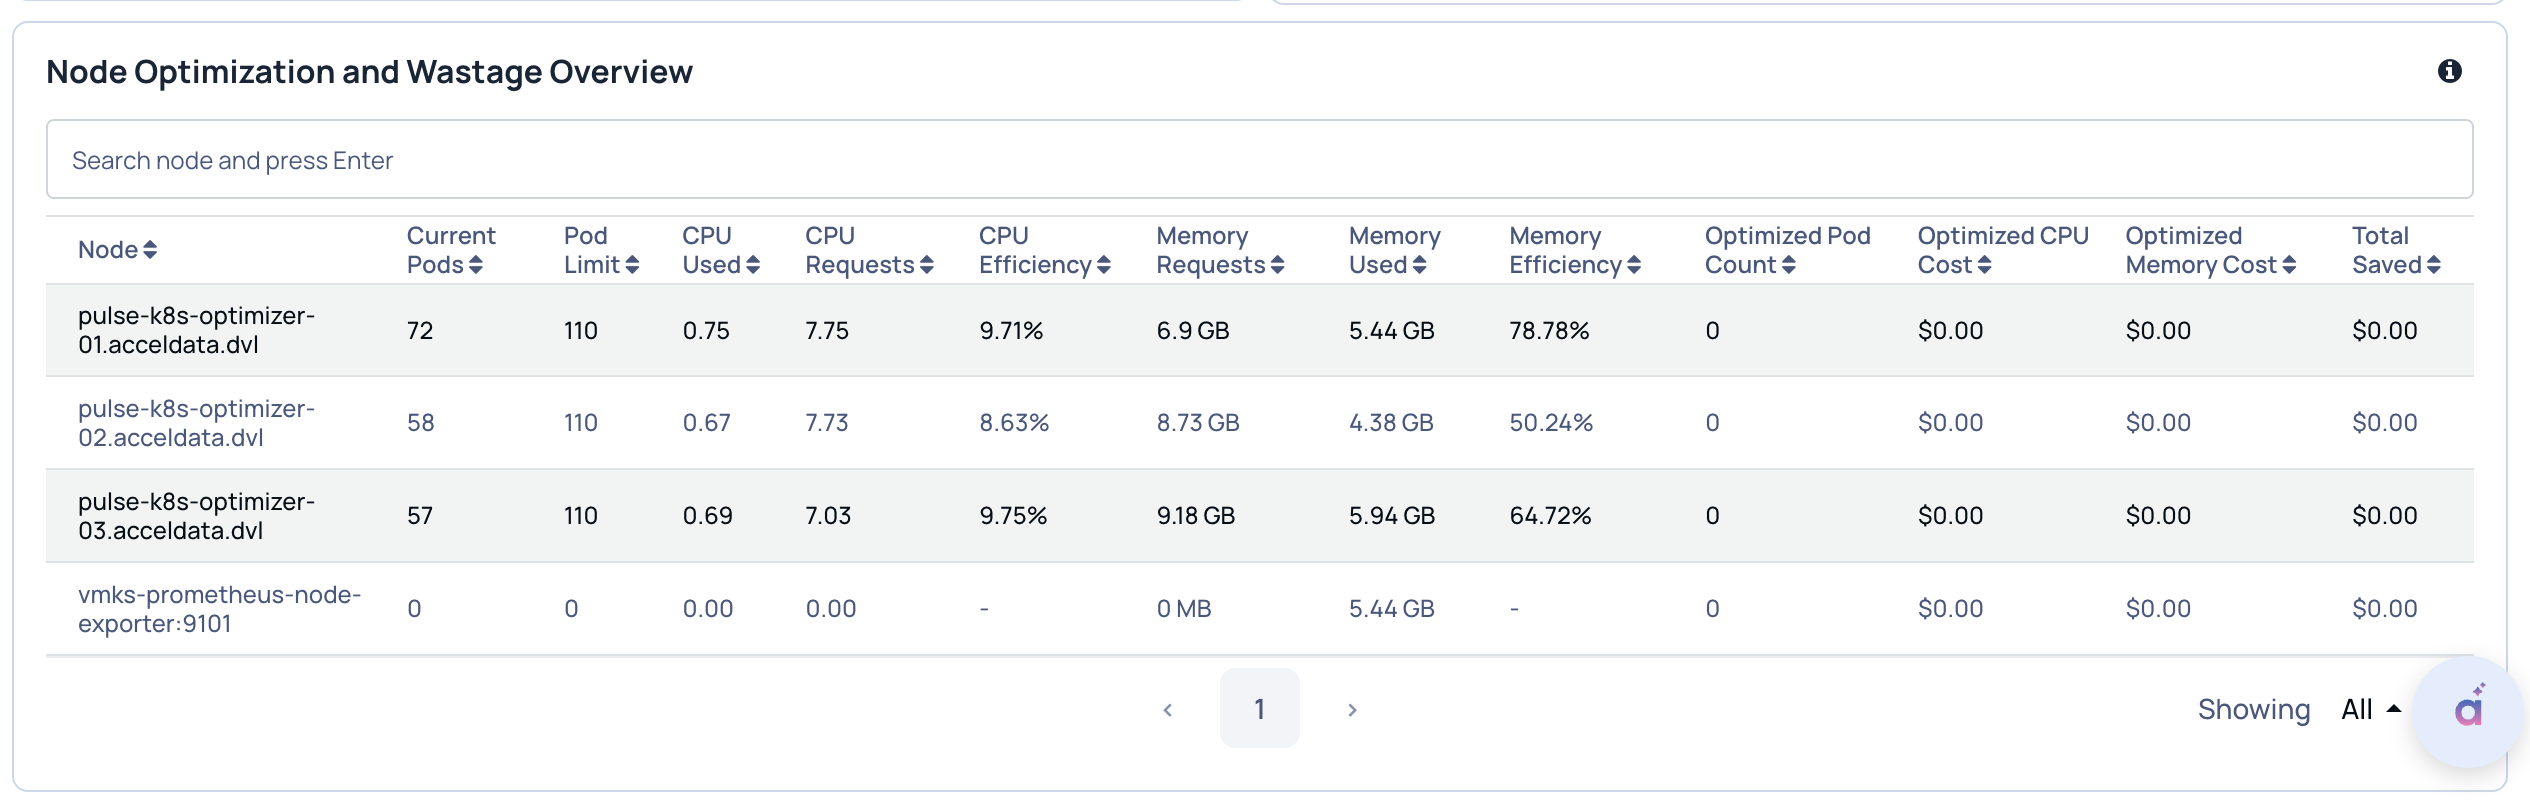
When the Kubernetes Optimizer is enabled, CPU or memory wastage (CPU/Memory Request − CPU/Memory Used) may appear higher. This occurs because the optimizer allows more pods to run using reclaimed capacity.
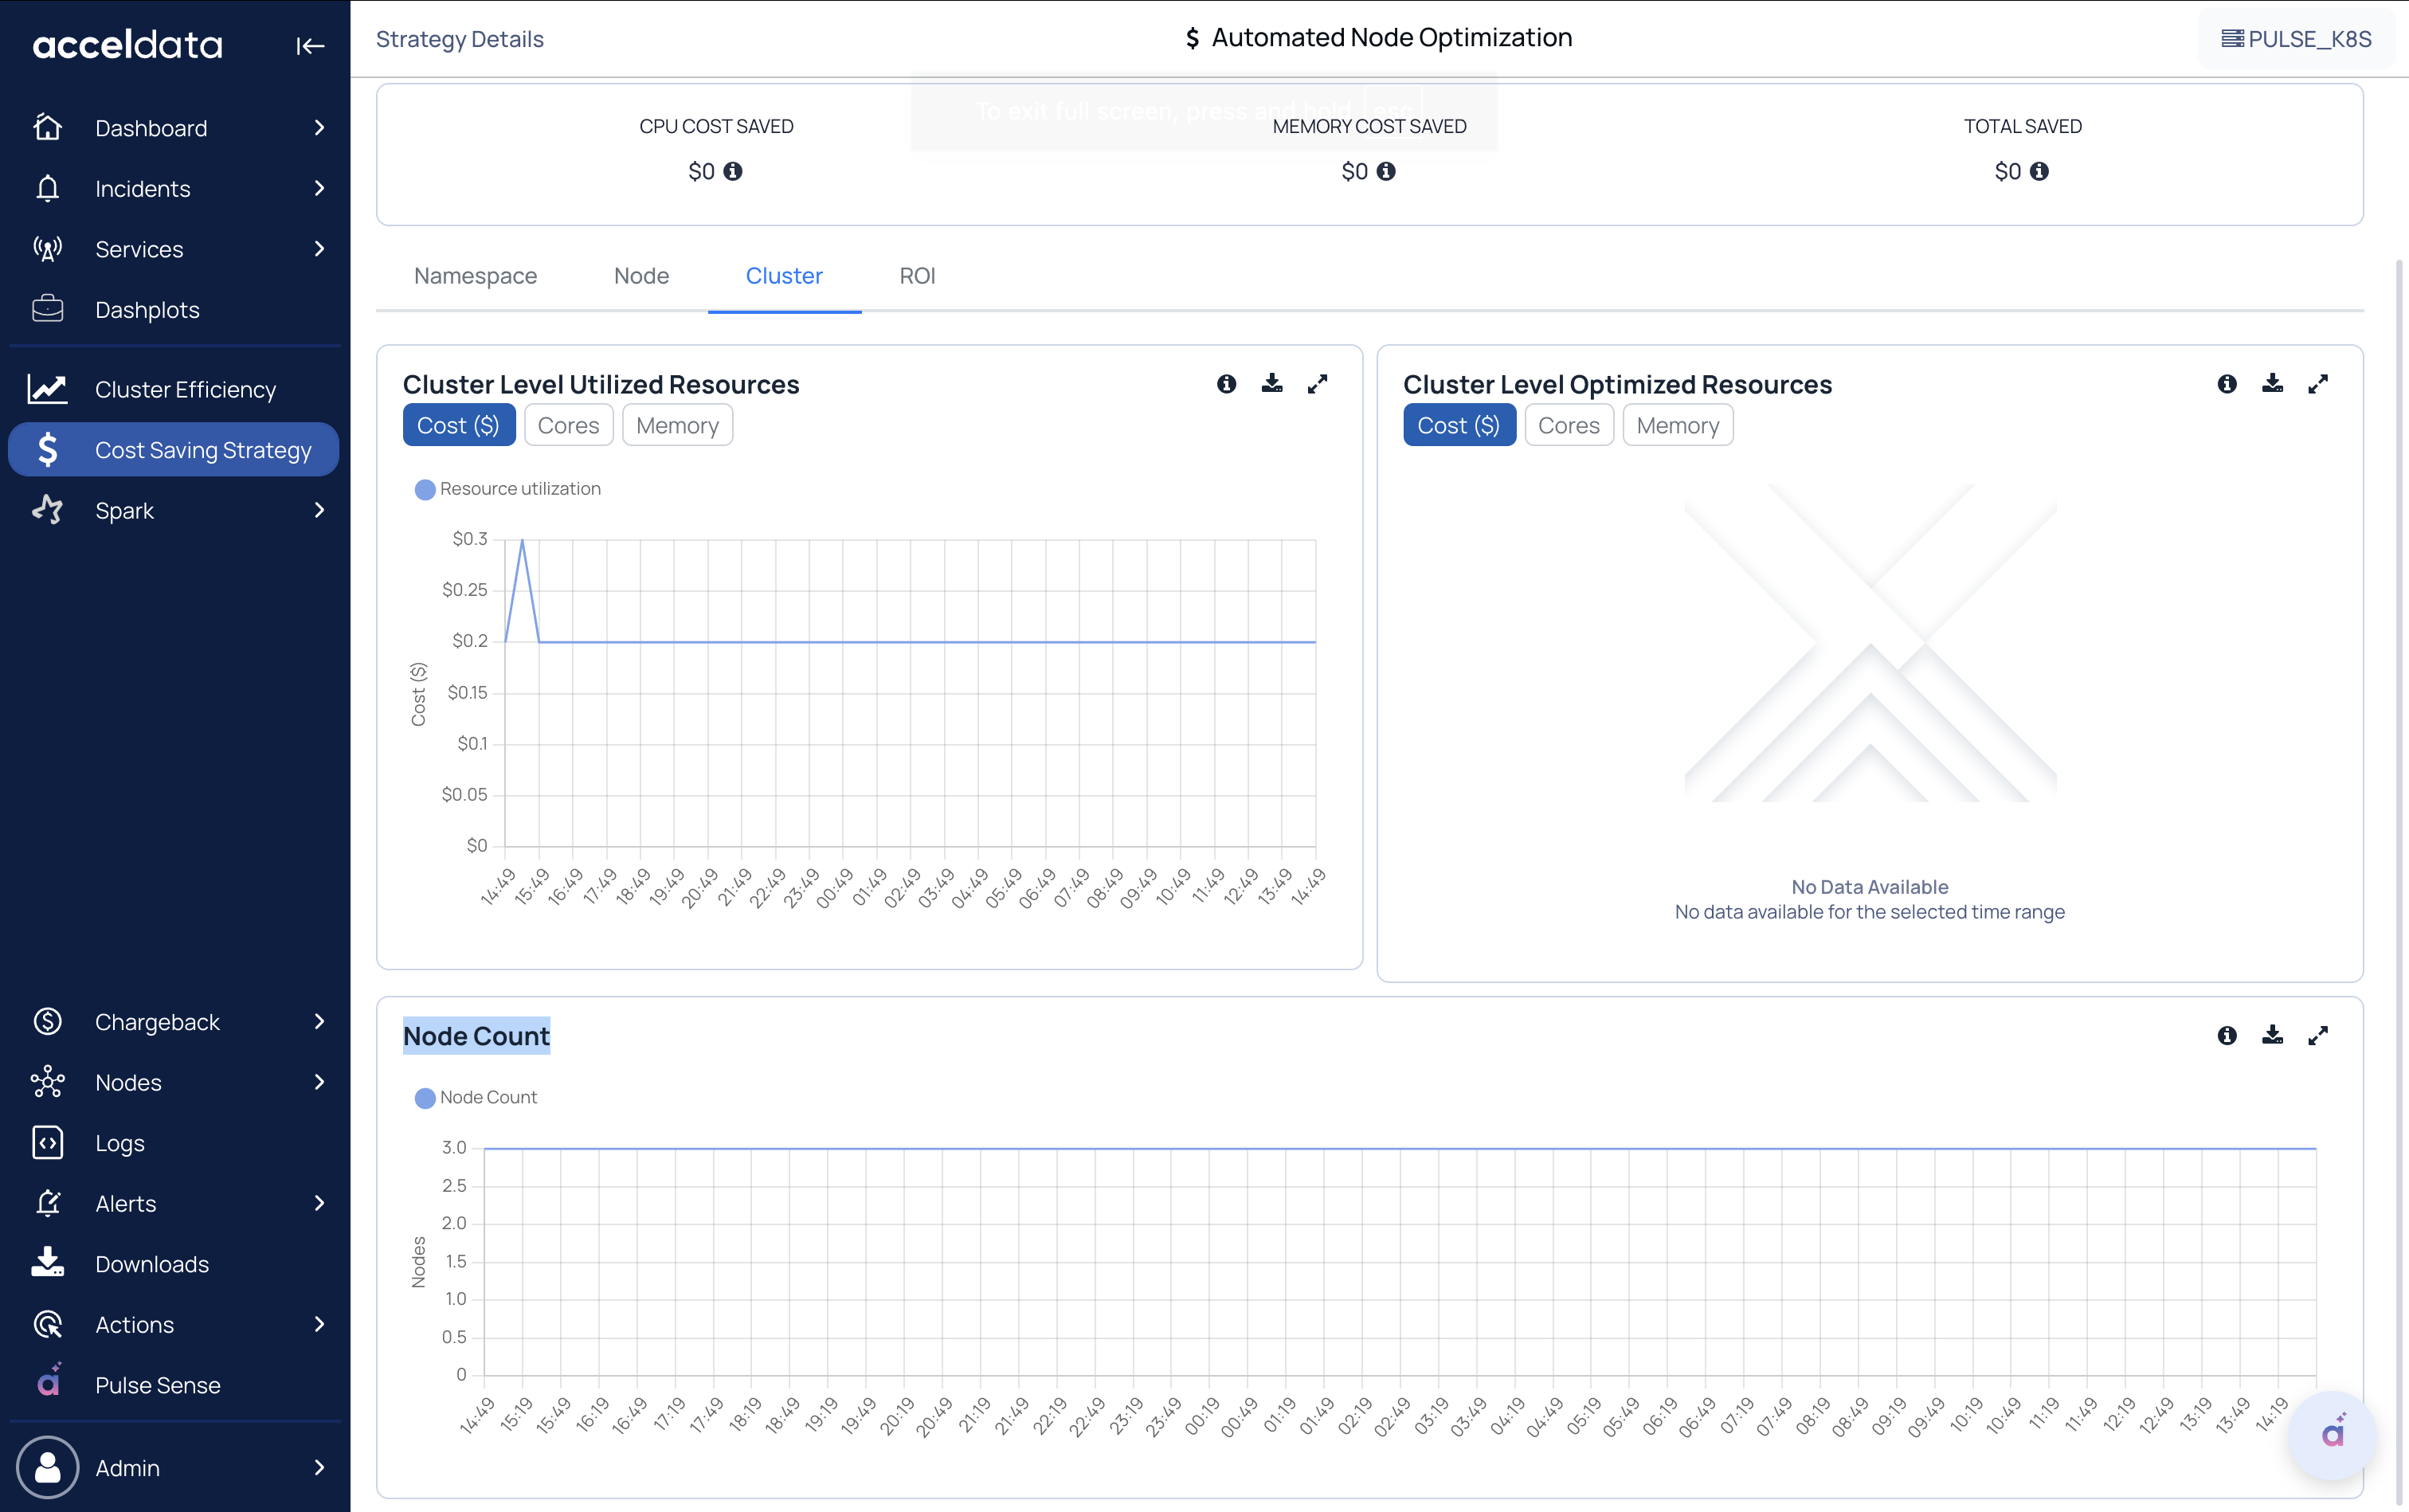
The Cluster Tab
Filter by Cost, Cores, or Memory to view:
- Cluster-Level utilized Resources
- Cluster-Level Optimized Resources
- Node Count
The ROI Tab
- This tab provides a concise overview of the benefits provided by the optimizer at the cluster level.
- The following charts are shown:
- Concurrent running pods
- Cluster Level Resource Requests
- Cluster Resource Utilization vs Unutilized
Configuration
You can also configure this strategy from the UI:
- Optimizer config: For details about the configuration, see Configure the Kubernetes Optimizer Calculator.
- Webhook config: For details about the configuration, see Configure a Webhook.
Management of Abandoned Workloads (advisory)
Pulse identifies workloads that are no longer serving business needs, such as:
- Pods stuck in non-terminal states
- Unscheduled Jobs or CronJobs still consuming resources
- Deployments with zero traffic or no active consumers
This helps teams reclaim unused CPU, memory, and storage.
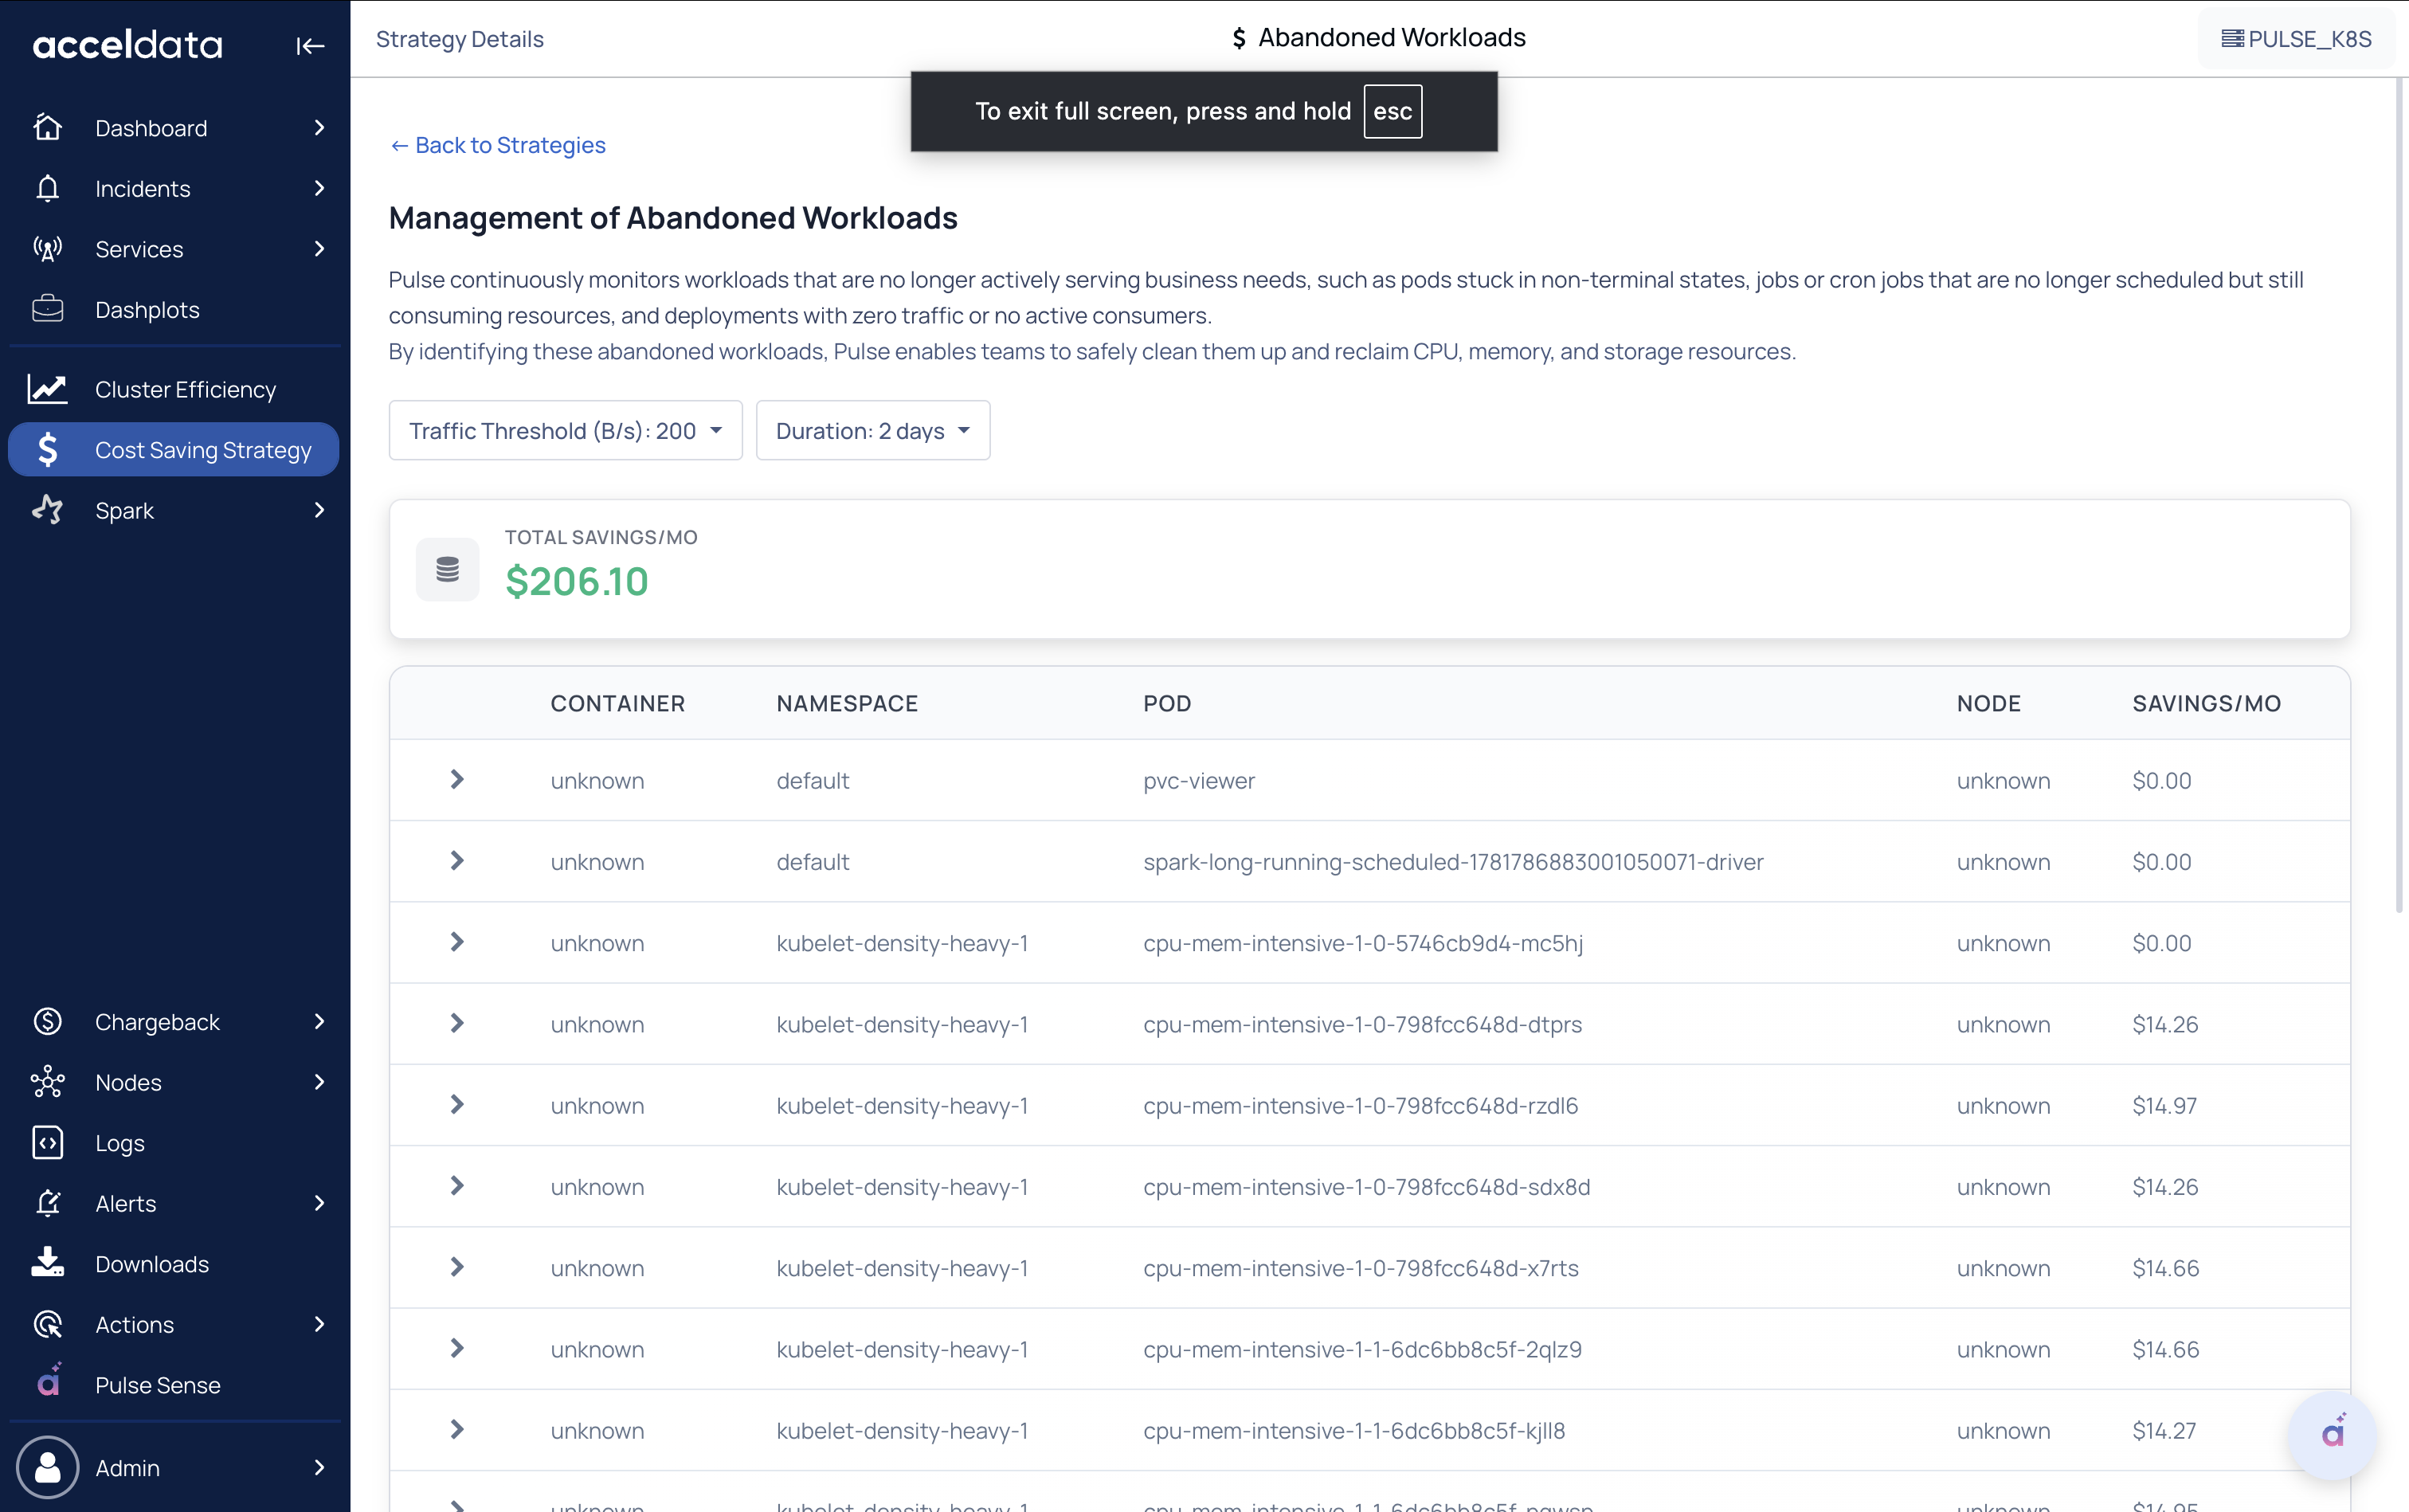
Idle Pod Detection
Users define:
- Traffic Threshold (Bytes/sec): Select from a drop-down (e.g., 0, 100, 200 B/s, etc.)
- Duration: Define how long the pod must remain below the threshold (e.g., 2 days, 7 days, 30 days)
Pulse flags pods that remain below the threshold for the selected period.
Action
Review the list, delete or scale down unused workloads, and use estimated monthly savings to prioritize cleanup.
Right-sizing Container Resource Requests (advisory)
The Container Rightsizing dashboard provides visibility into Kubernetes container resource efficiency by comparing requested vs. actual CPU and memory usage at the container level. It identifies:
- Over-requested containers lead to resource fragmentation and reduced bin-packing efficiency.
- Under-requested containers may introduce performance and stability risks.
Based on the observed usage trends, Pulse generates right-sizing recommendations (and optionally automated actions) to optimize resource requests and improve overall cluster utilization.
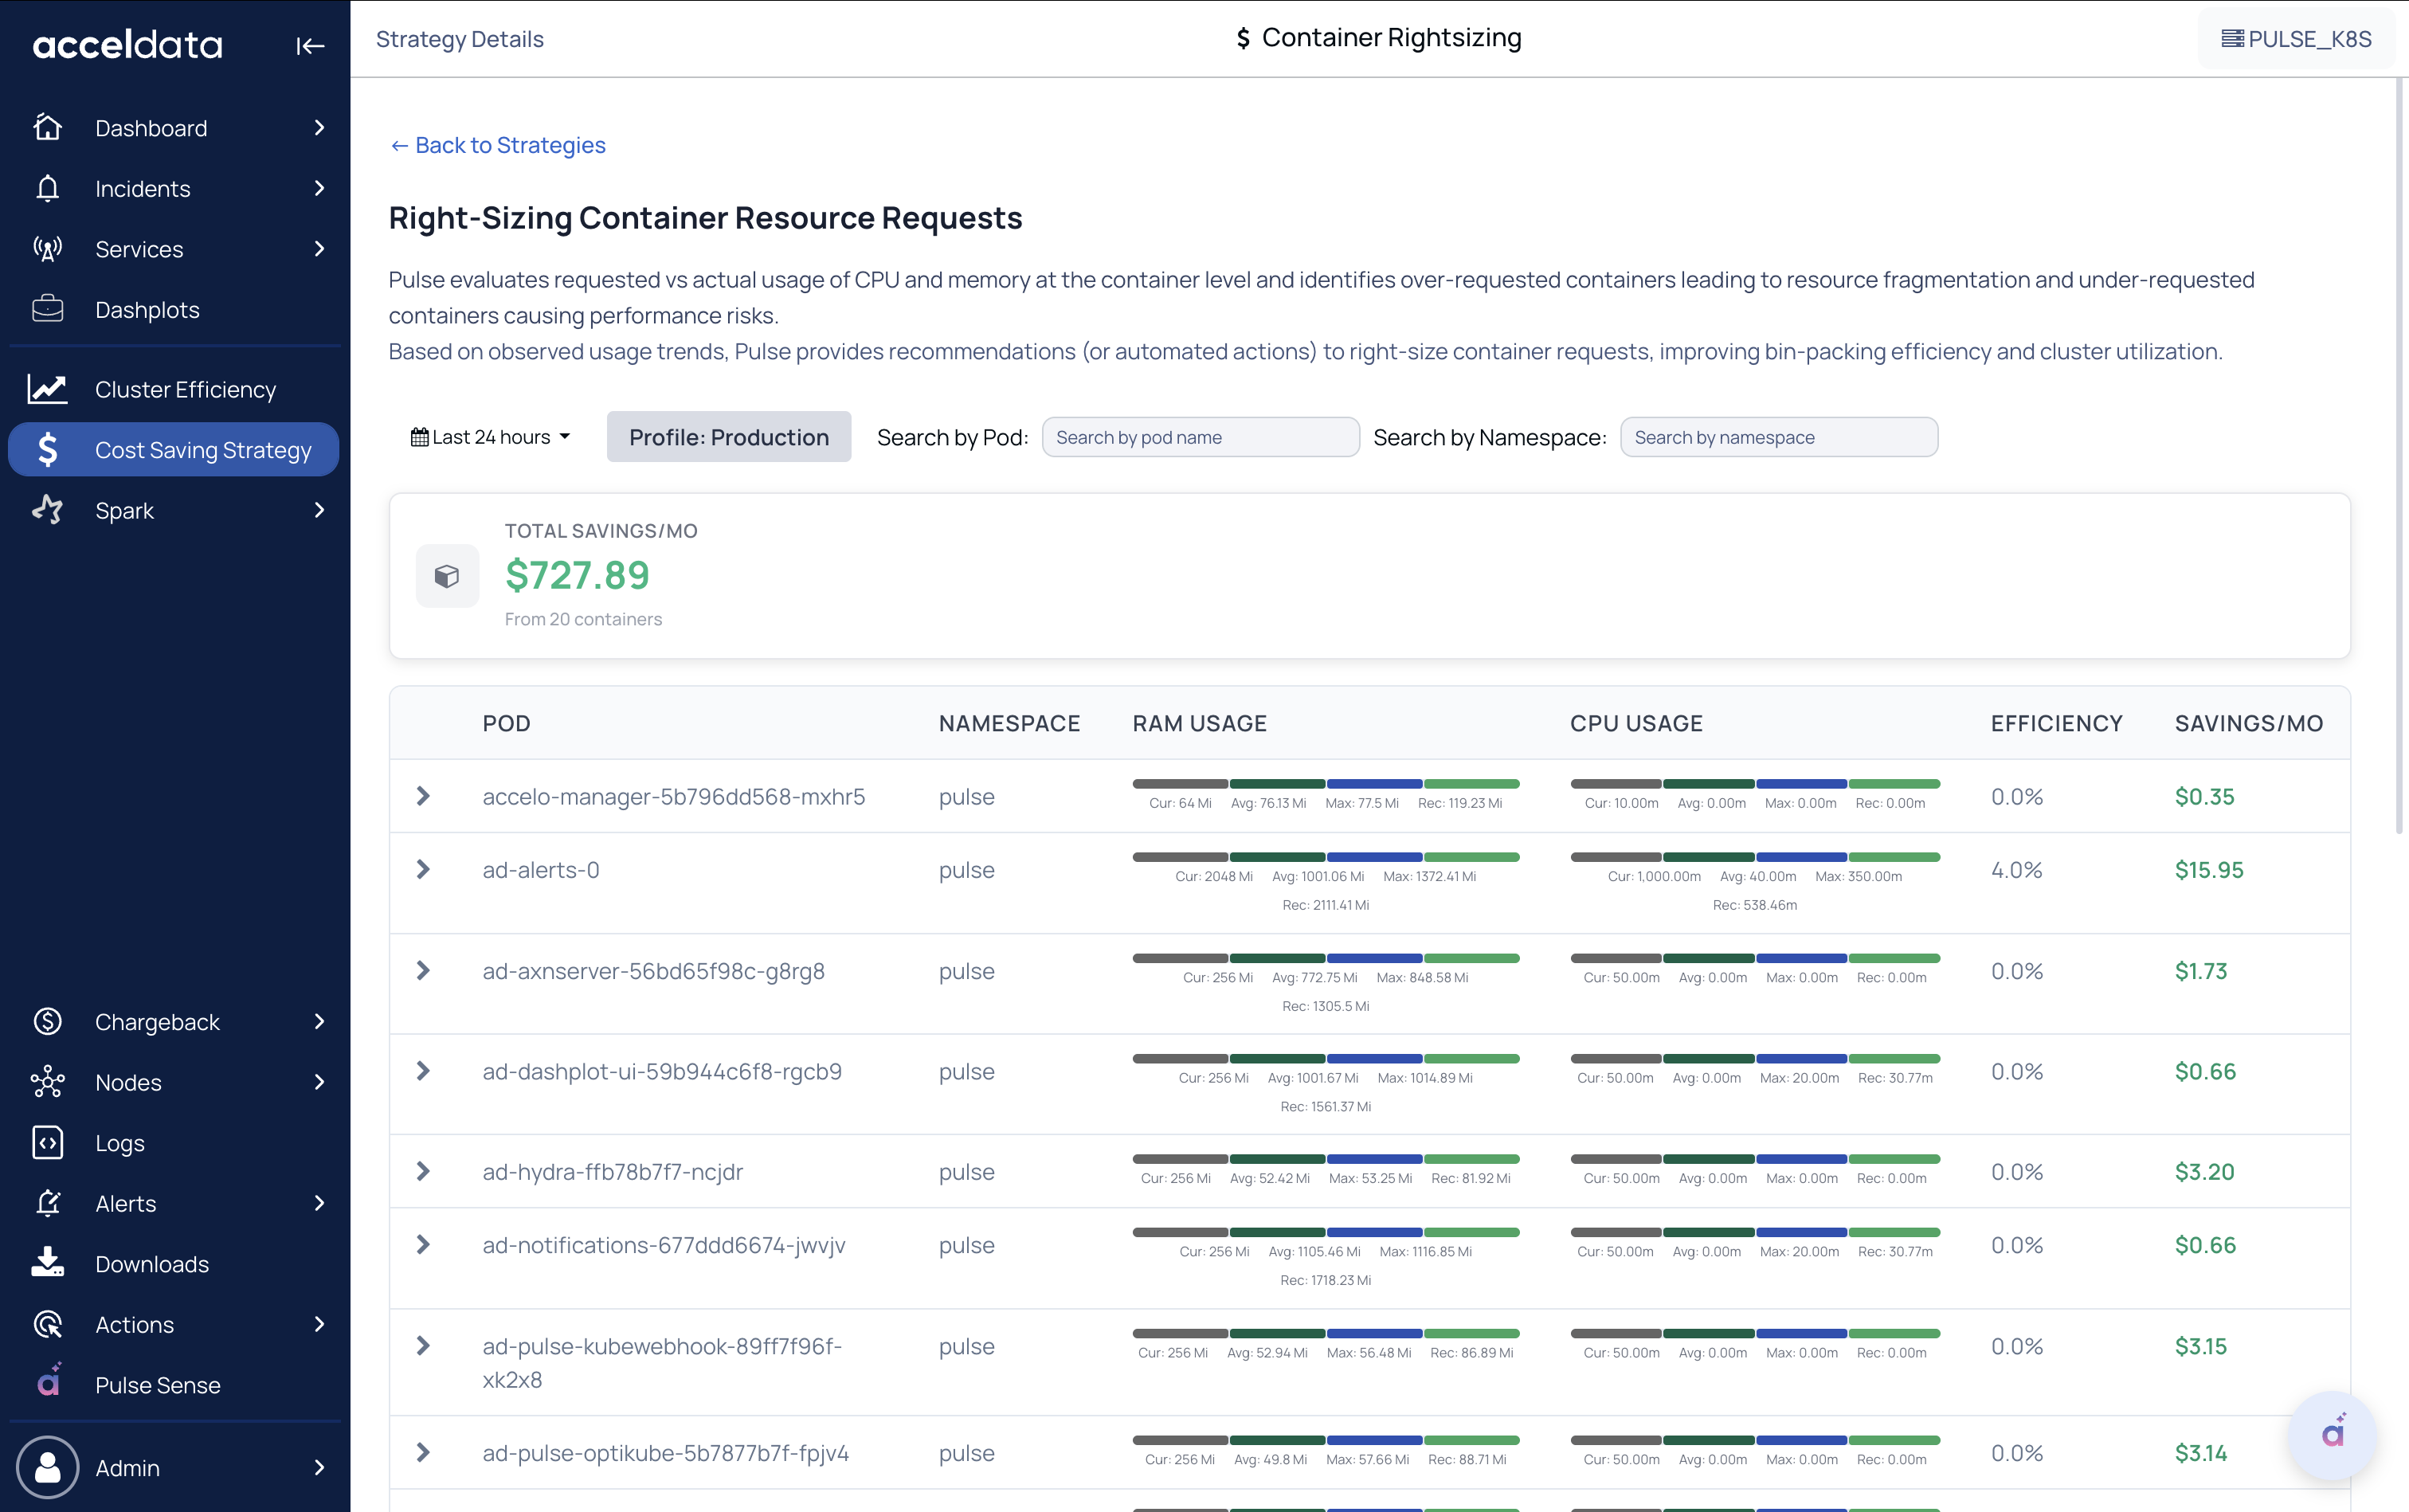
You can:
- Choose environment profile (e.g., Production)
- Search by pod name
- Filter by namespace
Key Capabilities:
Savings Estimation
- Displays total projected monthly savings from recommended right-sizing actions.
- Example: $243.85/month across 20 containers (Production profile).
Container-Level Analysis
For each pod and container, the dashboard provides:
- Current vs. Recommended CPU Requests
- Current vs. Recommended RAM Requests
- Current, Average, and Maximum Usage
- Efficiency Score
- Estimated Monthly Savings
Customize Request Sizing Recommendations
Select Profile: Production to customize the recommendations.
Select the details as needed:
Profile: Select Development, Production, etc.
CPU recommendation algorithm:
- Select Maximum, percentile of average, or percentile of maximum
- Recommendations that keep utilization below the target at all times.
RAM recommendation algorithm:
- Select Maximum, percentile of average, percentile of maximum
- Recommendations that keep utilization below the target at all times.
CPU target utilization:
- Enter the target utilization. For example, .8. The optimizer keeps the CPU utilization below 80 percent.
- Recommendations will aim to keep utilization below this percentage.
RAM target utilization:
- Enter the target utilization. For example, .7. The optimizer keeps the RAM utilization below 70 percent.
- Recommendations will aim to keep utilization below this percentage.
Click Save.
Usage Metrics
Each resource dimension includes:
- Current usage
- Average observed usage
- Maximum observed usage
- Recommended request value
These insights help determine whether workloads are:
- Over-provisioned (low utilization vs. request)
- Under-provisioned (high utilization vs. request)
- Properly sized
Management of Unclaimed Volumes (advisory)
Identify persistent volumes that exist without active consumers.
Why it matters:
- Orphaned volumes can silently increase storage cost over time.
What you do:
- Review flagged volumes and decide whether to delete or reuse them.
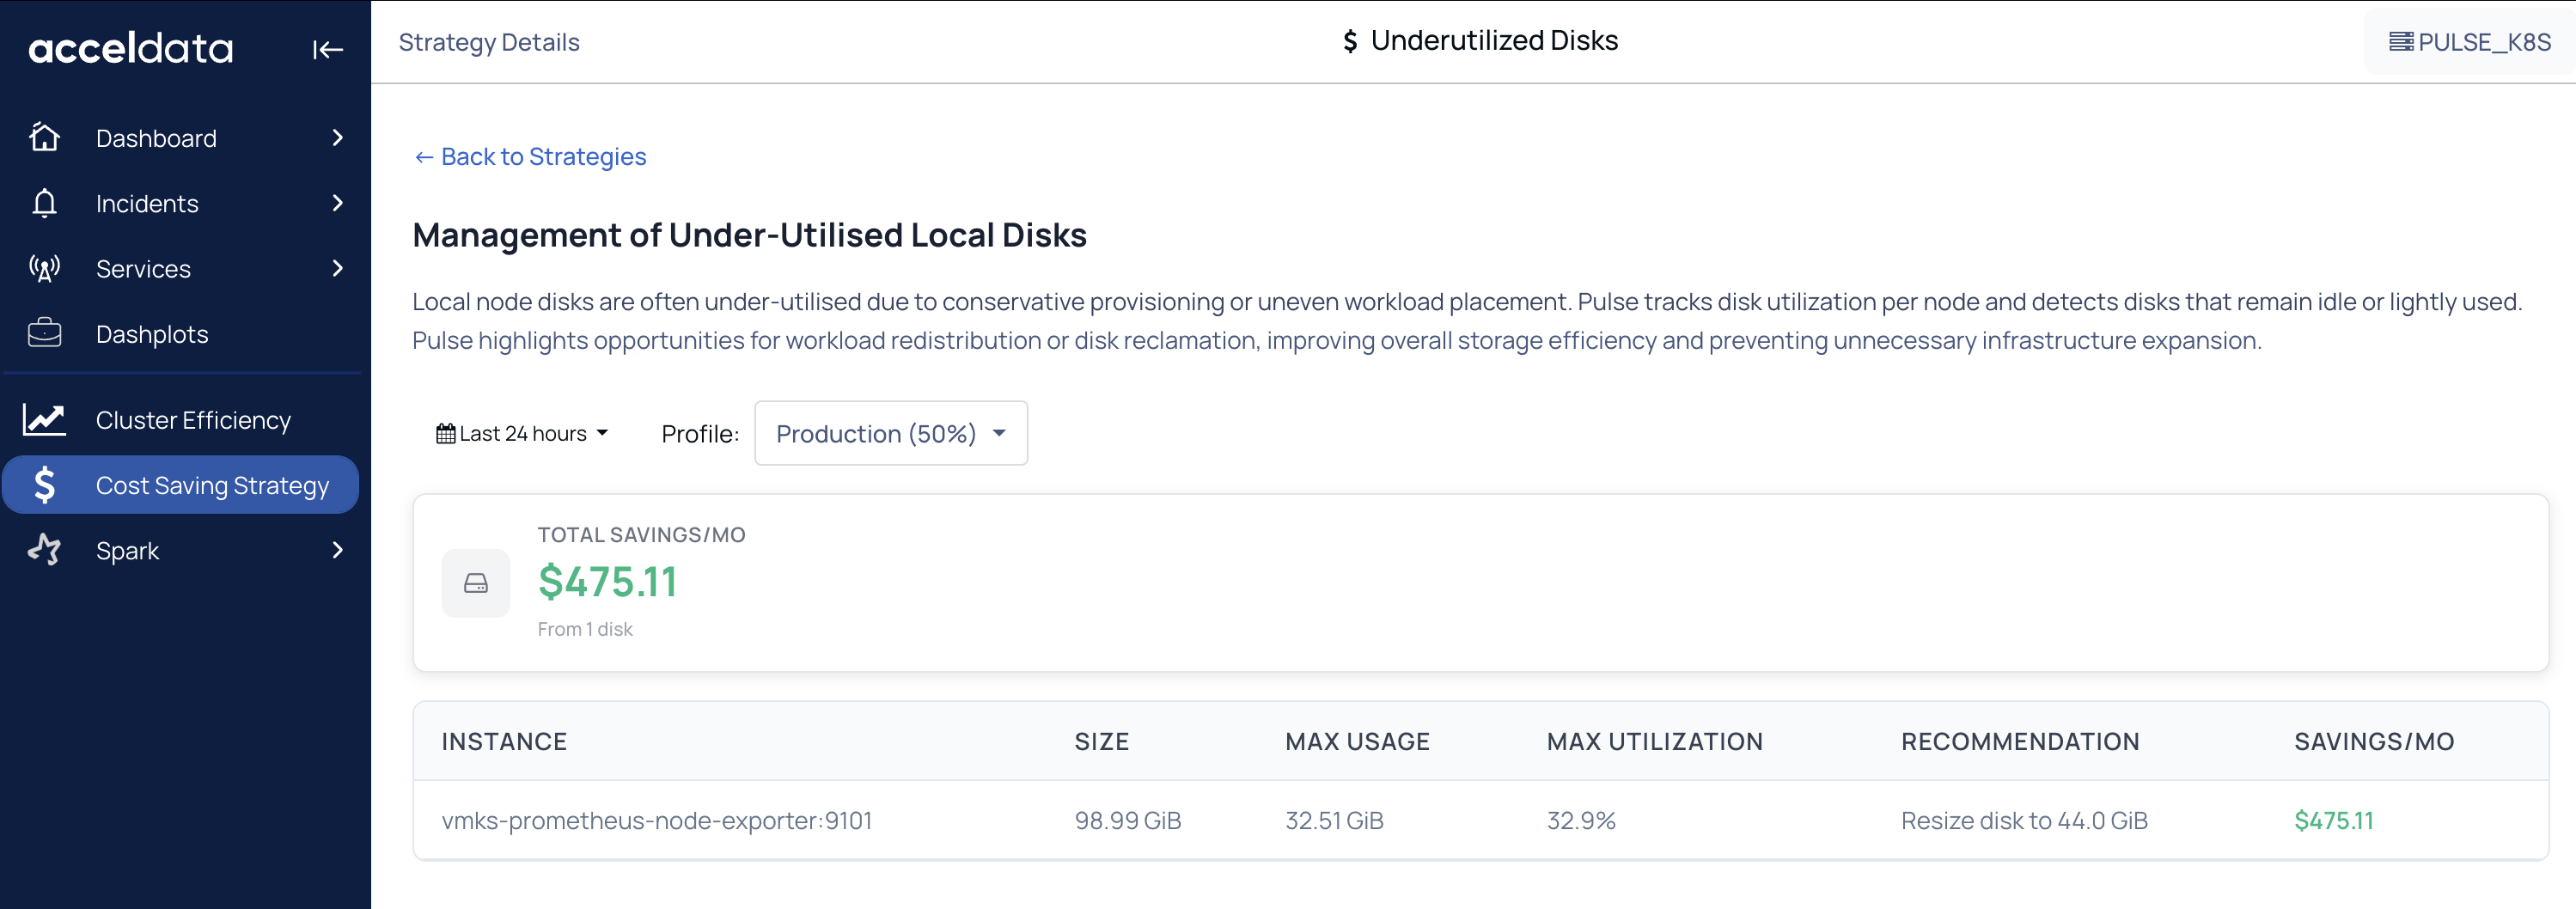
Management of Under-utilized Local Disks
Highlight nodes where local disk capacity is over-provisioned compared to actual usage.
What you get:
- Current disk size, usage, utilization %
- A recommended smaller size (where applicable)
- Estimated savings/month
Persistent Volume (PV) Right-sizing (advisory)
Detect PVs that are consistently underutilized or over-provisioned and recommend resizing.
Goal:
- Reduce storage cost while maintaining application reliability.