Spark on OpenShift: Pulse Observability provides deep insights into Spark workloads running on Kubernetes clusters.
It monitors key performance metrics, logs, and cluster-level events to help ensure stable, efficient, and observable Spark jobs.
This integration allows teams to troubleshoot issues quickly, optimize resource usage, and maintain high reliability in cloud-native environments.
Key Benefits
Key advantages of Spark on OpenShift-Pulse Observability:
Enables real-time monitoring of Spark jobs running on OpenShift.
Provides centralized visibility into logs, metrics, and events.
Supports automatic alerting on job failures and performance issues.
Integrates seamlessly with Kubernetes and OpenShift APIs.
Helps in rapid root cause analysis using Pulse Logs.
Scales effortlessly with distributed data workloads.
Improves operational efficiency with a unified observability layer.
Architecture Components and Flow
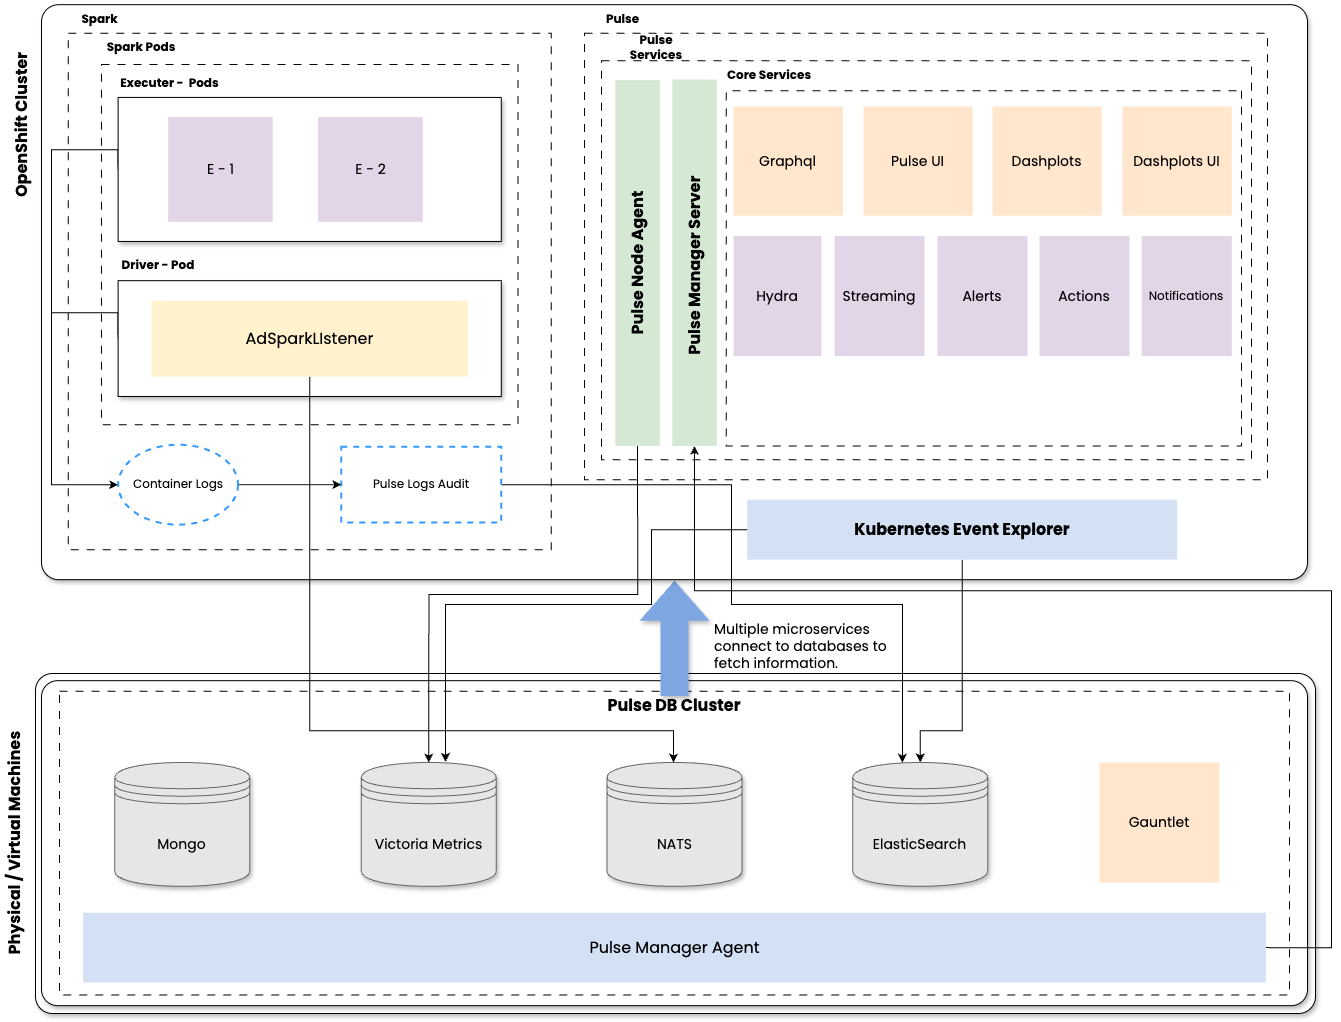
Spark Driver and Executor Pods run inside the OpenShift cluster with an embedded
AdSparkListenercapturing job-level events and metrics.Container logs from Spark pods are collected and forwarded for analysis and audit.
Logs and events are pushed to the Pulse Node Agent for processing and observability.
Metrics and logs are routed to storage systems like Victoria Metrics, forming the time-series data backend.
PulseNode Agent collects Spark Graphite metrics and forward to Victoria Metrics for processing and analysis.
The Pulse Manager Server and Pulse Operator together manage the deployment and lifecycle of all Pulse services within the Kubernetes environment.
Pulse Logs Audit feeds data into the Pulse Manager for further correlation and visualization.
Pulse Core Services, such as Dashplots, UI, Alerts, and Streaming, fetch data from backend databases to power dashboards and notifications.
Pulse Manager Agent manages database configuration, deployment, and orchestration. It ensures consistent communication across distributed databases—MongoDB, VictoriaMetrics, NATS, and ElasticSearch—enabling end-to-end observability.