What is Dashboard?
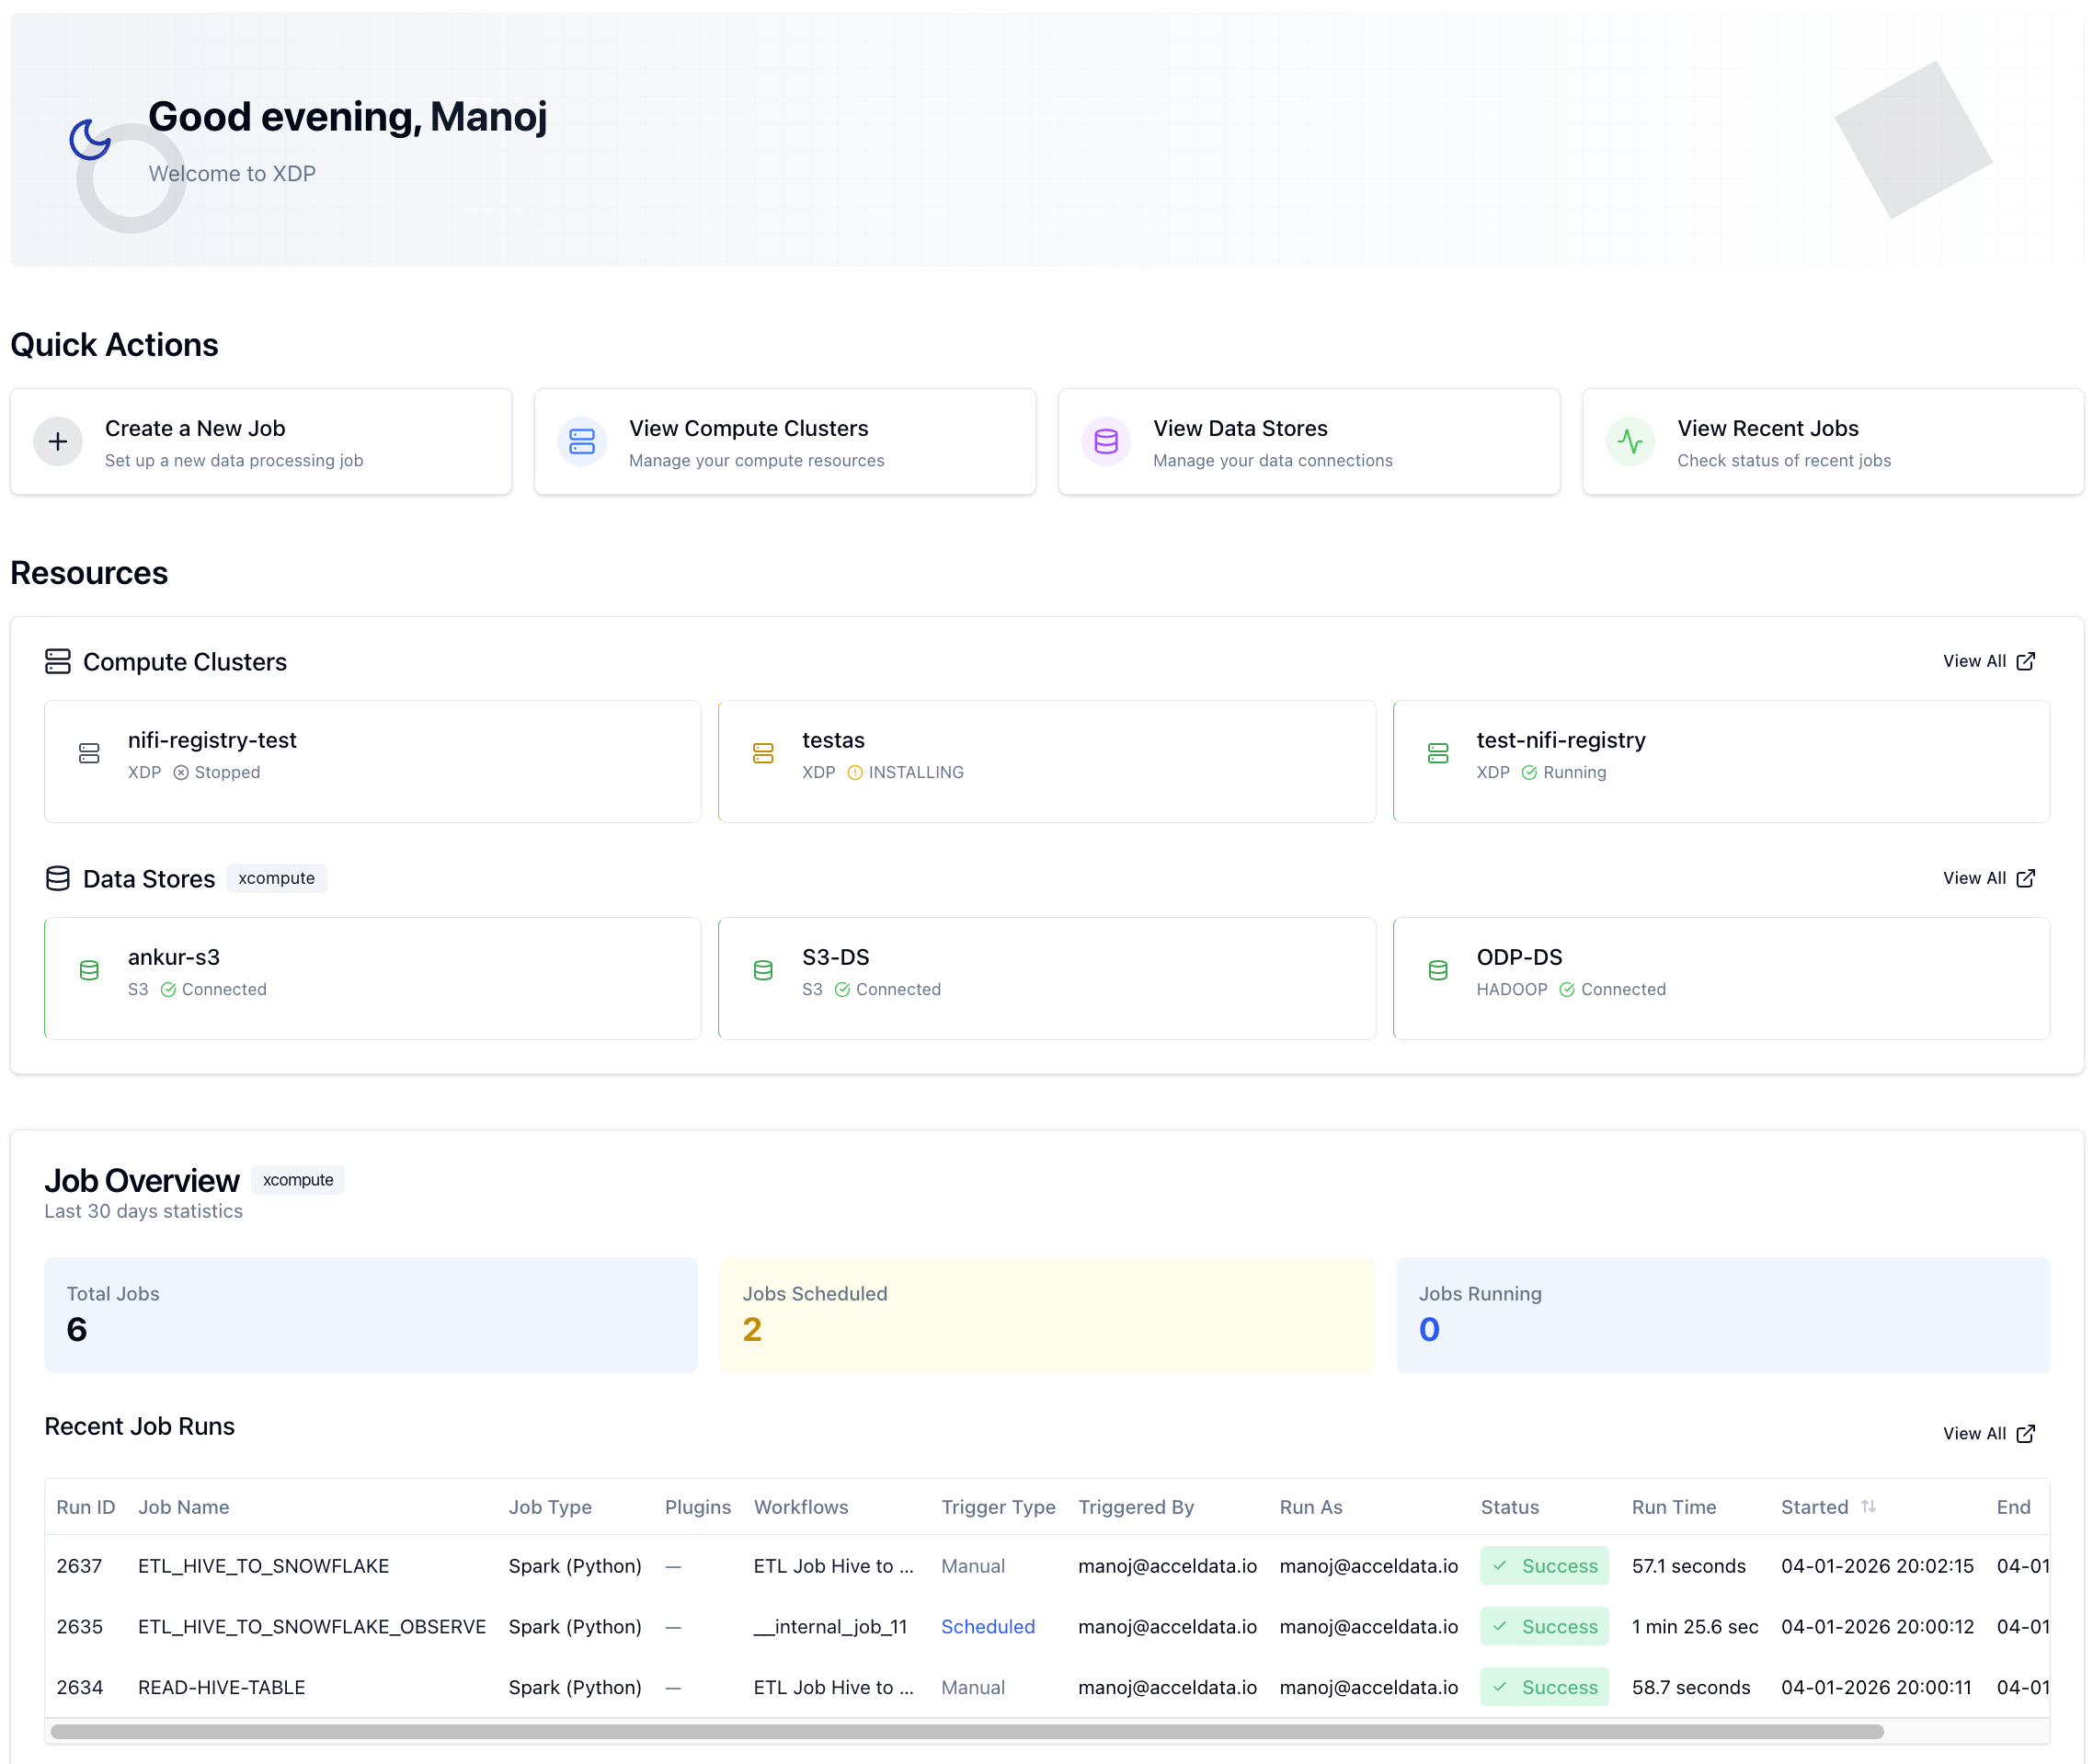
xDP Dashboard is your central command center for data platform operations. It provides a consolidated, at-a-glance view of your compute resources, data connections, and job execution status. The Dashboard helps you monitor platform health, quickly access key management workflows, and understand recent data processing activity, enabling proactive governance and faster issue resolution.
Key Concepts
Compute Cluster: The underlying execution engine (e.g., Spark on Kubernetes) that runs your data processing jobs. The Dashboard shows the operational status of your active clusters.
Data Store: A registered connection to an external data source or sink, such as a Hadoop Distributed File System (HDFS), cloud object store (Amazon S3), or a relational database. A
Connectedstatus indicates that xDP can successfully communicate with the data system.Job: A defined data processing task, such as a Spark application or a data pipeline. The Dashboard provides an overview of the total number of jobs defined within a selected context.
Job Run: A specific execution instance of a Job. The Dashboard lists the most recent job runs, showing their status (e.g.,
Success,Failed) and key performance metrics like duration.Workspace Context: The selector at the top of the page (e.g.,
api-automation-test) allows you to filter the Dashboard view to a specific project, team, or environment. This provides a logical grouping for all associated resources and jobs, supporting multi-tenancy and organized data governance.
Capabilities
Platform Health Monitoring: Instantly assess the status of your compute clusters and data store connections to ensure your data infrastructure is operational. This supports data reliability by highlighting potential connectivity or resource issues.
Operational Intelligence: Analyze job statistics over the last 30 days—including total, scheduled, and running jobs—to understand workload trends and capacity utilization.
Activity Auditing: Review a real-time feed of recent job runs to track data processing activity, verify successful completions, and quickly identify failures for troubleshooting.
Workflow Acceleration: Use the Quick Actions to navigate directly to the most common tasks, such as creating a new job, managing clusters, or configuring data stores, reducing administrative overhead.
Tutorial (Getting Started)
Prerequisites
You have an active user account in xDP with permissions to view clusters, data stores, and jobs.
At least one Compute Cluster has been configured.
At least one Data store has been registered.
At least one Spark job is executed.
Your First Workflow: Daily Platform Health Check
Select Your Workspace Context From the top navigation bar, use the dropdown menu to select the project or workspace you want to inspect (e.g.,
api-automation-test). This ensures all the information on the dashboard is relevant to your team or environment.Review Core Resources In the Resources section, check the status of your key assets:
Compute Clusters: Confirm your primary cluster shows a green
Runningstatus.Data Stores: Verify that your essential data connections show a green
Connectedstatus.
Analyze Job Overview Look at the Job Overview card to understand recent workload patterns. Note the Total Jobs count and check if the Jobs Running count aligns with your expectations for the current time.
Inspect Recent Job Runs Examine the Recent Job Runs table to verify the outcome of the latest data pipelines.
Check the Status column for any
Failedruns that may require investigation.Review the Run Time column to spot any jobs that are taking longer than usual, which could indicate a performance issue.
Example: You notice a nightly ETL job that usually takes 10 minutes ran for 45 minutes. This prompts you to click its Run ID to investigate the performance metrics and logs for potential bottlenecks.
Take a Quick Action From the Quick Actions section, click View Recent Jobs. This navigates you directly to the full list of jobs, where you can perform more detailed filtering and analysis.
Best Practices
Daily Stand-up Review: Start your team's daily stand-up by reviewing the Dashboard. It provides a common operational picture to quickly identify and assign any issues from the past 24 hours.
Establish Naming Conventions: Use clear and consistent names for jobs, clusters, and data stores (e.g.,
proj-landing-raw-s3,spark-etl-prod-cluster). This makes the Dashboard summaries immediately understandable without needing to click through for details.Use Workspace Contexts: Leverage workspace contexts to isolate development, staging, and production environments. This prevents clutter and allows teams to focus only on the resources relevant to them.