Operations
There are vast amounts of data flowing through complex pipelines and systems in every data environment. To ensure that data is operating efficiently and accurately, data observability provides alerts and monitoring capabilities to safeguard the integrity, reliability, and performance of your data operations. They provide the following:
- Real-time Issue Detection: Alerts and monitoring systems are your early warning system, capable of detecting anomalies, bottlenecks, errors, and performance issues in real-time. This proactive approach allows organizations to swiftly respond to potential problems before they escalate, minimizing downtime and data-related disruptions.
- Data Quality Assurance: These tools continuously assess data quality, flagging any deviations or anomalies that could compromise data integrity. By maintaining high data quality standards, organizations can have confidence in their analytics and decision-making processes.
- Resource Optimization: Managing computational resources efficiently is a key concern in data environments. Alerts and monitoring help organizations keep a close eye on resource utilization, allowing them to right-size compute resources based on actual workload requirements. This optimization not only improves operational efficiency but also helps control costs.
- Costly Data Outage Prevention: Data outages can be financially crippling and harm an organization's reputation. Alerts and monitoring systems are essential for identifying and addressing issues before they lead to data outages. By having a clear view of data pipelines and systems, organizations can proactively prevent disruptions and maintain data availability.
- Trust in Data: Trust is a precious commodity in data environments. Consistent, accurate, and reliable data builds trust within an organization. Alerts and monitoring play a pivotal role in upholding this trust by ensuring data remains consistent, accurate, and available when needed.
The following sections delves into specific operations such as Alerts, Incidents, and Notifications.
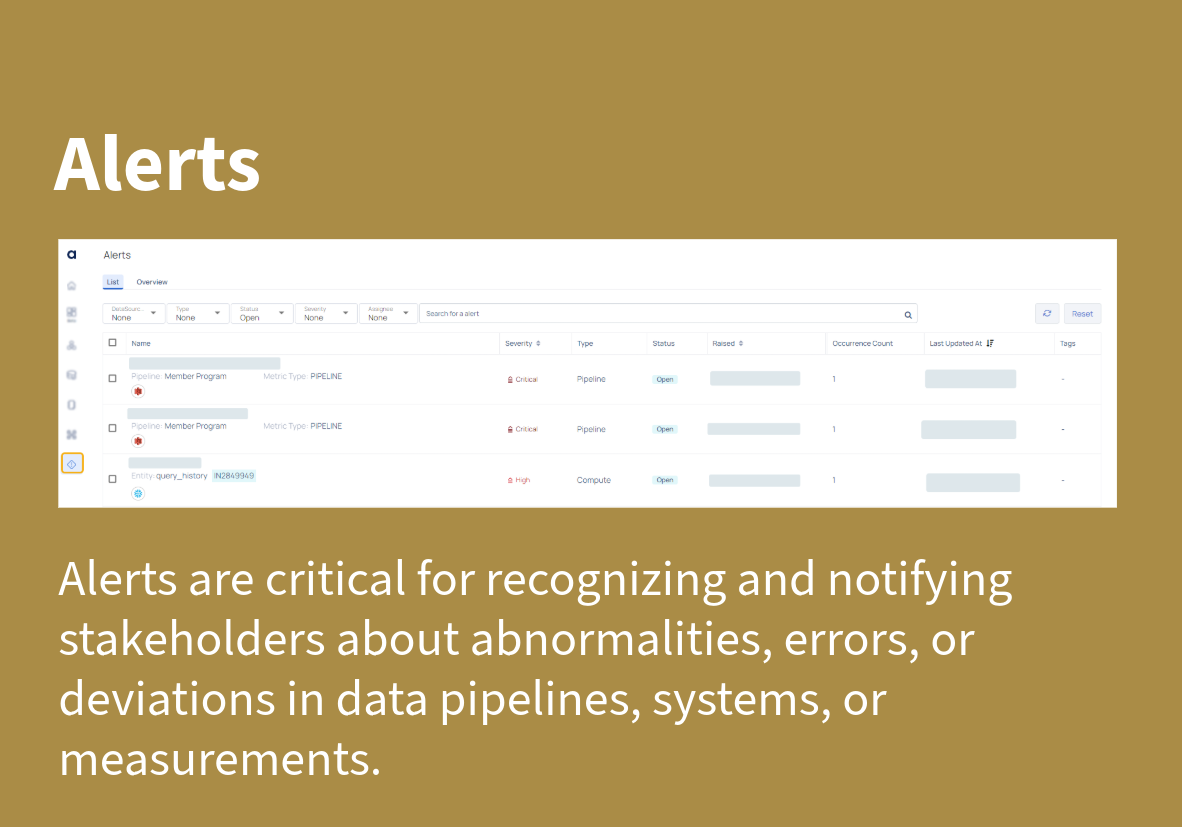
Alerts
In the context of data observability, alerts are crucial for detecting and notifying stakeholders about anomalies, errors, or deviations in data pipelines, systems, or measurements. Alerts are proactive notifications that alert data engineers, data scientists, and other relevant teams to unusual or unexpected data activity.
How Alerts Work
Alerts are triggered in response to predefined criteria or thresholds that indicate deviations from expected patterns. For instance, if a data pipeline experiences a sudden drop in data quality, an alert can be triggered to notify the concerned team for immediate action. This helps uncover and address data issues before they have a substantial impact on downstream processes or business decisions.
Using Alerts Effectively
- Define clear thresholds and rules to capture only critical deviations.
- Set appropriate alert criteria based on the unique requirements of your data systems.
- Ensure alerts are directed to the right individuals or teams for timely action.
Types of Monitors: ADOC supports several types of monitors for generating alerts:
- Compute Monitors
- Pipeline Monitors
- Policy Monitors
Alerts Overview Dashboard
The Alerts Overview Dashboard in ADOC offers a consolidated view of the alert status across different data sources and systems. By clicking on the Overview tab, users can view graphical representations of:
- Alerts raised over time by severity: Displays the distribution of critical, high, medium, and low alerts over a specific time frame.
- Alerts raised over time by status: Tracks the status of alerts, such as Open, Dismissed, Resolved, or In-progress.
- Alerts raised over time by data source: Shows the origin of alerts, categorized by different data sources, helping users pinpoint specific sources contributing to data anomalies or issues.
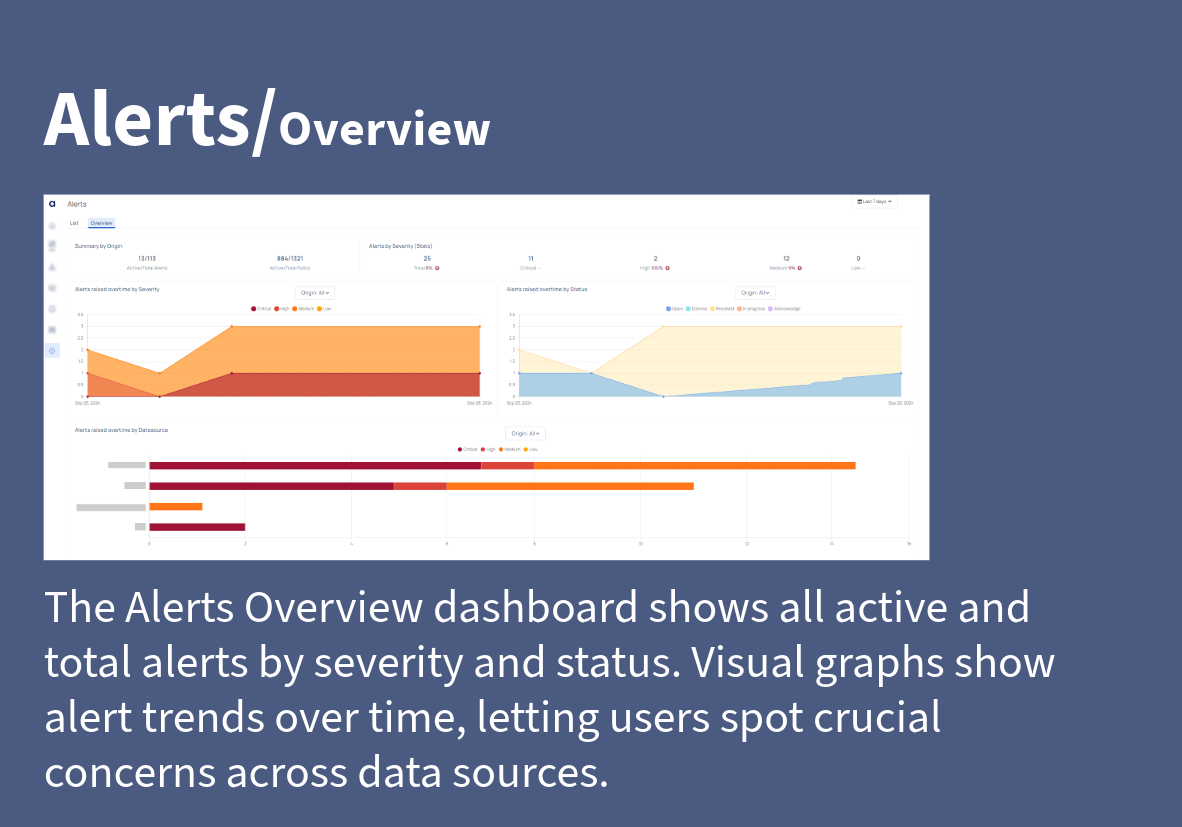
This dashboard allows users to monitor trends, assess the impact of alerts, and take timely action to resolve any ongoing issues. It provides a quick snapshot of the overall health of data operations and highlights areas that need attention.
Incidents
Incidents are events or occurrences that indicate actual faults, abnormalities, or failures in data pipelines, systems, or processes. They provide a complete overview of the challenges that must be addressed to ensure system stability and data reliability. Incidents differ from alerts in that they indicate specific failures rather than messages based on established circumstances.
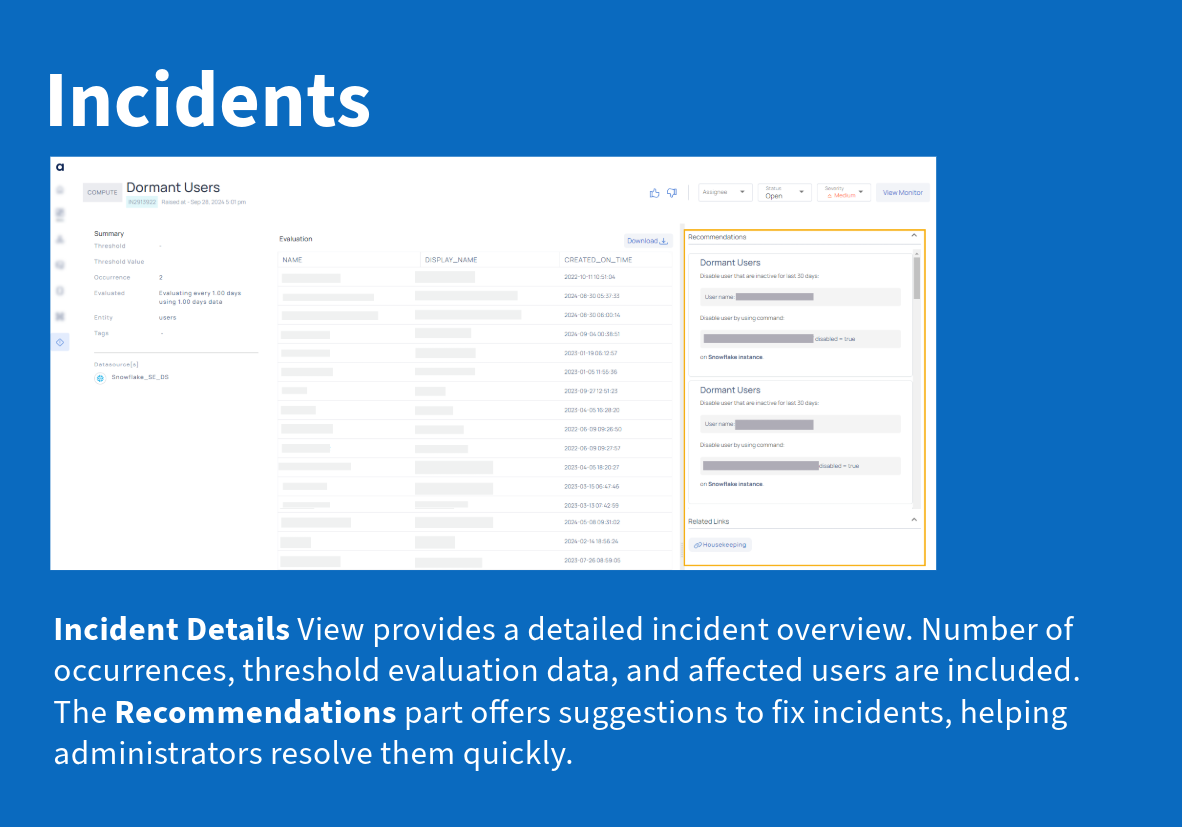
Incident Details Overview
The Incident Details View provides an in-depth summary of a specific incident, including information like:
- Number of Occurrences: Displays the total number of times the incident has been triggered.
- Threshold Evaluation Data: Shows the threshold values set for the monitored entity, helping identify why the incident was triggered.
- Affected Entities: Lists the impacted users, assets, or data sources, along with relevant metadata (e.g., creation time, user status).
This view allows users to understand the root cause of the incident, assess its impact, and take corrective measures accordingly. For example, if multiple dormant users are identified within a data source such as a Snowflake instance, the Incident Details View will show a list of these users, making it easy for administrators to review and take action.
Recommendations
The Recommendations section, located to the right of the Incident Details View, offers actionable suggestions to resolve the incident quickly. These recommendations are tailored based on the specific incident type. For example, if the incident involves dormant users, the recommendations will provide commands to disable those users, maintaining the security and efficiency of the data environment.
Steps to Access Incident Details
To access the incident Details View:
- Navigate to the Alerts section
- Select the desired incident from the list of incidents shown in the list
- Click on the incident name to open the detailed view.
The Incident Details View will then display all relevant information, helping you analyze and act on the incident promptly. For detailed information, see Incident Management.
When to Use Incidents
An incident might occur when a critical data pipeline fails to complete successfully due to a configuration error or a system outage. For example, if a data pipeline that processes sales transactions fails to execute, it could result in delayed reporting and affect business decisions. The incident logs the failure, providing detailed information for root-cause analysis and resolution.
Alerts are used to notify users of anomalies or thresholds being crossed, such as when a data metric like latency exceeds the defined limits. In contrast, Incidents are logged and tracked when actual issues or failures occur within the system, such as when a system component fails or a data pipeline is interrupted.
Notifications
The Notifications in ADOC allows you to encompass all forms of communications, configure notification groups (channels) for alerts. You can use the notification groups created here in the Notification section of the Alert Configurations for the Assets and Policies.
Setting up Notifications:
Notifications can be configured to include critical alerts and incidents, as well as other less urgent messages, such as system status updates or informational announcements. The notification groups generated here can be utilized within the Notification Channels pertaining to the assets and policies.
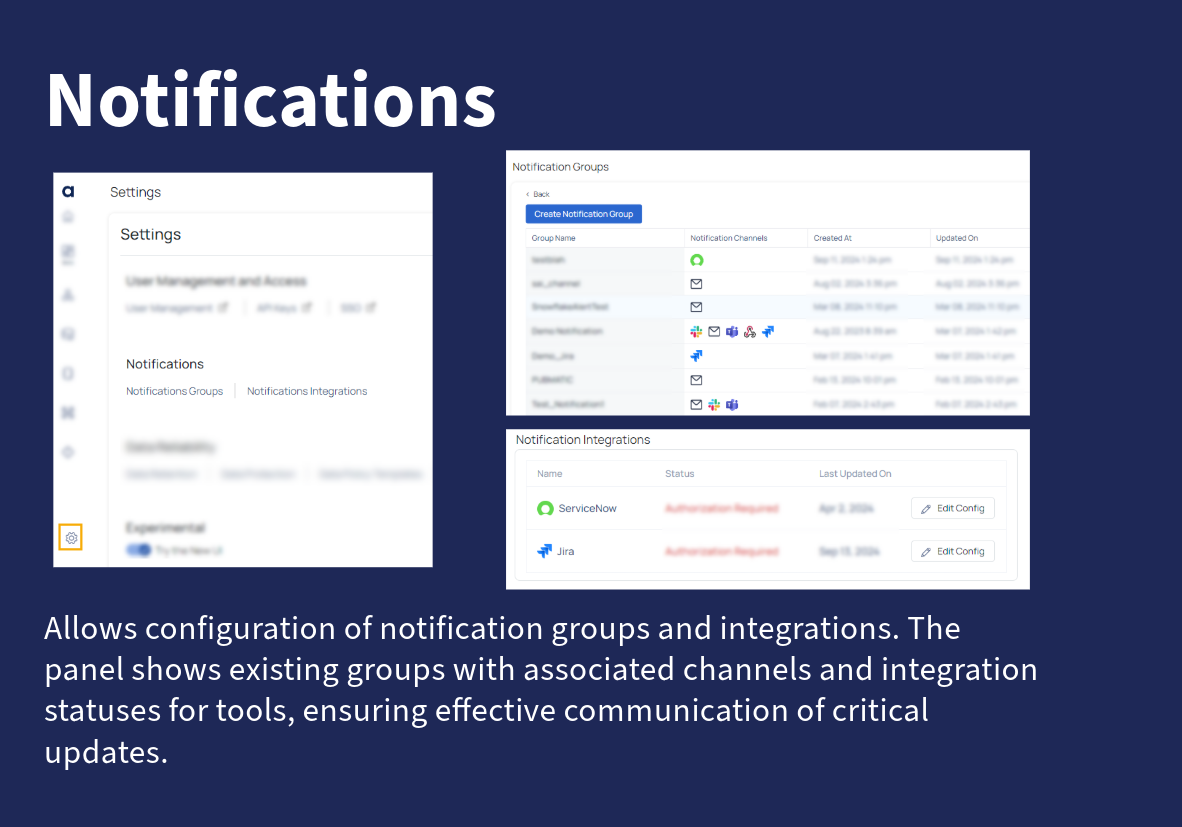
Supported Notification Channels:
- Slack
- Service Now
- Webhook
- Teams
For example, if a critical data pipeline alert is triggered, all recipients belonging to the notification group will receive a notification, ensuring that the right individuals are informed promptly to take corrective action.