About Compute
The Compute section in ADOC provides a comprehensive suite of tools for analyzing and optimizing your data platform's computational resources. This includes detailed monitoring, cost management, and performance tuning capabilities for various data platforms like Databricks, Azure Data Factory and Snowflake.
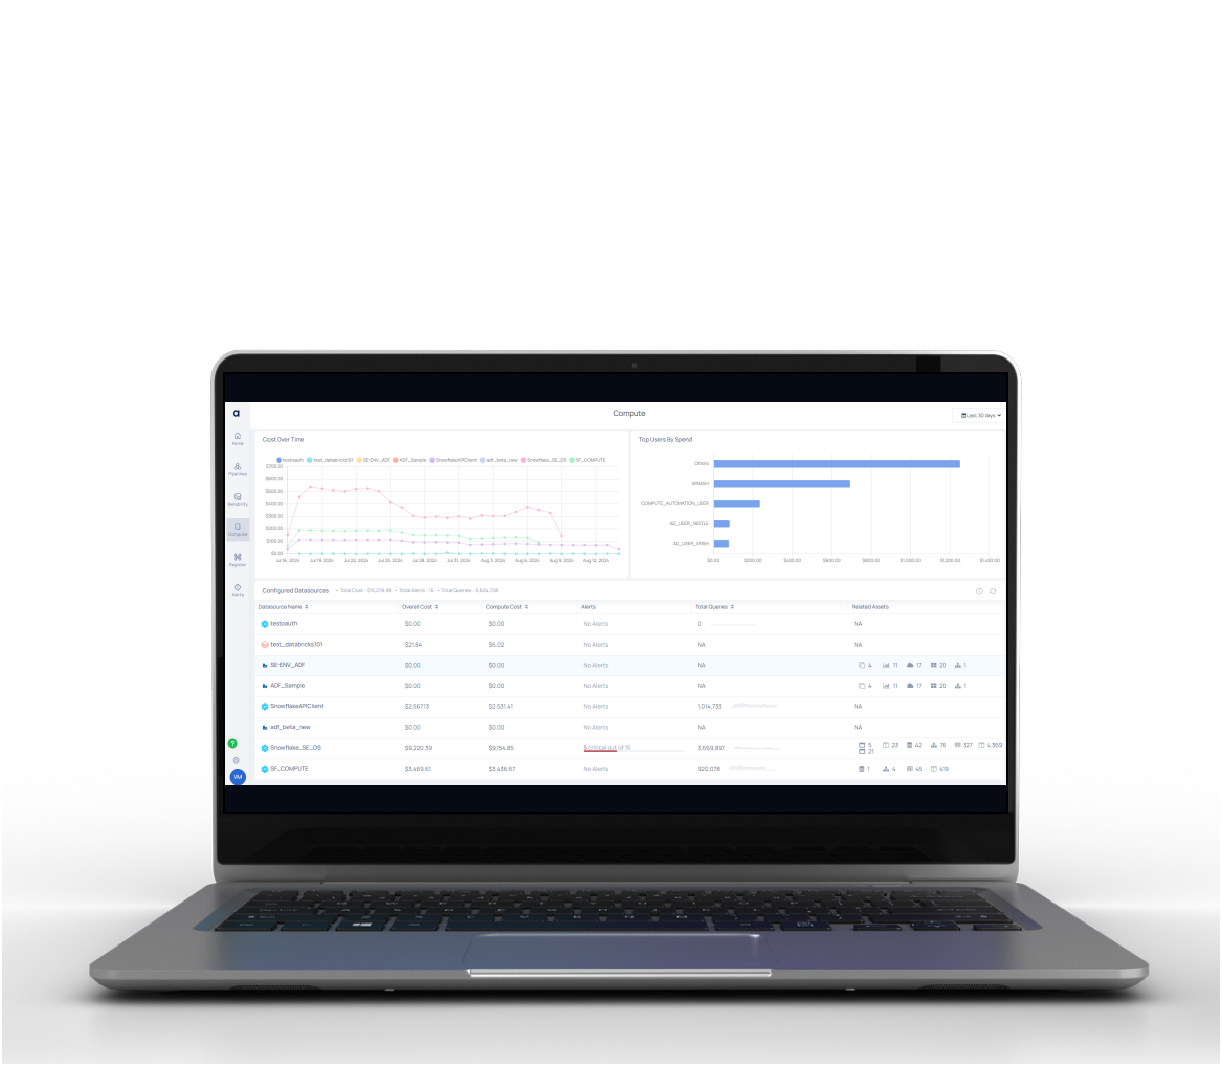
You can access the ADOC Compute dashboard by clicking the compute button. It offers graphical statistics on key metrics such as cost over time and expenditure performance, as well as a complete table of configurable data sources and vital statistics. The ADOC compute dashboard gives you a complete overview of your data sources, allowing you to examine patterns and make smart decisions. It also includes adjustable filters and interactive visualizations for a more in-depth look at your data.
The compute functionality supports you in three essential functions in addition to presenting vital facts on the dashboard:
- Monitors: You can explore all of the monitors, use this function to build a monitor, and import and integrate monitors from the Monitors Store.
- Chargeback and Budget: Using this feature, you may view the cost analysis of newly added organizational units, construct organizational units, and create a budget.
- Recommendations: The function displays all of the recommendations that are currently in use and allows you to filter and search for recommendations.
Pre-requisite
Before using the Compute function, ensure to add the Data Source in the ADOC's Register page. To learn how to add a data warehouse to ADOC, go to the Add Data Source page. After you have added the data source, you can use the compute function to its full extent and observe the data source.
Role Based View
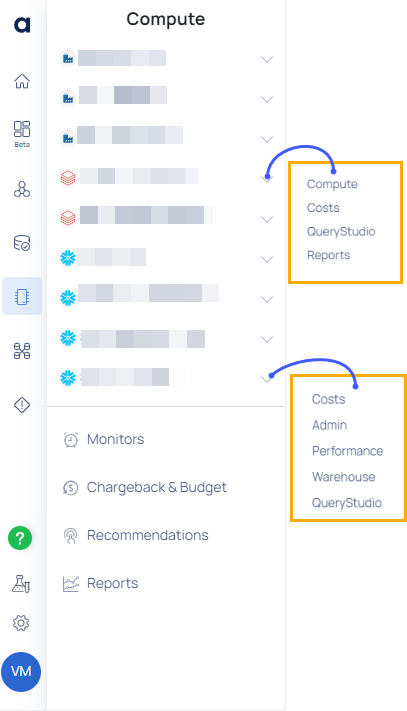
The ADOC provides significant changes to the Compute landing page, enhancing user navigation and providing tailored views for different user personas. This guide will help you understand these changes and effectively use the new features.
The Compute page now offers distinct persona based views:
- Platform Admin View
- Data Engineer View
These views are designed to cater to the specific needs of different user roles within your organization.
Platform Admin View
The Platform Admin View is designed to provide comprehensive insights into cost optimization, operational efficiency, and budget management for platform administrators. This guide will walk you through the various components and features of this view.
- Insights into cost spikes and long-running jobs.
- Detailed cost savings analysis.
- Health metrics for overall system performance.
- Chargeback and budgeting information.
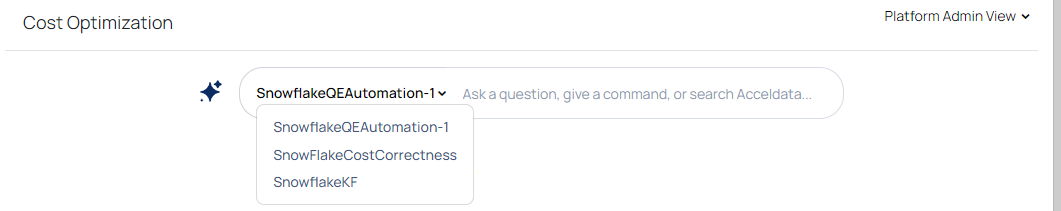
Copilot NLI Interface
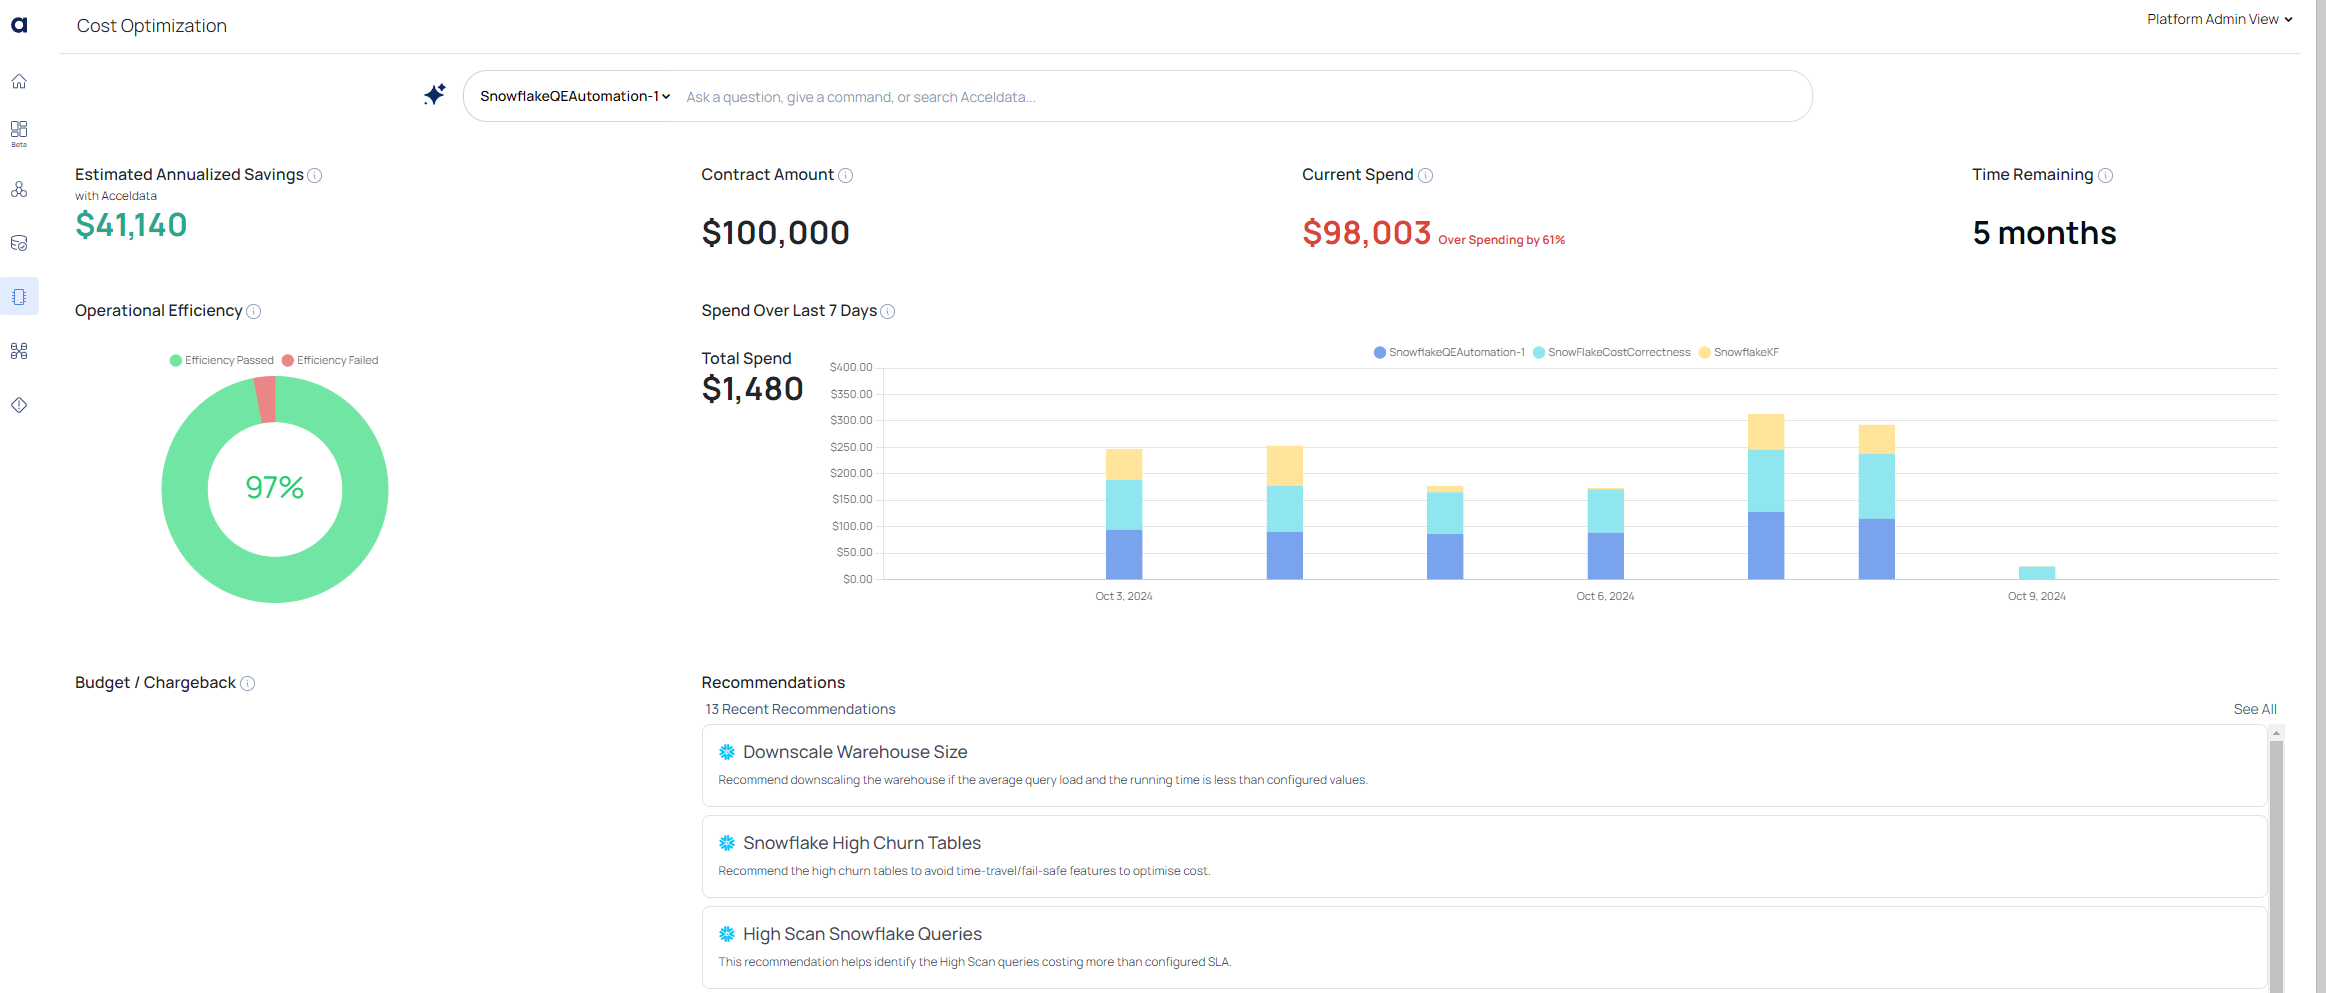
The new Copilot Natural Language Interface (NLI) enhances user interaction with real-time suggestions and smart recommendations. Platform Selector: At the top of the screen, users can select the relevant compute platform. For example, in this screenshot, the SnowflakeQEAautomation-1v platform is selected. This allows users to focus on a particular data source or environment.
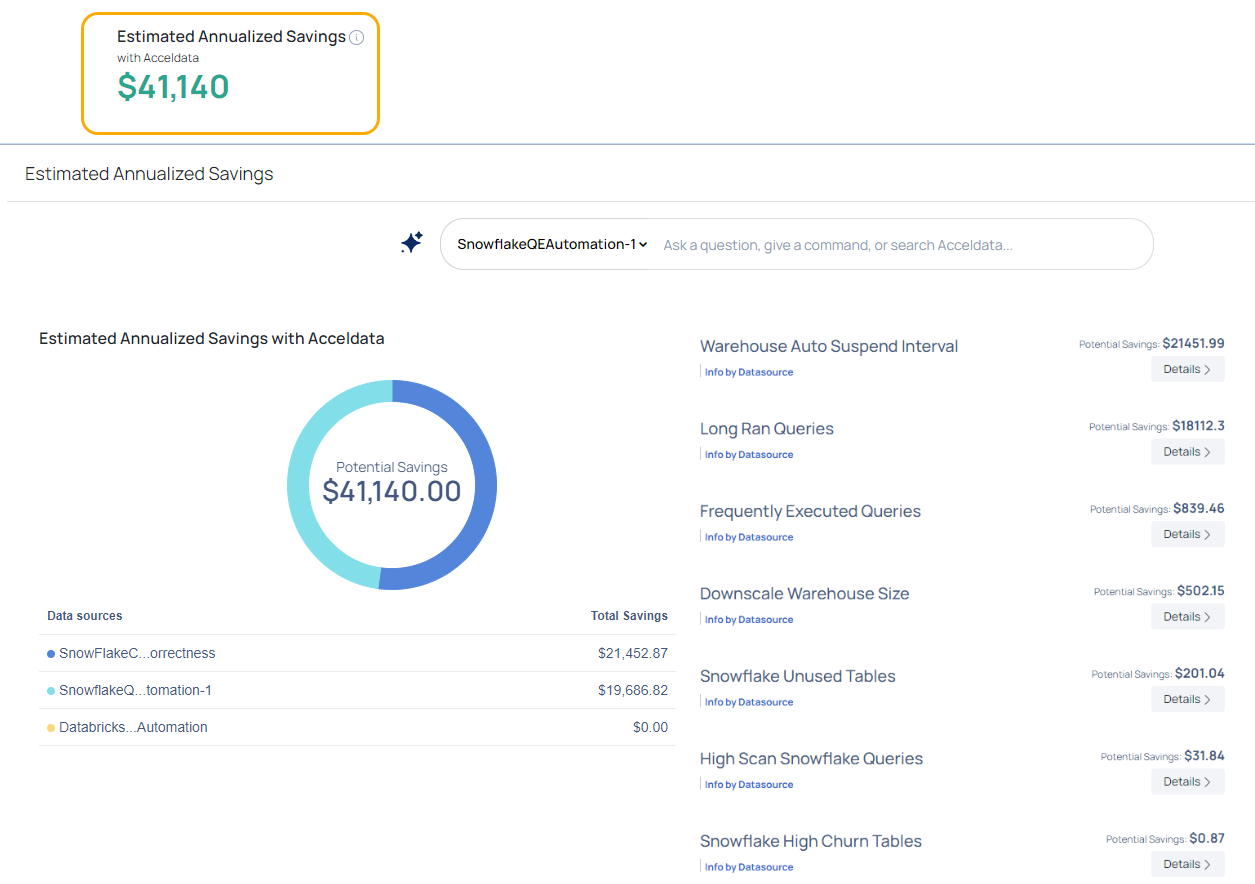
Estimated Annualized Savings
This section shows the potential savings if the user implements the recommendations provided by ADOC. In the screenshot, it displays $41,140, indicating how much can be saved annually through cost optimization. Clicking on the estimated annualized savings opens a new page with detailed information about these saving.
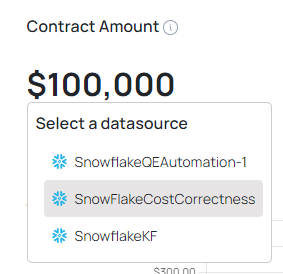
Cost Overview
Contract Amount: Displays the total contractual budget for compute resources. In this case, the contract amount is $100,000. Hover over it to pick any other data sources and view the cost dive down.
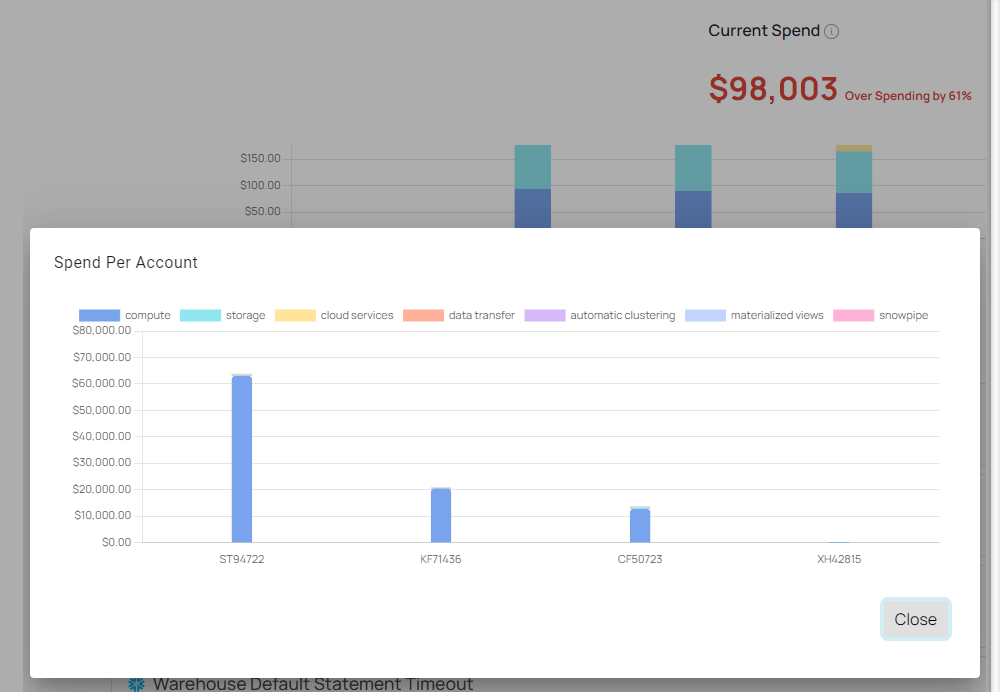
Current Spend: Indicates how much of the contract money has already been spent, which is $98,003, as well as a comment stating that it is overspending by 61%. This allows users to determine whether they are on track or over their budget. Hover over it to see the estimated expenditure.
Time Remaining: Indicates the remaining time on the current compute resource budget or contract. In the screenshot, there are 5 months left, which allows users to plan and manage their resources within the remaining time.

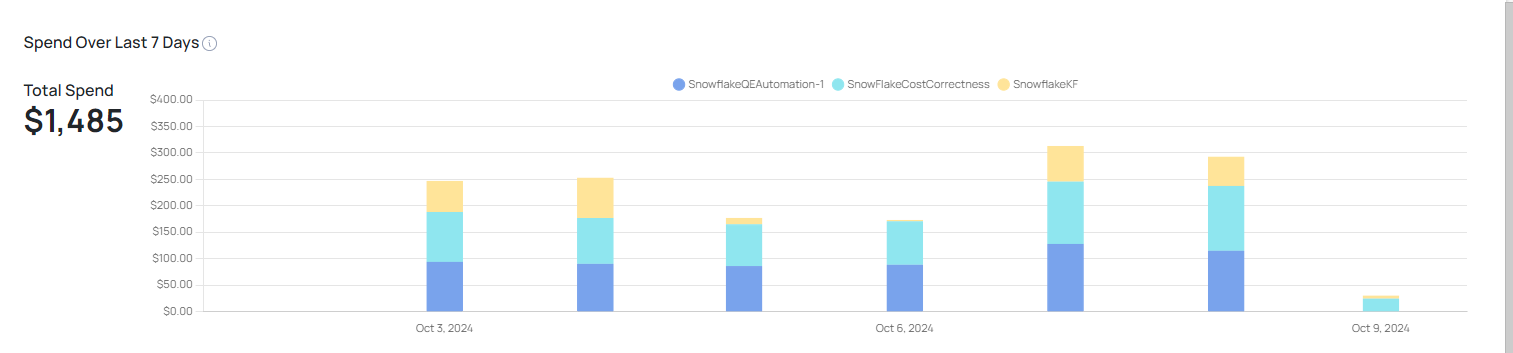
Spend Over Last 7 Days: Displays the total spend in the past 7 days, in this example being $1,480. A bar chart is provided to visualize the daily spending trend over the last 7 days, with color-coded bars representing different categories (e.g., SnowflakeOEAutomation-1, SnowflakeCostCorrectness, SnowflakeKF).
Budget/Chargeback: This section allows users to understand the budgeting and cost recovery options related to their compute usage. Additional information may be configured to allocate costs appropriately across different teams or projects.
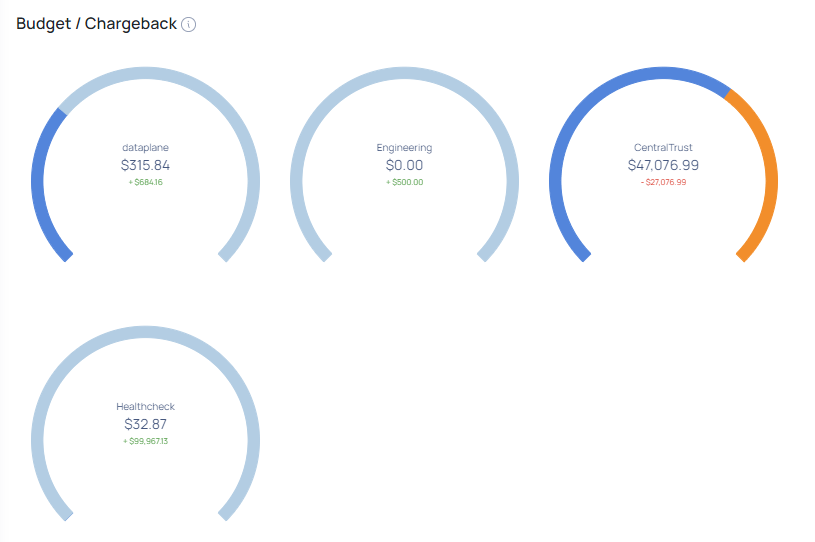
It is critical for organizations to monitor and track the expenditures incurred by various departments or the organization. The chargeback feature in ADOC lets you manage, measure, and assign infrastructure expenses across business units and data platforms. The Chargeback tool also enables you to efficiently allocate funds (based on previous expenditures) to different business units within your corporation.
The following tabs are available on the Chargeback and Budget page:
- Cost Analysis
- Organization Units
- Budgets
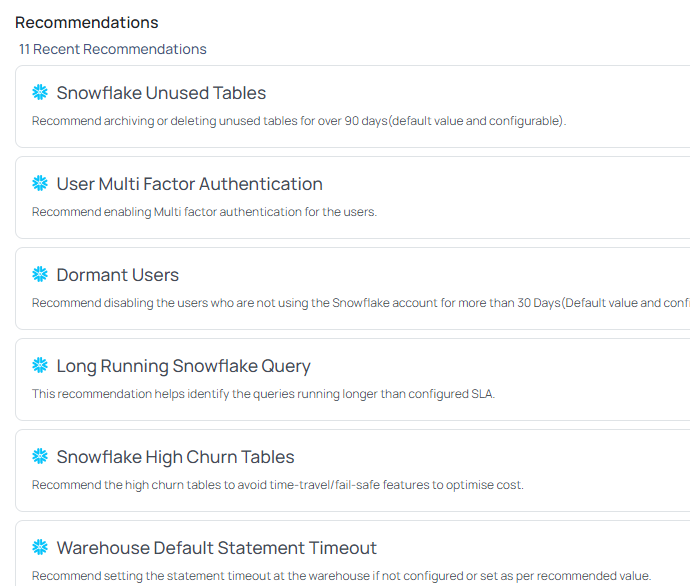
Recommendations
Lists the latest recommendations provided by ADOC to optimize Snowflake and Databricks data sources. These recommendations aim to reduce costs and improve system performance.
The Platform Admin View provides a sophisticated interface for cost management, system health monitoring, and performance optimization. By following this guidance, platform administrators may efficiently navigate the new user interface, access real-time insights, and make data-driven decisions to improve operational efficiency.
Data Engineer View
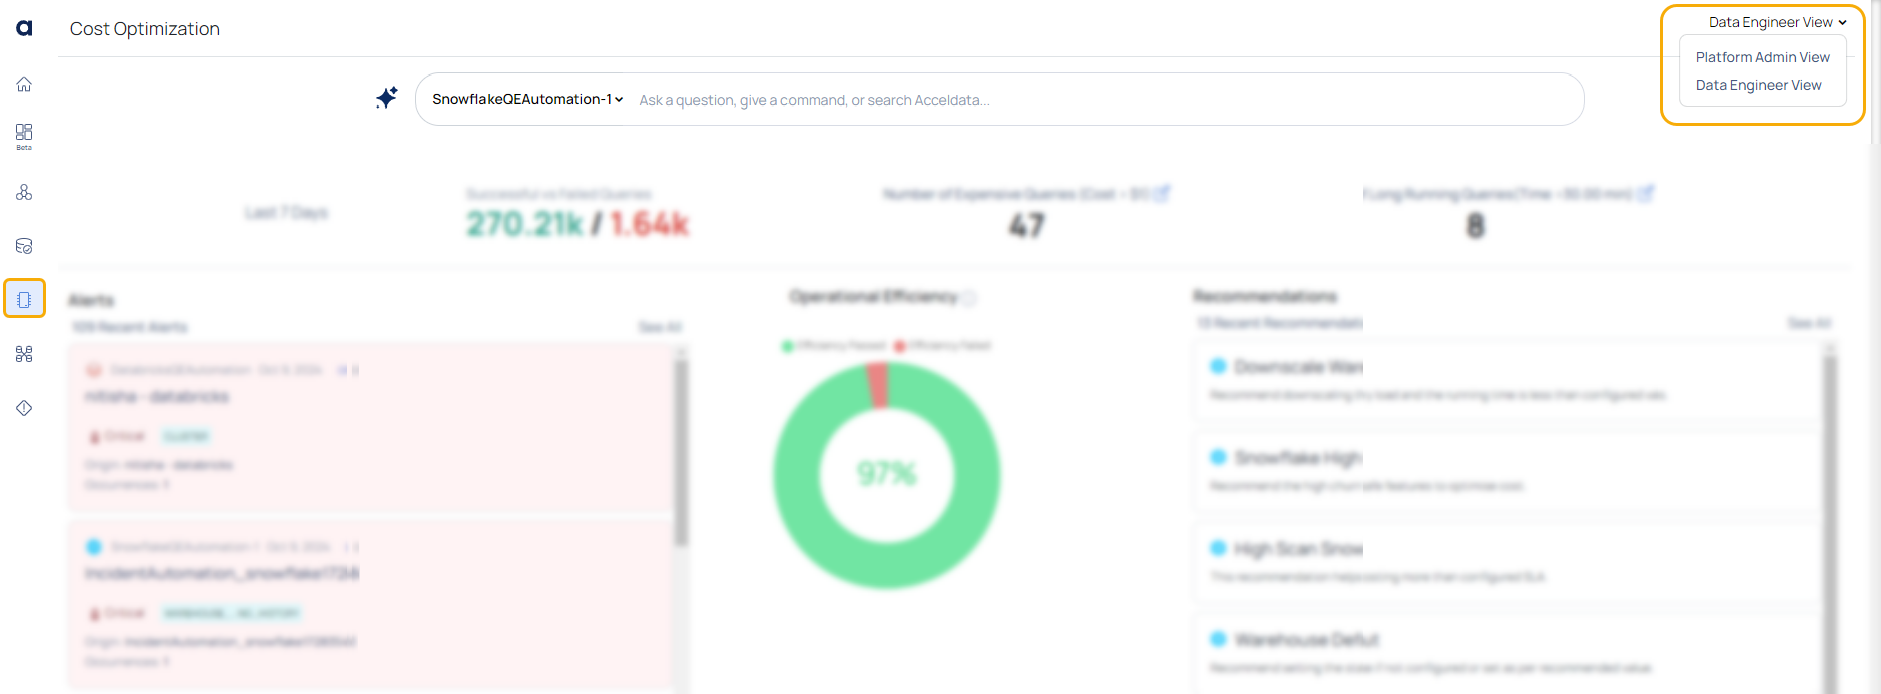
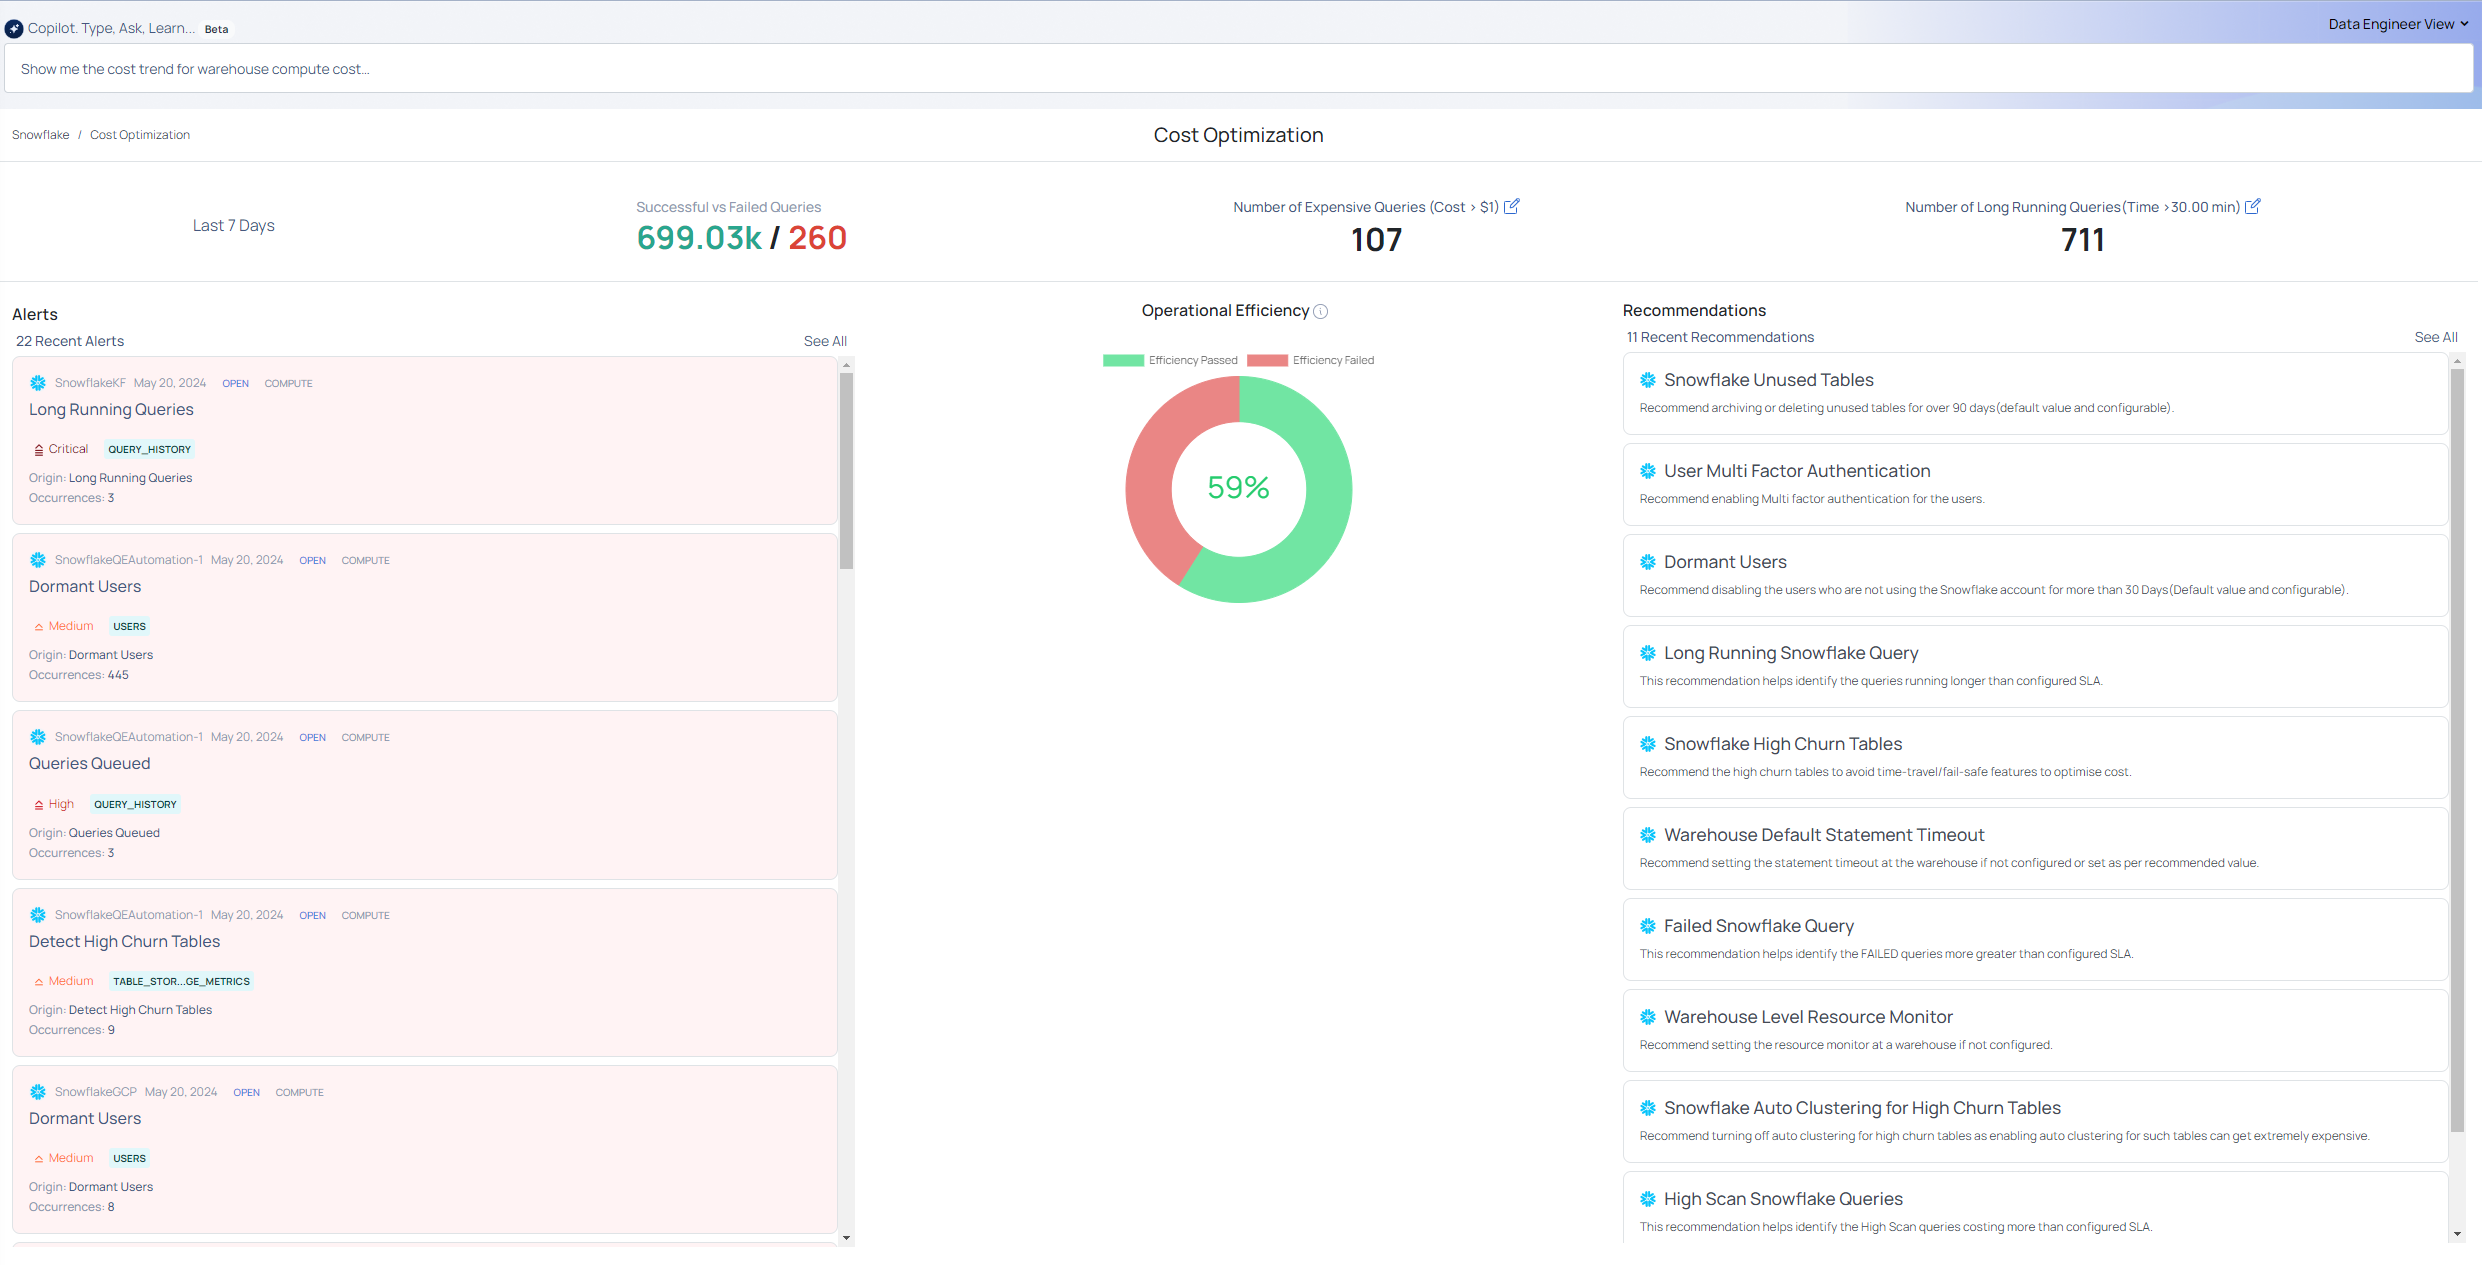
The Data Engineer View is tailored to provide detailed insights into job performance, query optimization, and system efficiency. This guide will help you navigate and utilize the features available in this view.
- Metrics on successful vs. failed queries.
- Identification of expensive and long-running queries.
- Detailed analysis of resource optimization.
- Alerts for critical issues and recommendations for improvements.
| Field | Description |
|---|---|
| Successful vs Failed Queries | Displays the number of successful versus failed queries over the last 7 days. Users can see the number of successful and failed requests. When a user clicks on this, they must select a specific data source. They will then be taken to the Query Studio dashboard, where they can view additional details. |
| Number of Expensive Queries | Shows the count of queries costing more than $1. Users can view the number of expensive requests. This is an editable field where users can enter any value appropriate for their use case. When users click, they are prompted to select a specific data source. They will then be taken to the Query Studio dashboard to view more detailed information. |
| Number of Long Running Queries | Indicates the count of queries running longer than the specified threshold (e.g., 30 minutes). Users can view the number of long-running requests. This is an editable field where users can enter any value appropriate for their use case. When users click, they are prompted to select a specific data source. They will then be taken to the Query Studio dashboard to view more detailed information. |
Operational Efficiency
The Operational Efficiency Score is a quantitative measure of the system's overall state. This score helps identify potential problems and prioritize activities for optimization. Hover over the chart to see the efficiency percentage, then click the doughnut chart to see the operational efficiency across data sources.
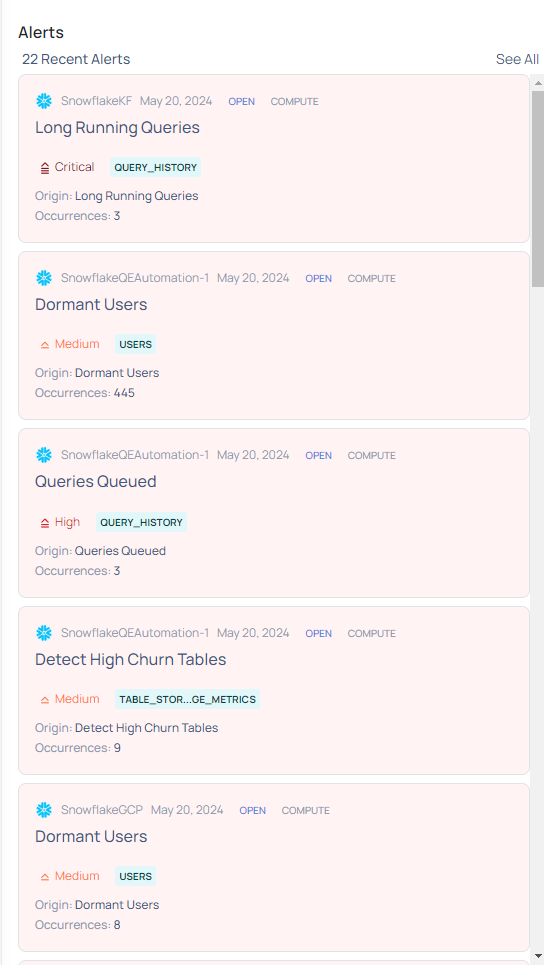
Alerts
Displays the most recent alerts to notify you about critical issues and unexpected data activity. These alerts help you quickly identify and address problems within your data pipelines.
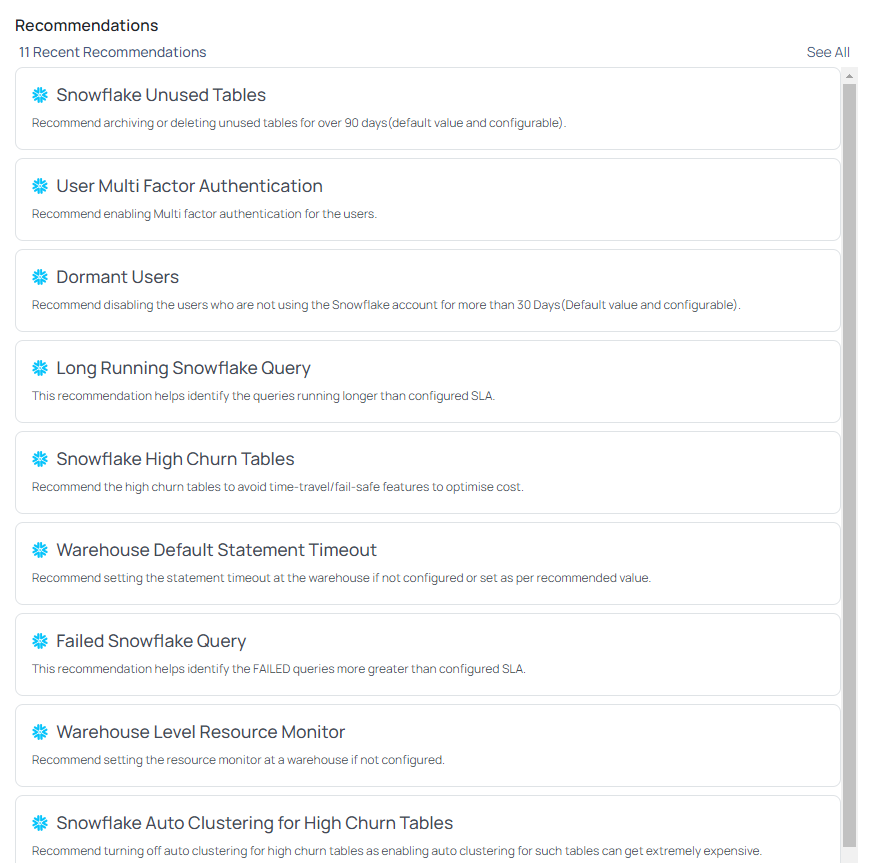
Recommendations
Lists the latest recommendations provided by ADOC to optimize Snowflake and Databricks data sources. These recommendations aim to reduce costs, enhance performance, and improve system efficiency.
The Data Engineer View provides a comprehensive interface for monitoring job performance, optimizing queries, and ensuring system efficiency. In this persona based view, data engineers can effectively navigate the new UI, leverage real-time insights, and make data-driven decisions to enhance operational performance.