Jobs
The Jobs function in ADOC offers real-time monitoring and performance analysis for data processing tasks, tracking job progress, analyzing metrics, and understanding historical trends. It features customizable alerts and cross-platform compatibility, ensuring efficient job management and quick issue resolution.
The following jobs are generated upon the execution of the policy:
- Profile Jobs
- Data Quality Jobs
- Reconciliation Jobs
- Upcoming Jobs
- Policy Import Jobs
- Reference Validation Jobs
- Rule Set Jobs
- Cadence Jobs
Profile Jobs
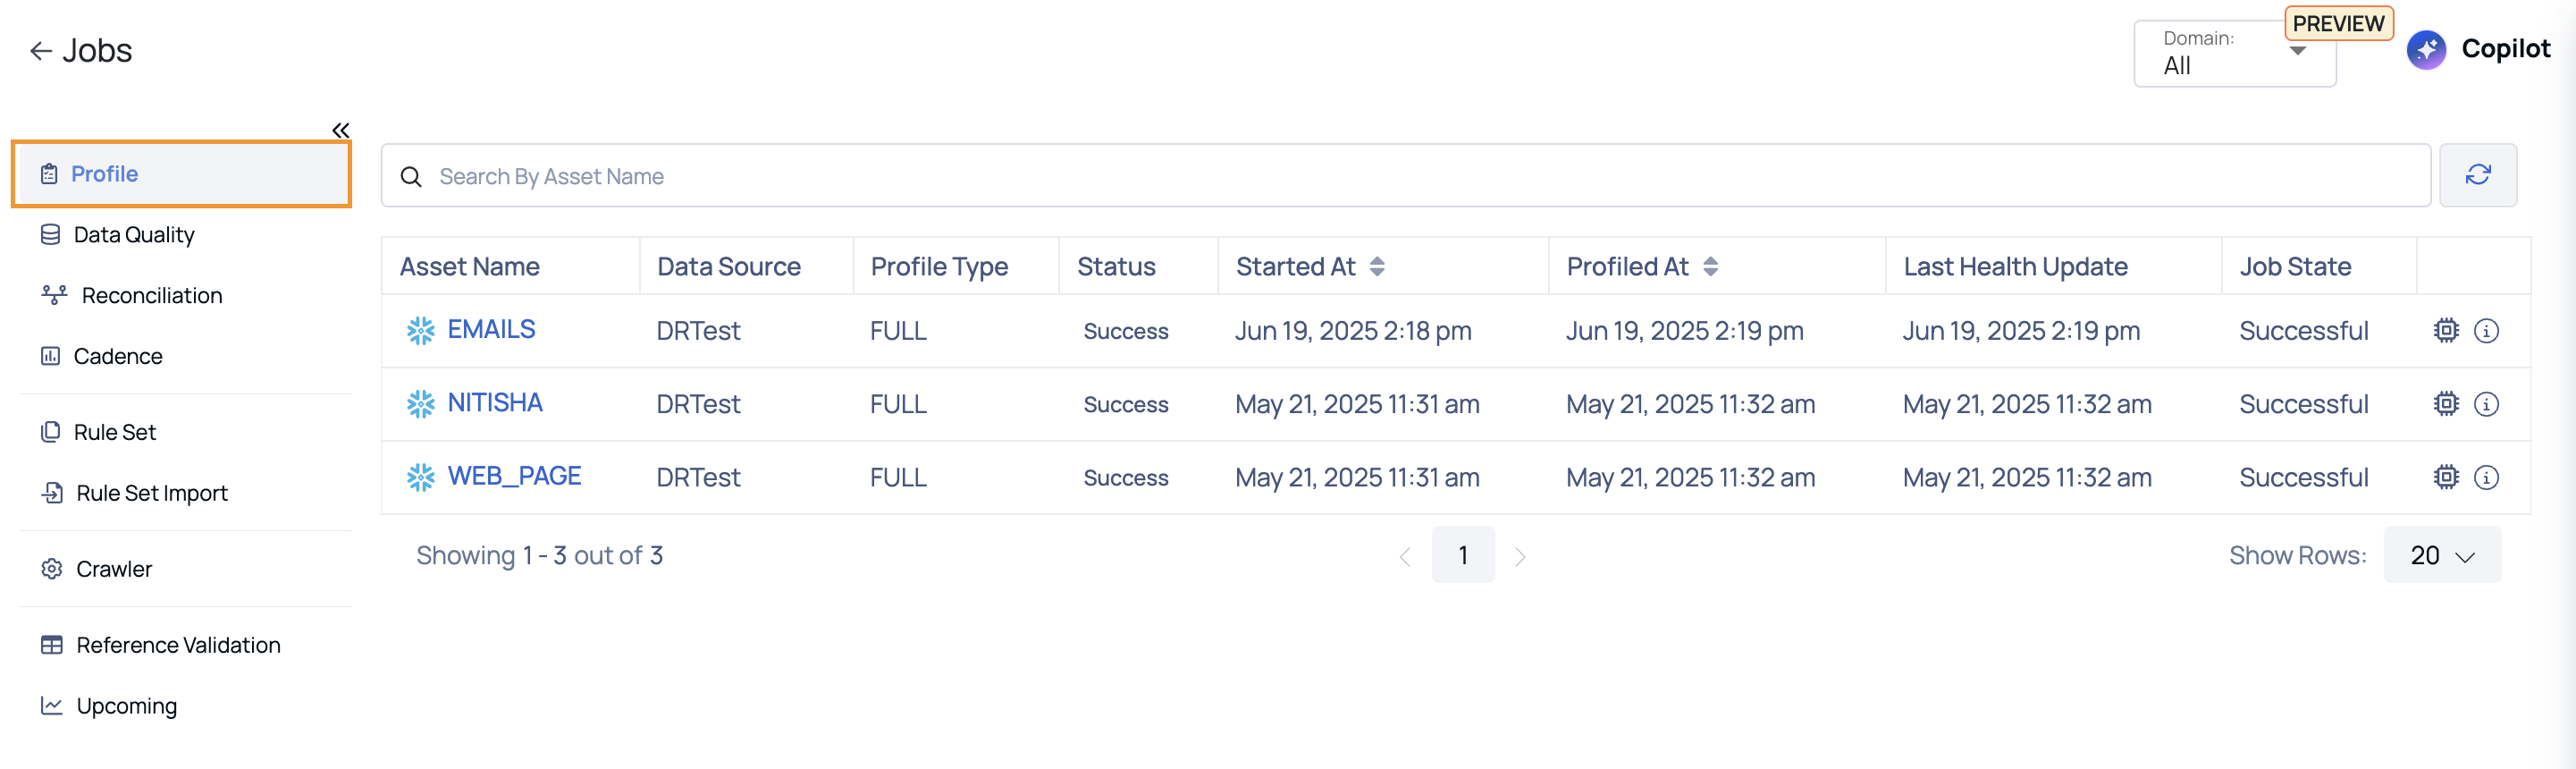
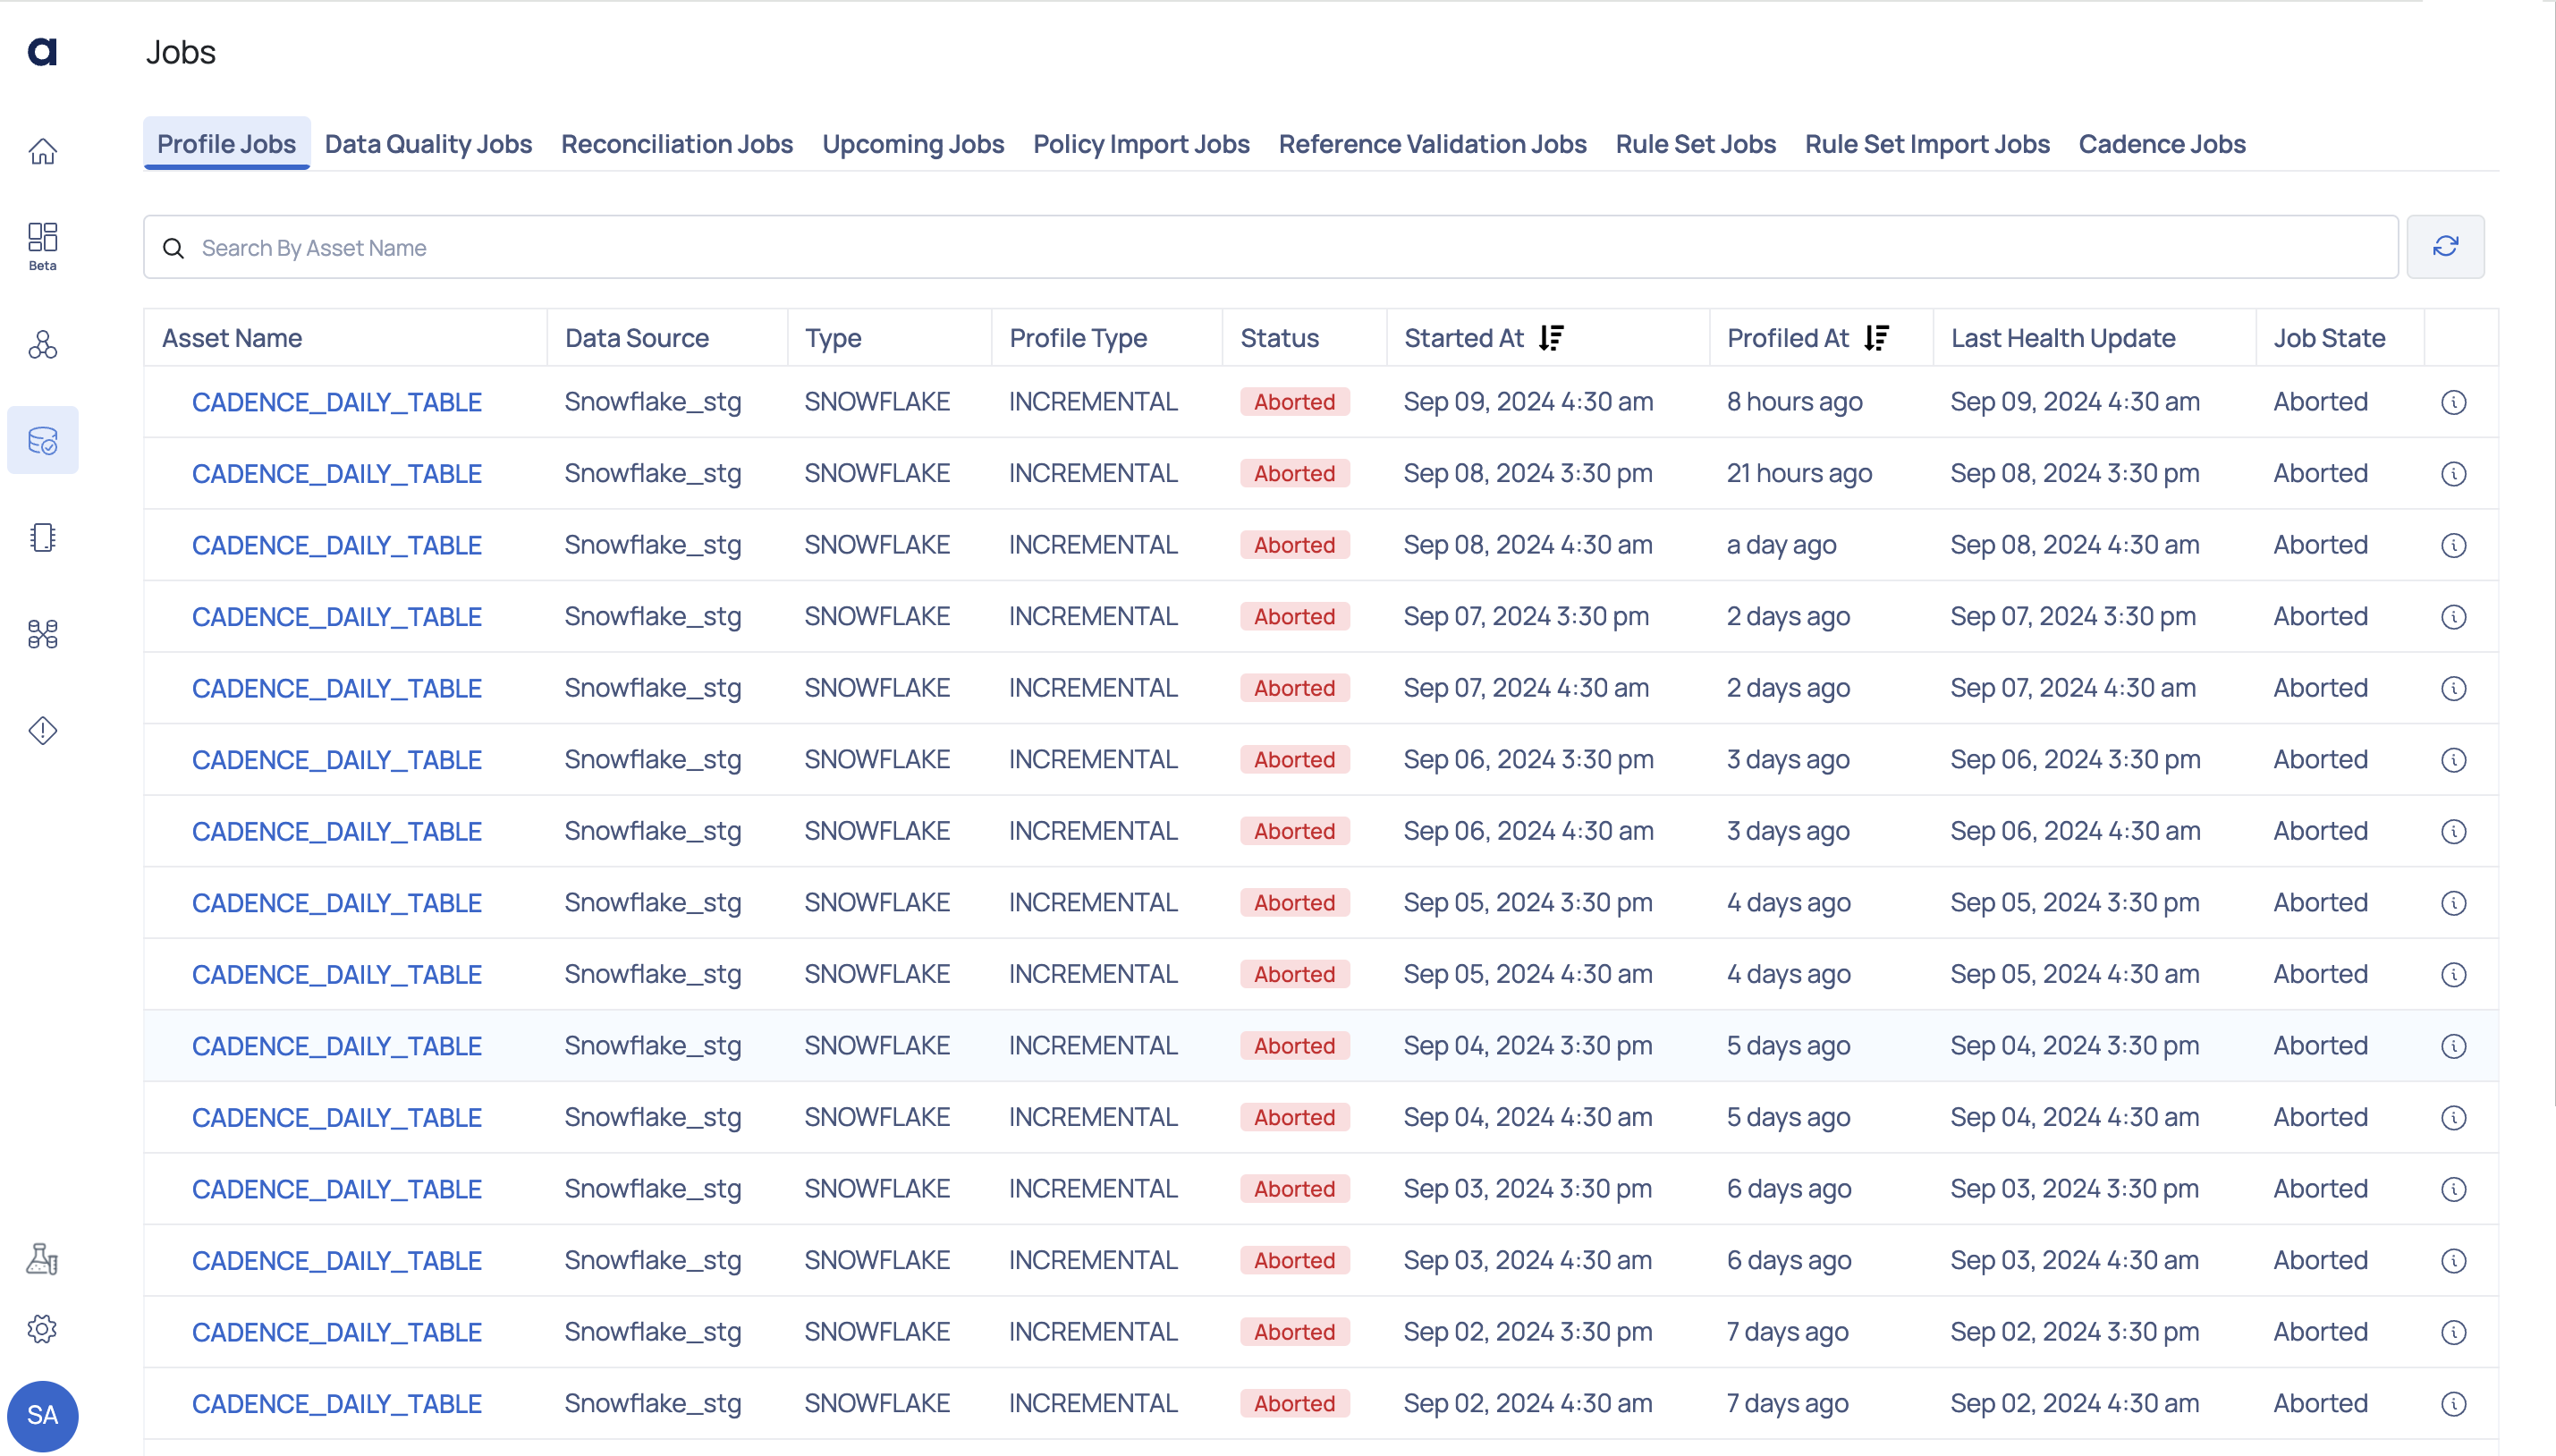
When you execute a policy, a job is created to represent the policy's execution. The job title typically includes the policy title along with additional identifiers for unique distinction. You can check the job status, which may include states such as queued, in progress, successful or failed to see the progress and outcome of the policy execution. The central pane of the Jobs page contains components such as filters, status indicators, and job details for easier navigation and management.
| Fields | Descriptions |
|---|---|
| Asset Name | Name of the asset. Hover over the asset name to view its complete hierarchy up to the source. |
| Data Source | Name of the data source. |
| Type | Type of data source. |
| Profile Type | Type of profiling. For example, Full, Sample, or Incremental. |
| Status | Status of the profile done on the asset. For example, Succeeded, Failed, or Aborted. |
| Profiled At | Displays when the profiling occurred. |
| Last Health Update | Timestamp of the latest job health check. |
| Job State | Indicates the current status of the job (e.g., Aborted). |
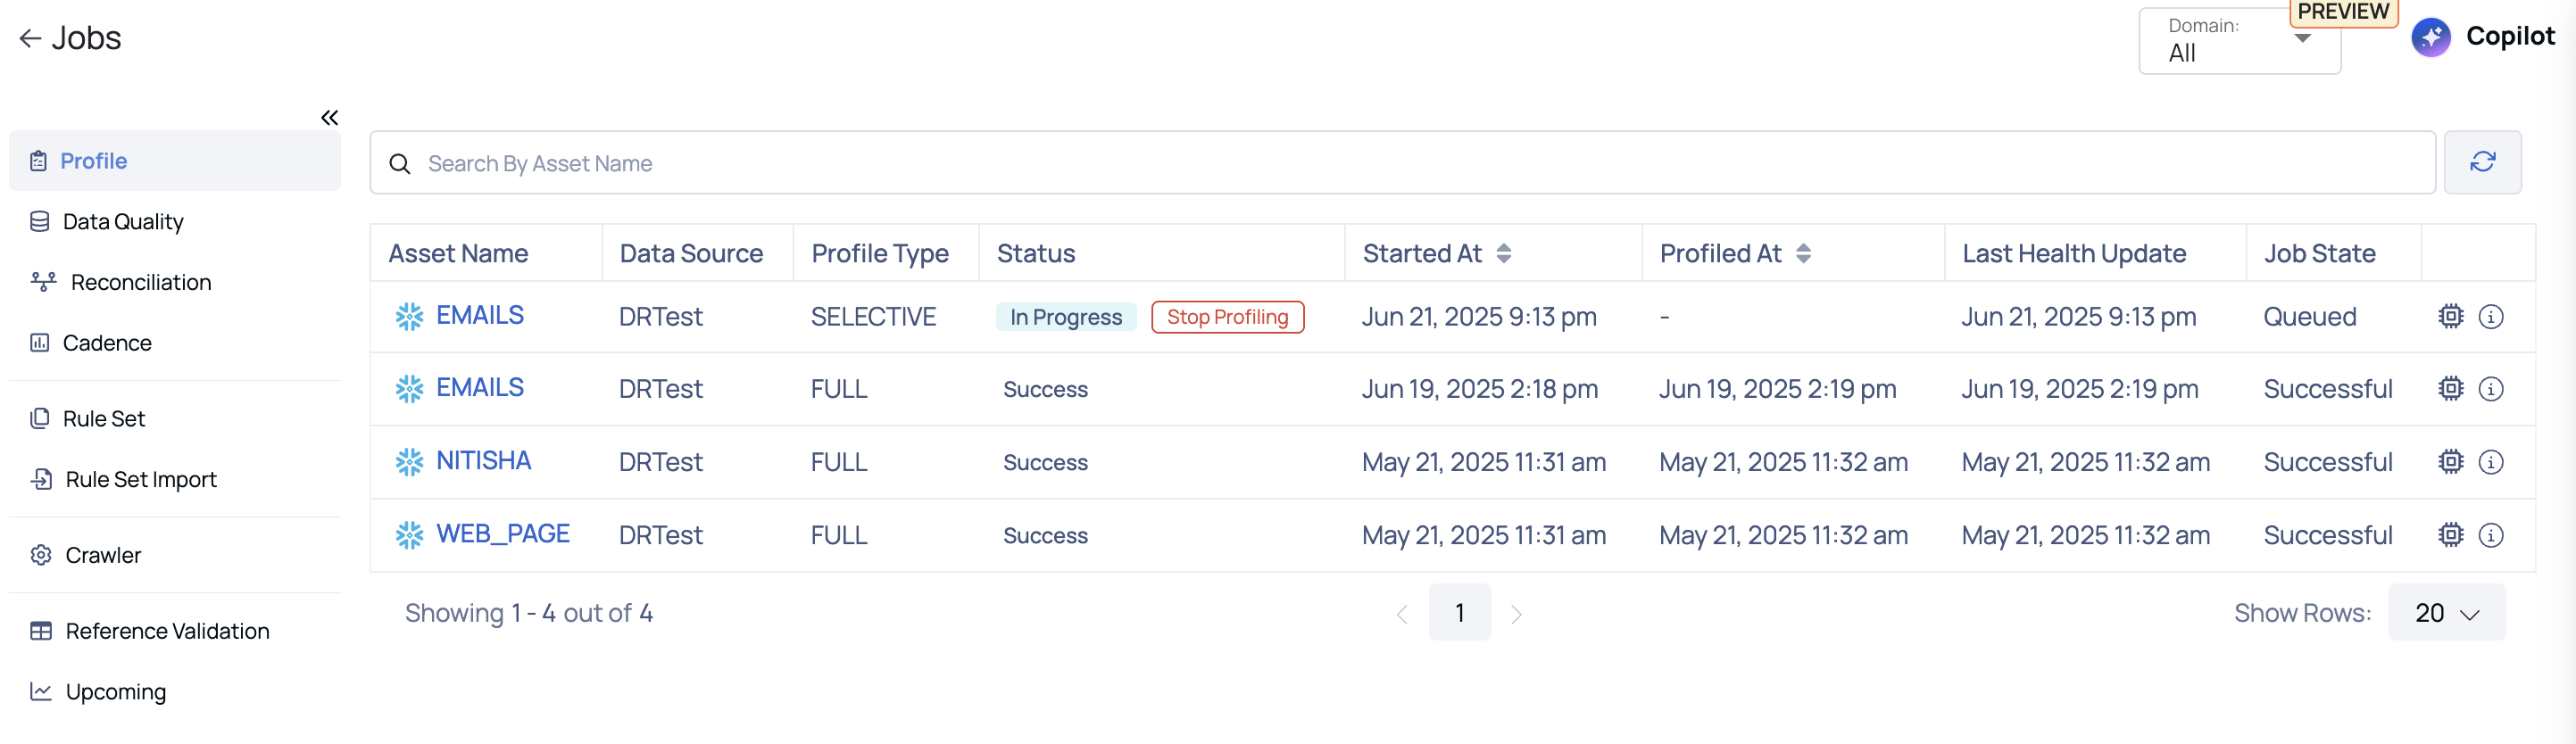
For selective execution, user input fields will automatically be populated based on the parameters of the last successful selective execution. If no selective execution has been previously conducted, the system will default to the established incremental strategy. Suggestions are provided based on the native data types of the underlying data source. This feature is valid only for DATETIME incremental strategy and is currently supported exclusively for Snowflake and BigQuery.
When you profile a table, certain metrics are calculated for each column. To accomplish such a computation, data is first stored into your host machine's RAM, and then the metrics are calculated.
Minimum and maximum values, for example, can be derived straight from the database. This eliminates the requirement for RAM on your host machine, resulting in significant memory savings. Mini-profiling is the process of calculating metrics straight from a database.
Mini-profiling jobs save a lot of memory, and the underlying data source's database handles the calculation of these metrics.
Note: Acceldata Data Observability Cloud (ADOC) supports mini-profiling of assets for the following data sources only:
Snowflake, PostgreSQL, MySQL, Athena, Big Query, Amazon Redshift
How to view running logs?
After profiling an asset, you can inspect the logs for that profile's job execution.
Click the View Logs icon on the right to get to the Profile Jobs Logs page.
On this page, you can view the driver node logs and matching executor node logs by selecting a log from the POD drop-down menu. You can optionally specify how many tailing lines to display, such as 50, 100, 250, or 500. You can view the logs as they are added by scrolling up and down.
Data Quality Jobs
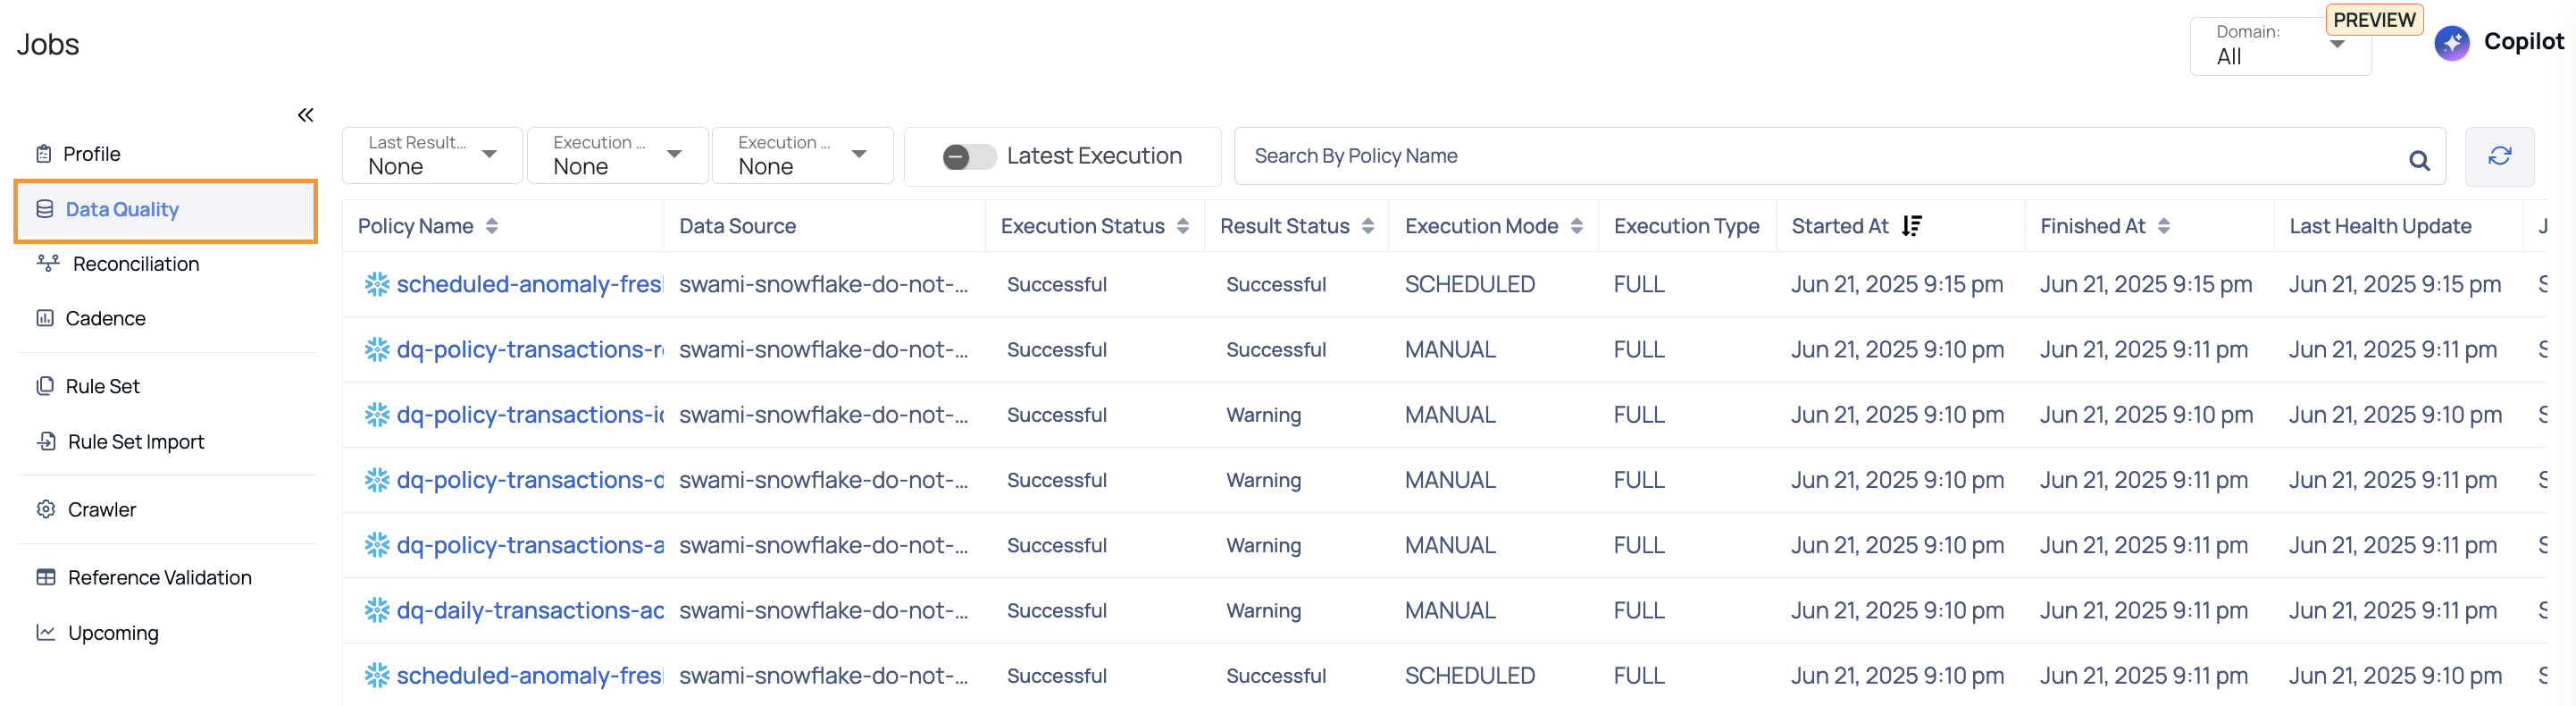
This page displays the Jobs related to Data Quality policy.
| Field | Descriptions |
|---|---|
| Policy Name | Name of the data quality policy. Hover over the policy name to view its complete hierarchy up to the source. |
| Data Source | Name of the data source. |
| Execution Status | Status of the current execution (e.g., Successful, Errored). Rerun Execution: You can rerun the policy if it encounters an Error or is Aborted. The execution will rerun using the same configurations as the original run. |
| Result Status | Outcome of the execution (e.g., Successful, Aborted). |
| Execution Mode | Method of execution (e.g., Manual). |
| Execution Type | Type of execution (e.g., Full, Selective). |
| Started At | Timestamp when the job started. |
| Finished At | Timestamp when the job finished. |
Reconciliation Jobs
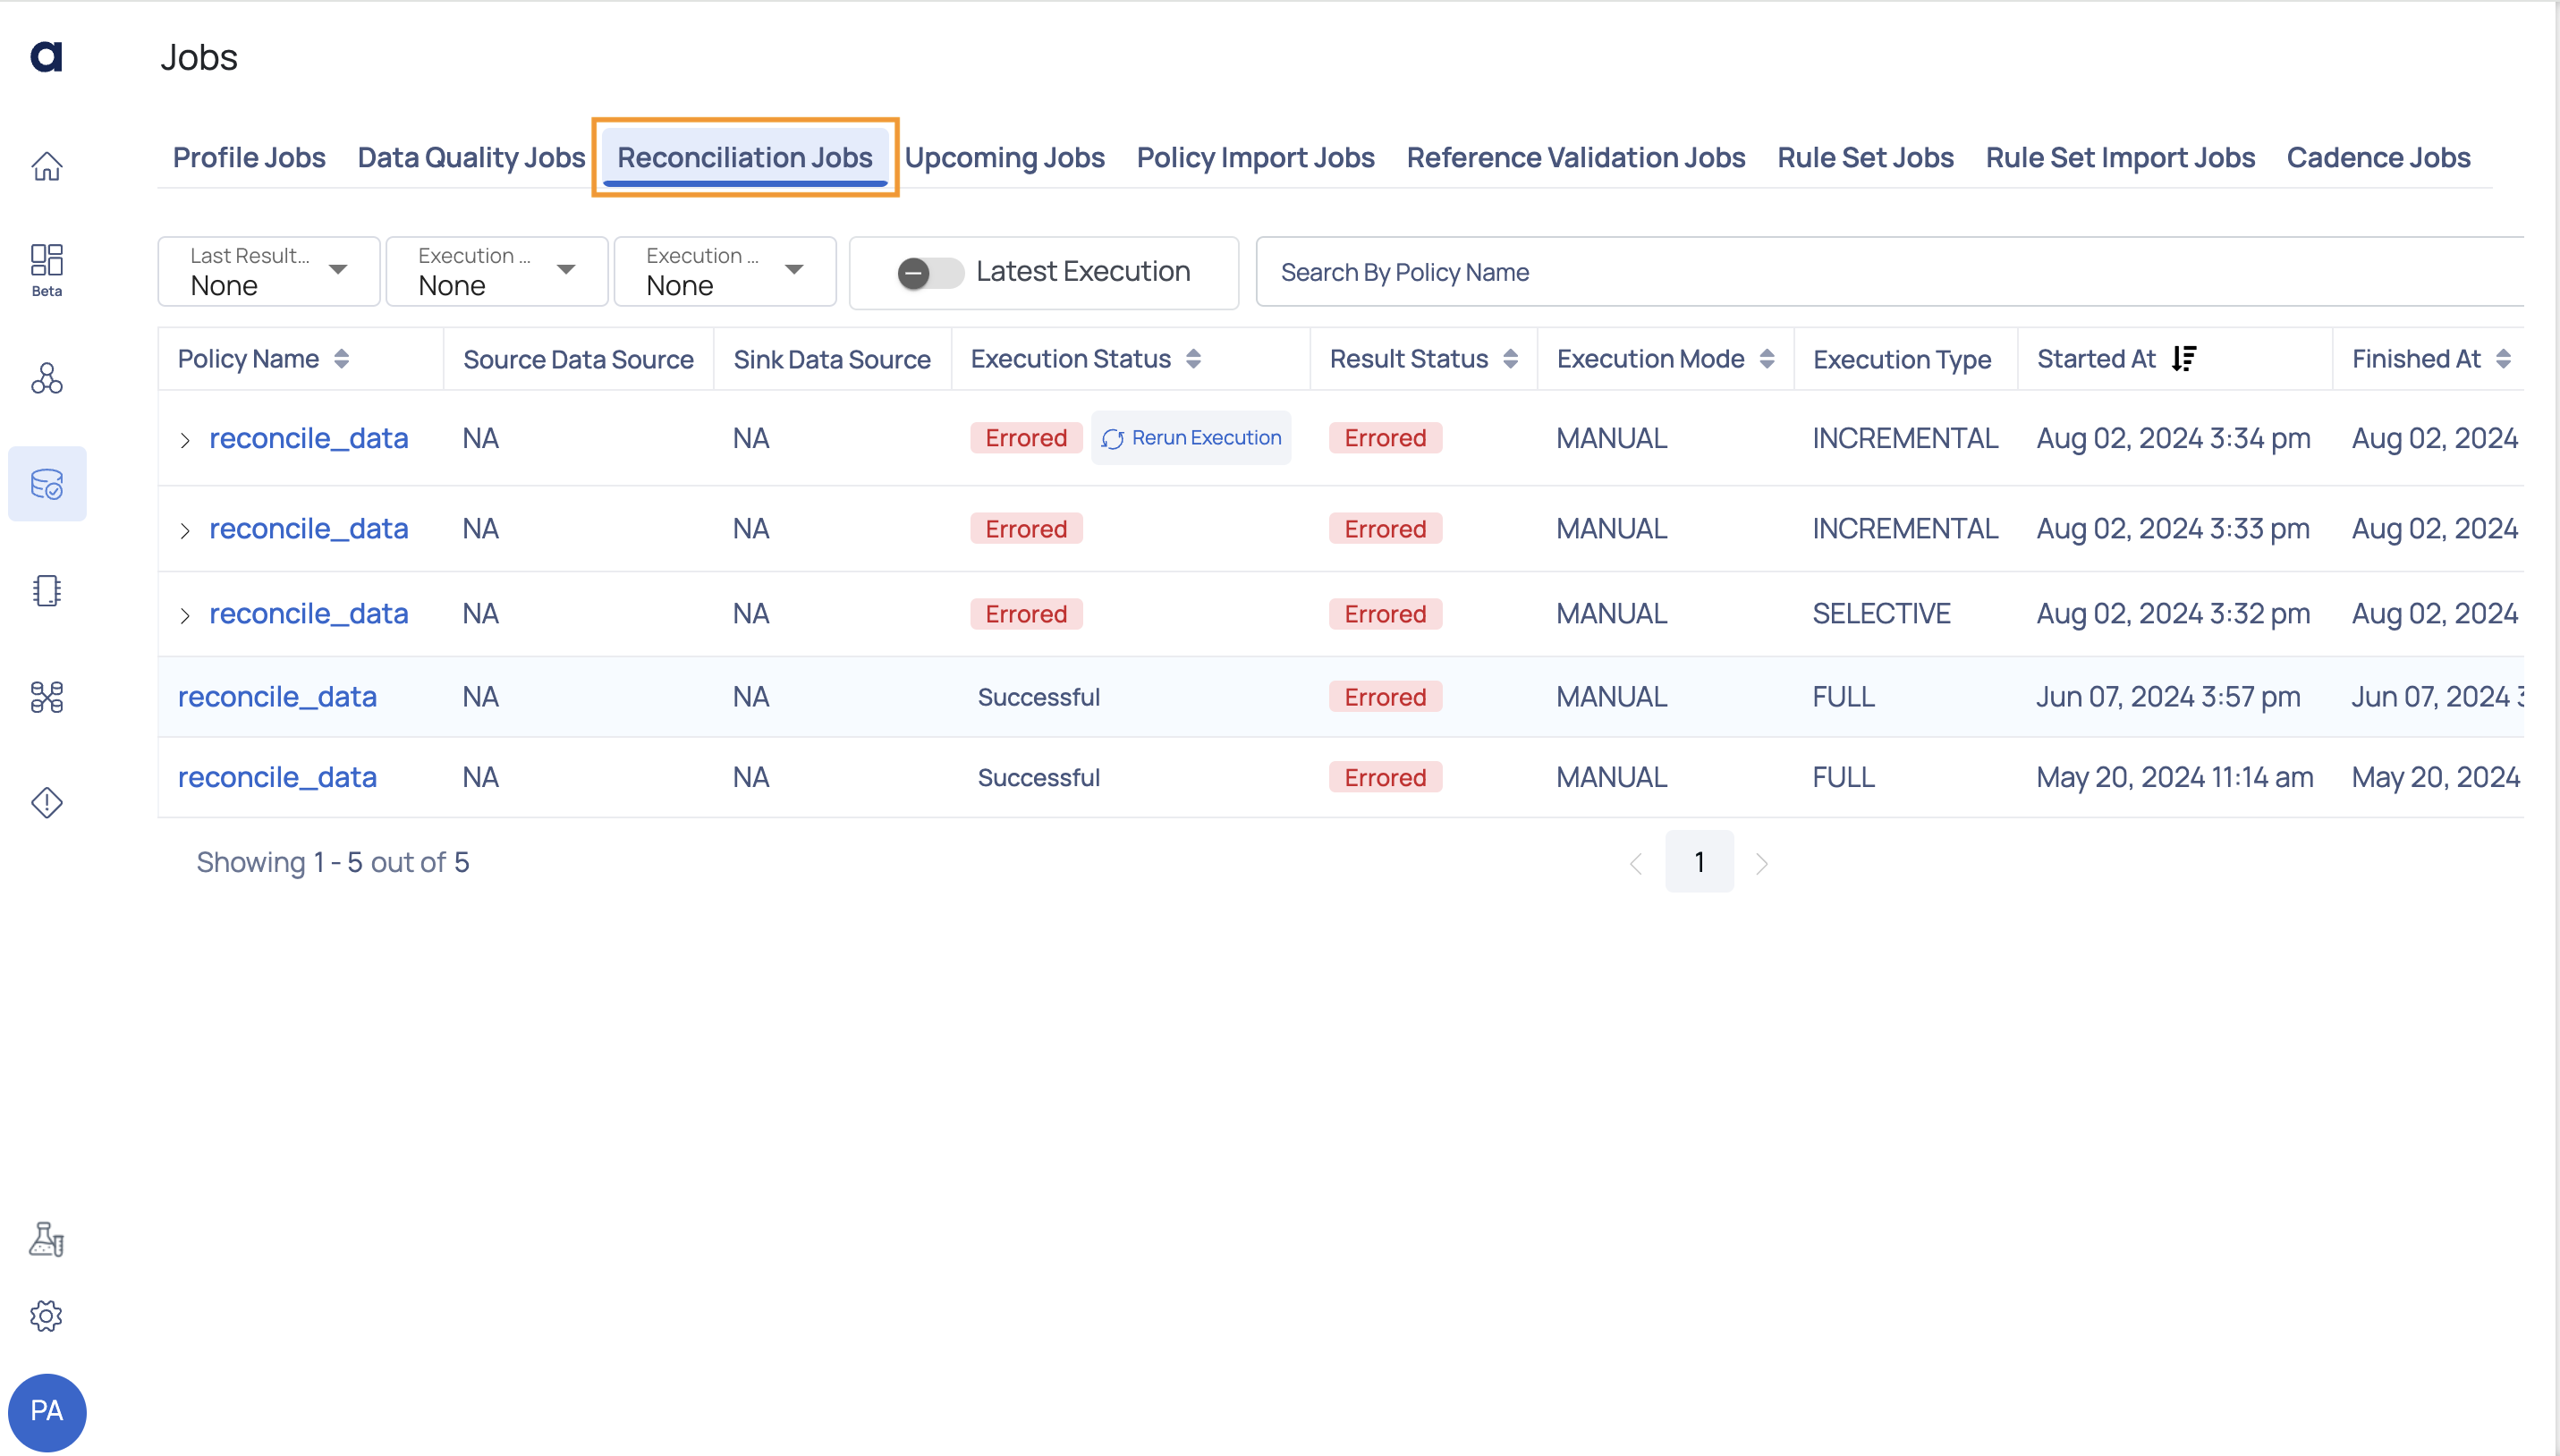
This page displays the Jobs related to reconciliation.
| Widget | Description |
|---|---|
| Policy Name | Name of the Reconciliation policy. Hover over the policy name to view its complete hierarchy up to the source. |
| Source Data Source | The origin from where the data is being fetched or ingested (e.g., database, file storage). |
| Sink Data Source | The destination where the processed data is written or stored (e.g., data warehouse, cloud storage). |
| Execution Status | Status of the execution on the Reconciliation policy. For example, Succeeded, Running, or Errored. Rerun Execution: You can rerun the policy if it encounters an Error or is Aborted. The execution will rerun using the same configurations as the original run. |
| Result Status | Status of the execution on completion. For example, Succeeded, Running, or Errored. |
| Execution Mode | Type of execution applied on the Reconciliation policy. For example, Scheduled or Manual. |
| Execution Type | Type of execution (e.g., Full, Selective). |
| Started At | Date and time at which the execution was started on the Reconciliation policy. |
| Finished At | Date and time at which the execution of the policy completed. |
Upcoming Jobs
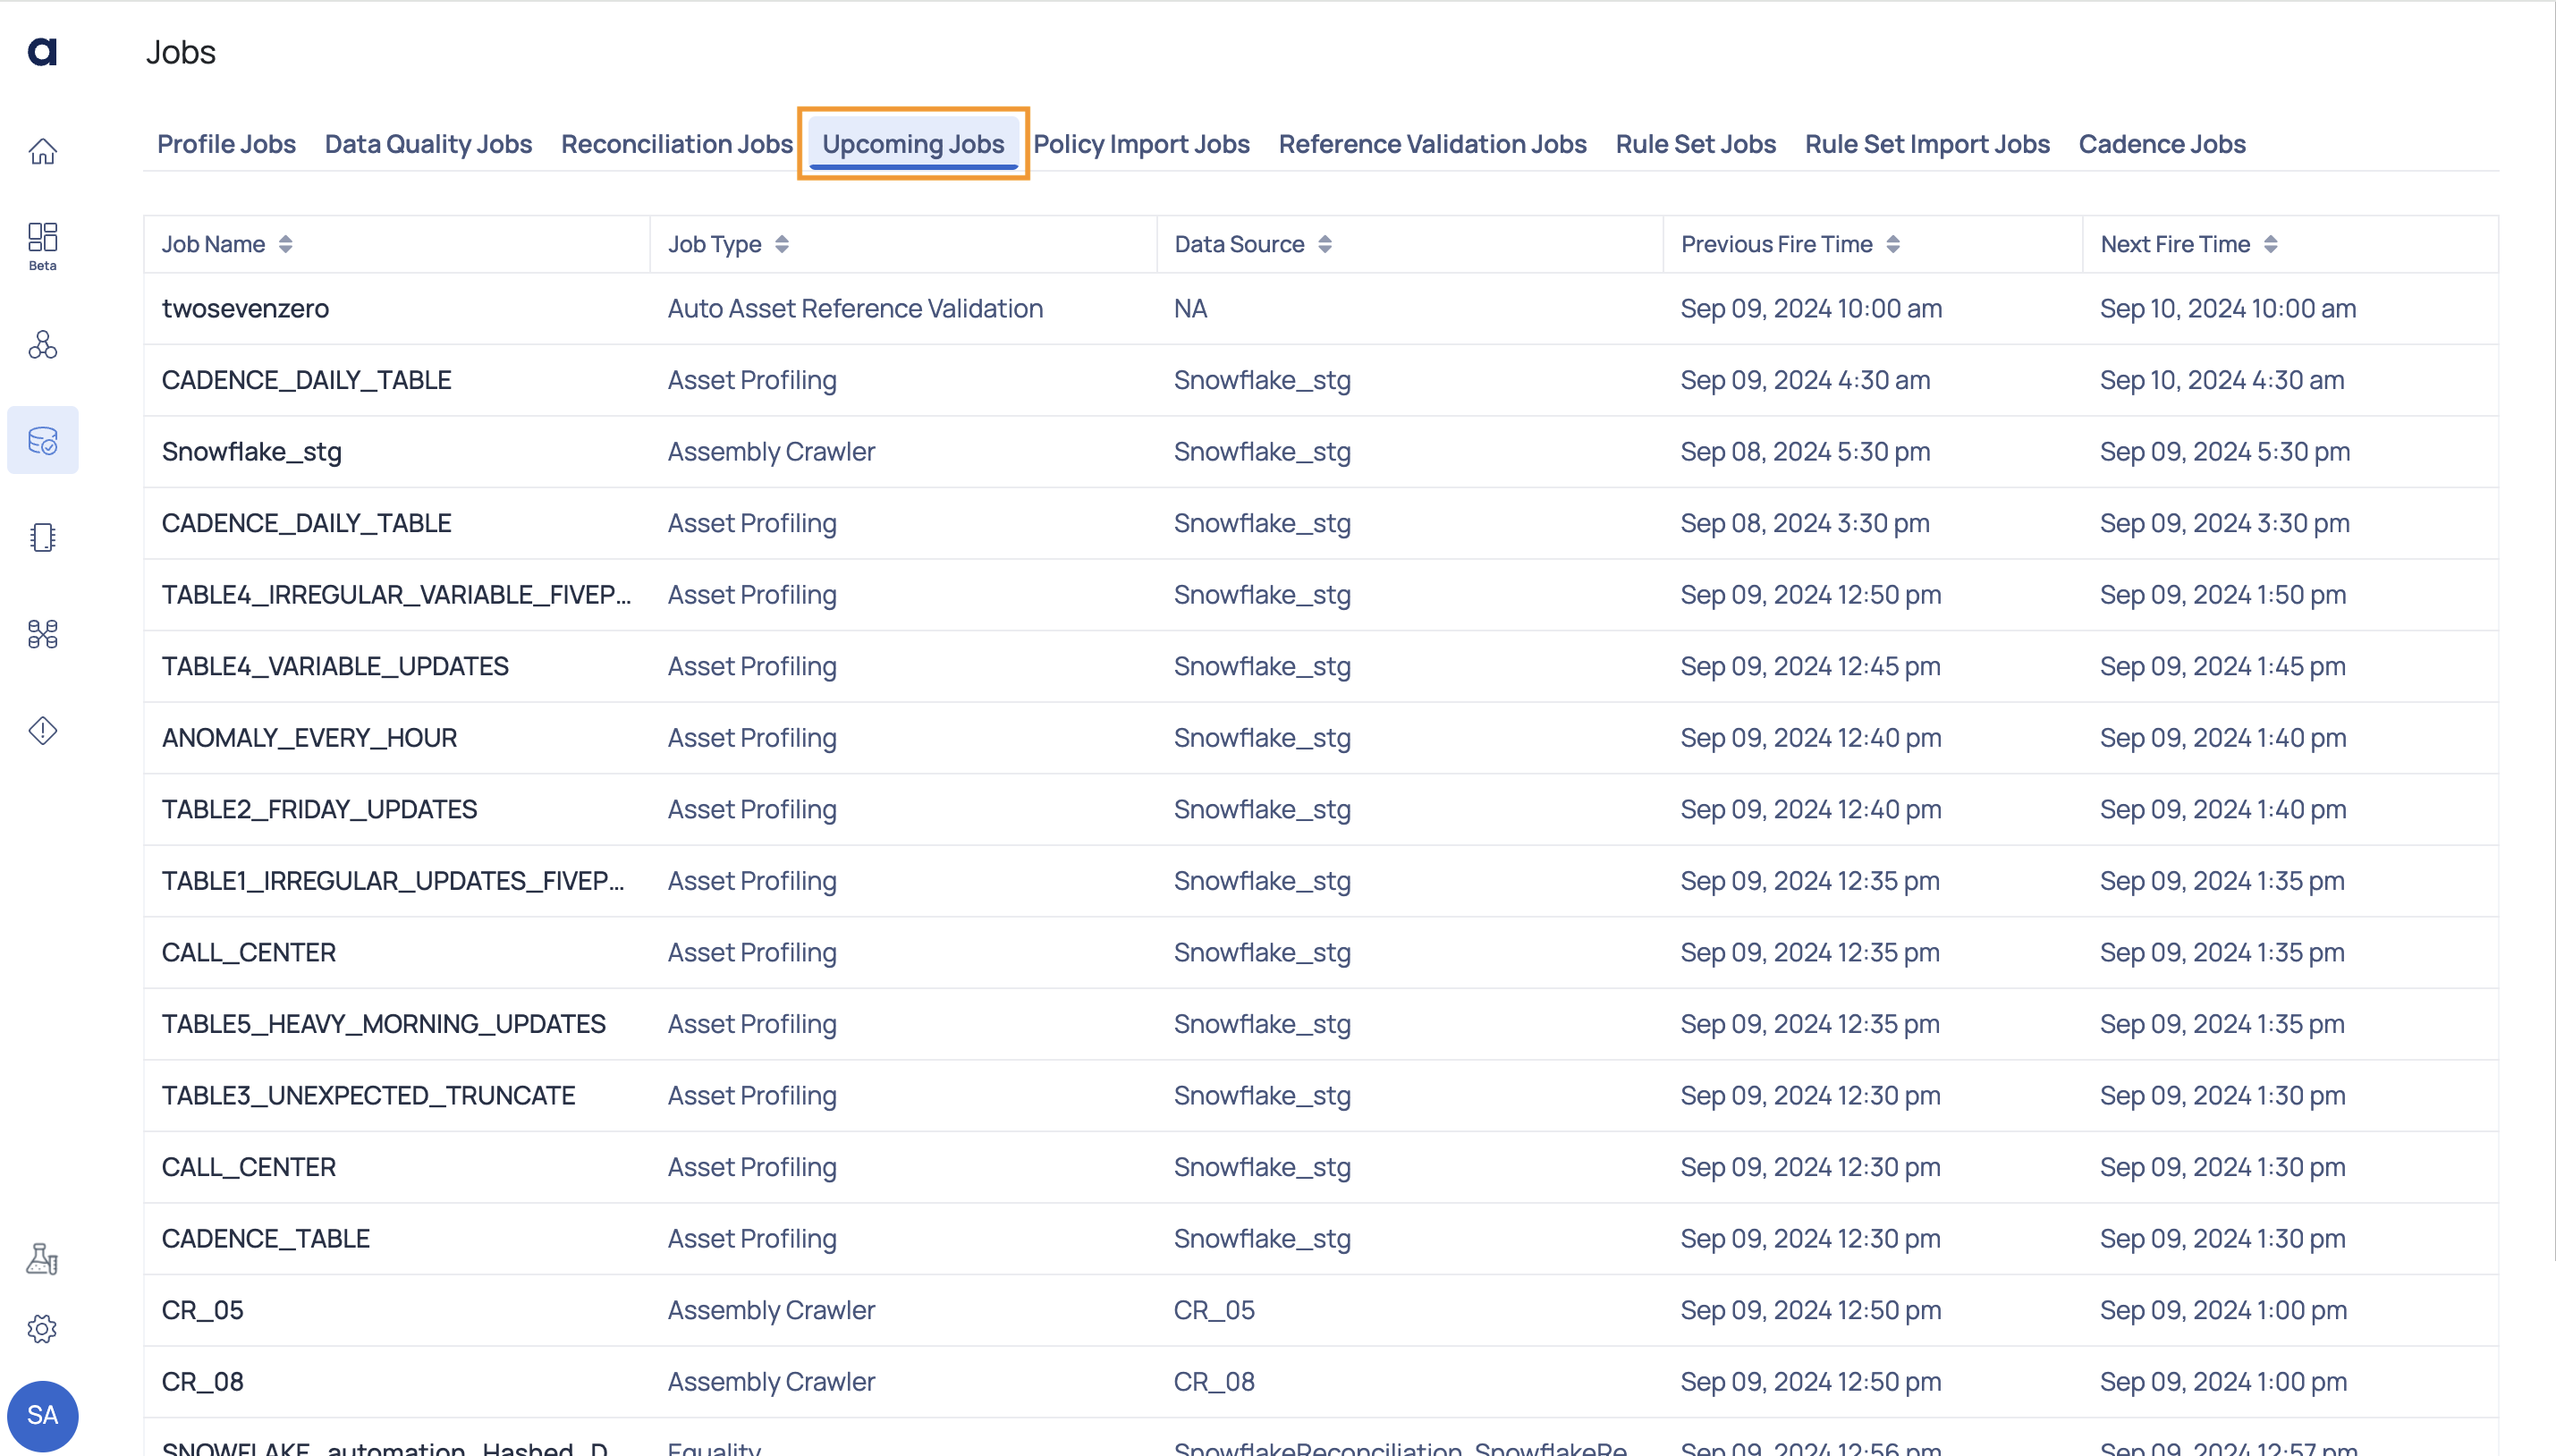
This page displays the upcoming jobs.
| Field | Descriptions |
|---|---|
| Job Name | The name of the job, scheduled to be executed. Hover over the job name to view its complete hierarchy up to the source. |
| Job Type | The job type to which the job belongs to. |
| Data Source | The system or location from which the data is retrieved for processing jobs. |
| Previous Fire Time | The date and time when the job was last executed. |
| Next Fire Time | The date and time when the job is scheduled to be executed next. |
You can refresh the page to view the latest upcoming jobs. You can also reset the number of rows displayed on the table.
Policy Import Jobs
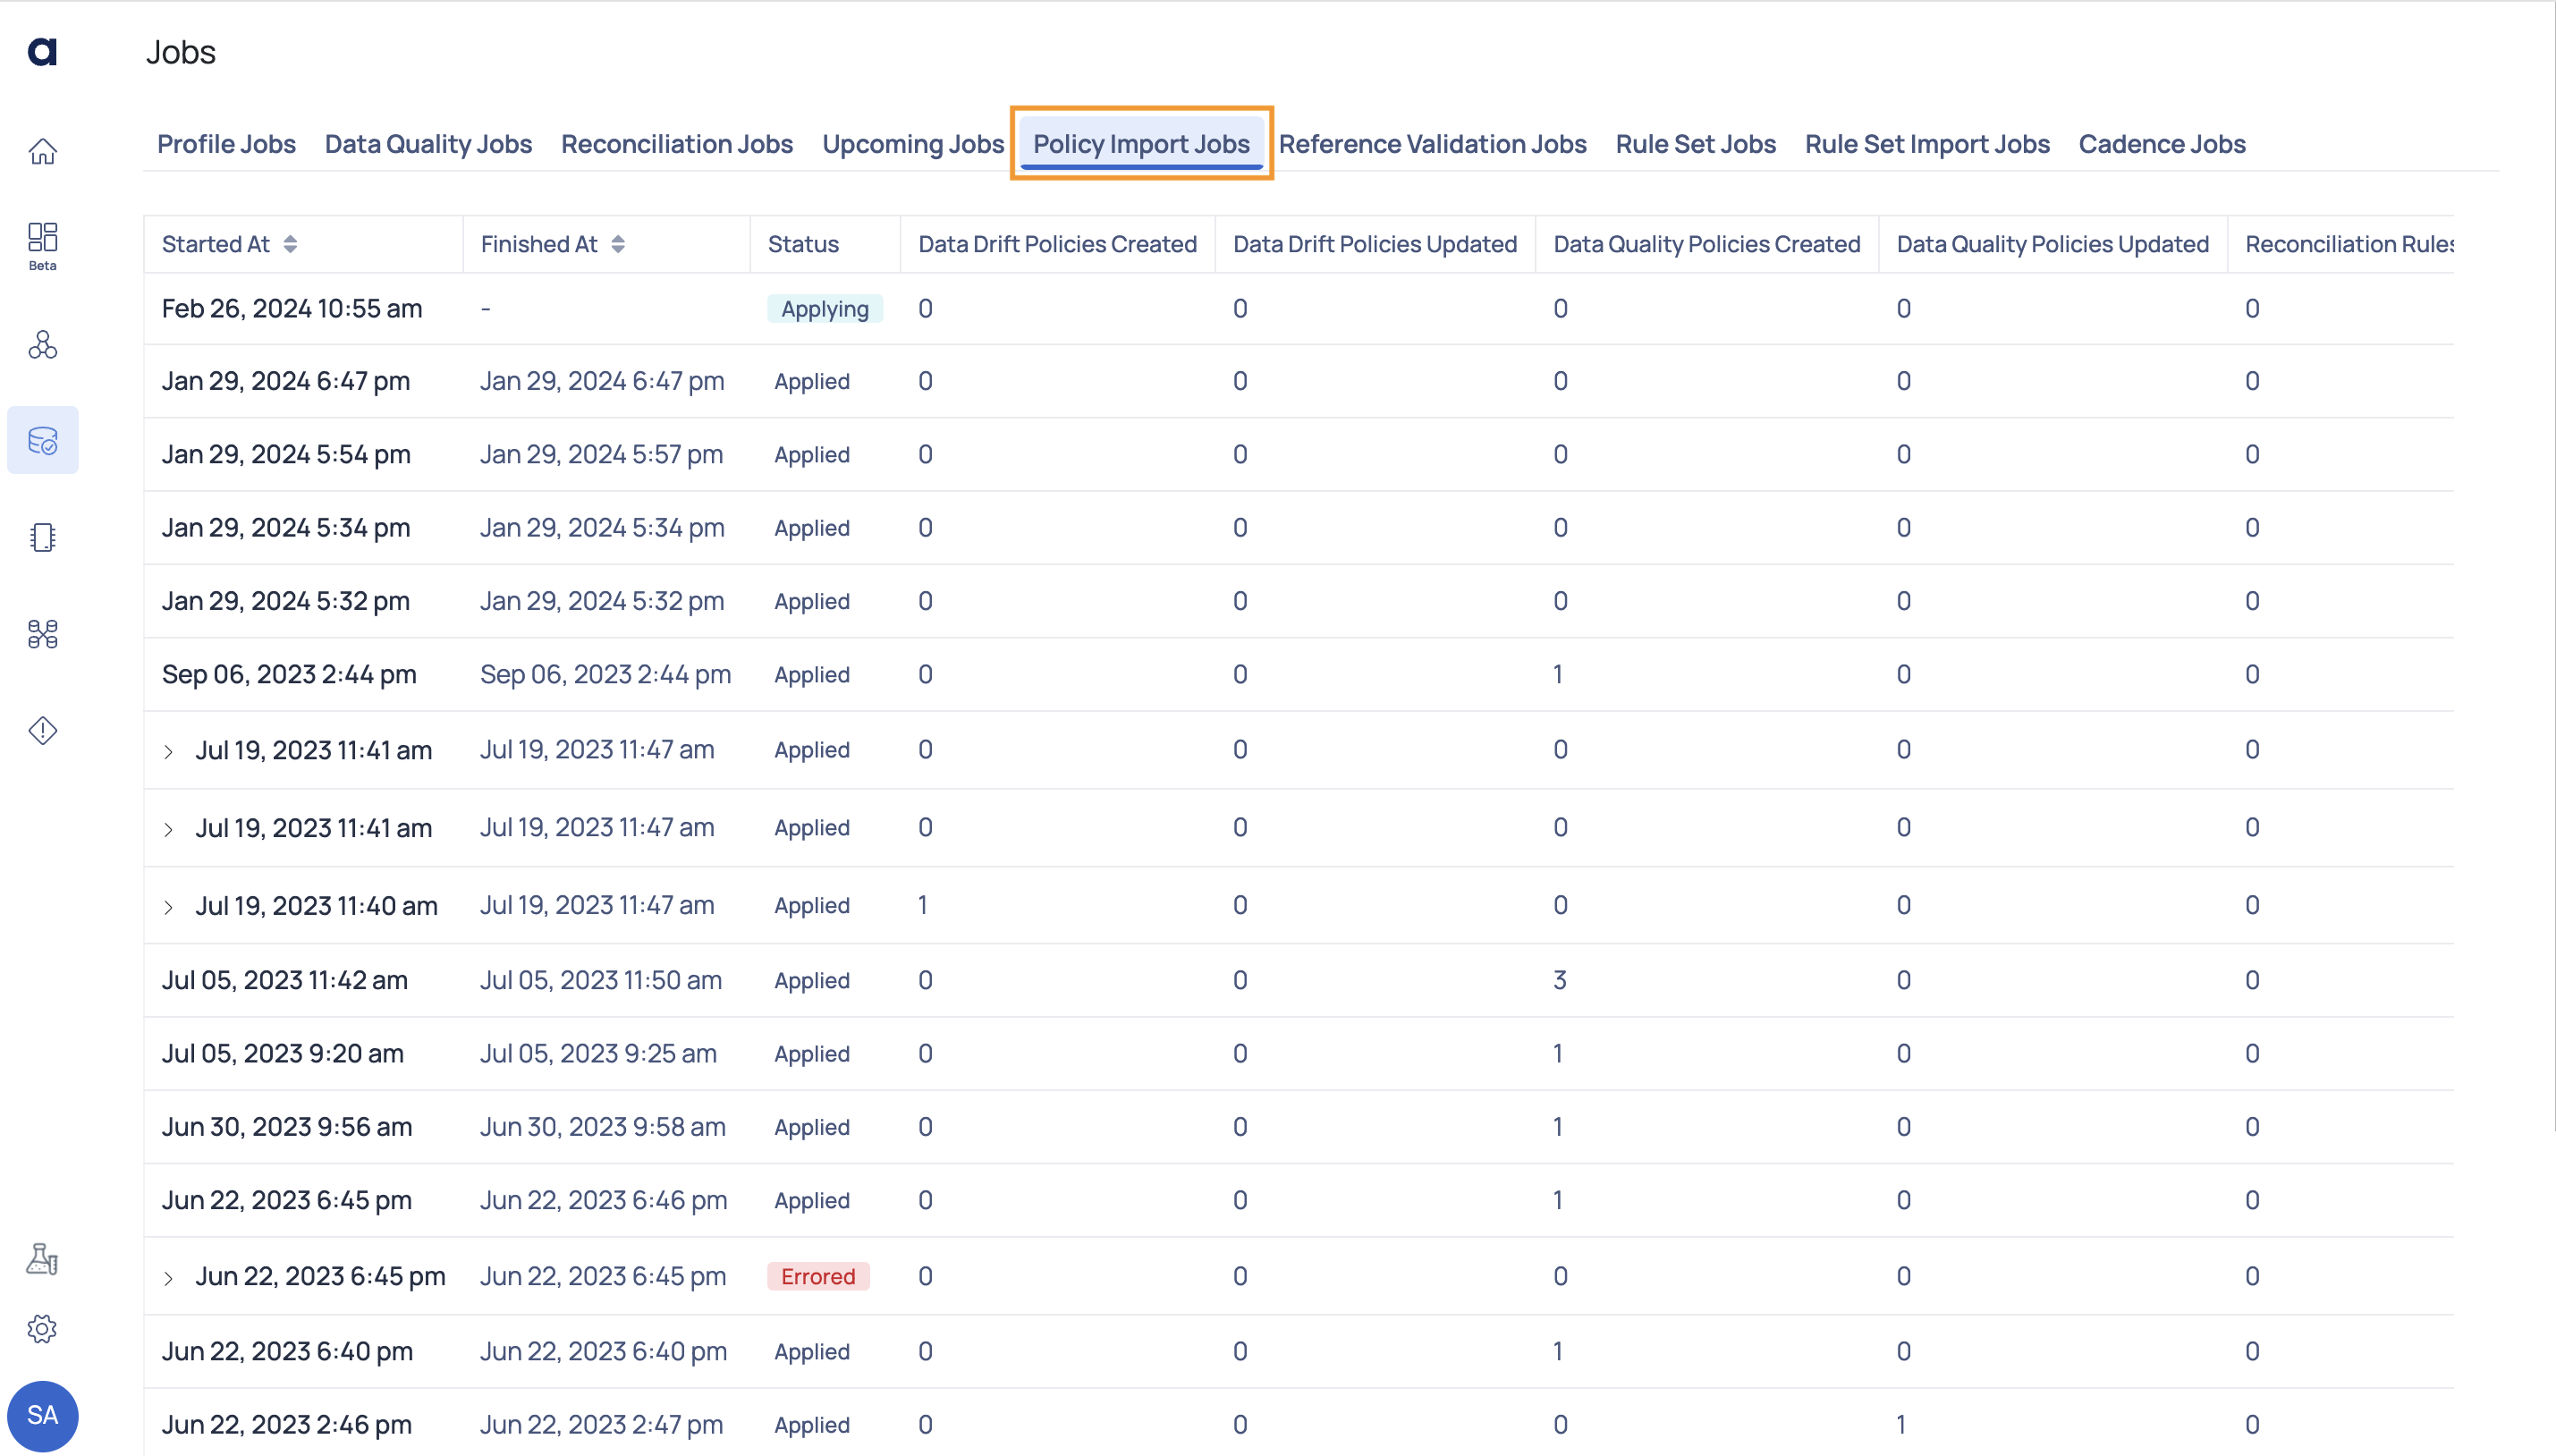
This page allows you to track the status of policy import jobs. The import job allows you to import policies to ADOC. When you import a policy, based on the data present in the imported file, new policies are created and existing policies are updated. You can find all these details on this page.
| Fields | Descriptions |
|---|---|
| Started At | The date and time when the import job started. |
| Finished At | The date and time when the import job finished. |
| Status | The status of the import job. |
| Data Drift Policies Created | The number of data drift policies created by the job. |
| Data Drift Policies Updated | The number of data drift policies updated by the job |
| Data Quality Policies Created | The number of quality policies created by the job. |
| Data Quality Policies Updated | The number of quality policies updated by the job. |
| Reconciliation Rules Created | The number of reconciliation jobs created by the job. |
| Reconciliation Rules Updated | The number of reconciliation jobs updated by the job. |
| Schema Drift Policies Created | The number of schema drift policies created by the job. |
| Schema Drift Policies Updated | The number of schema drift policies updated by the job. |
| Data Cadence Policy Created | The number of data cadence policies created by the job. |
| Data Cadence Policy Updated | The number of data cadence policies updated by the job. |
| Profile Anomaly Policy Created | The number of profile anomaly policies created by the job. |
| Profile Anomaly Policy Updated | The number of profile anomaly policies updated by the job. |
| SQL Views Created | The number of SQL views created by the job. |
| SQL Views Created | The number of SQL views updated by the job. |
| Visual Views Created | The number of visual views created by the job. |
| Visual Views Updated | The number of visual views updated by the job. |
Reference Validation Jobs
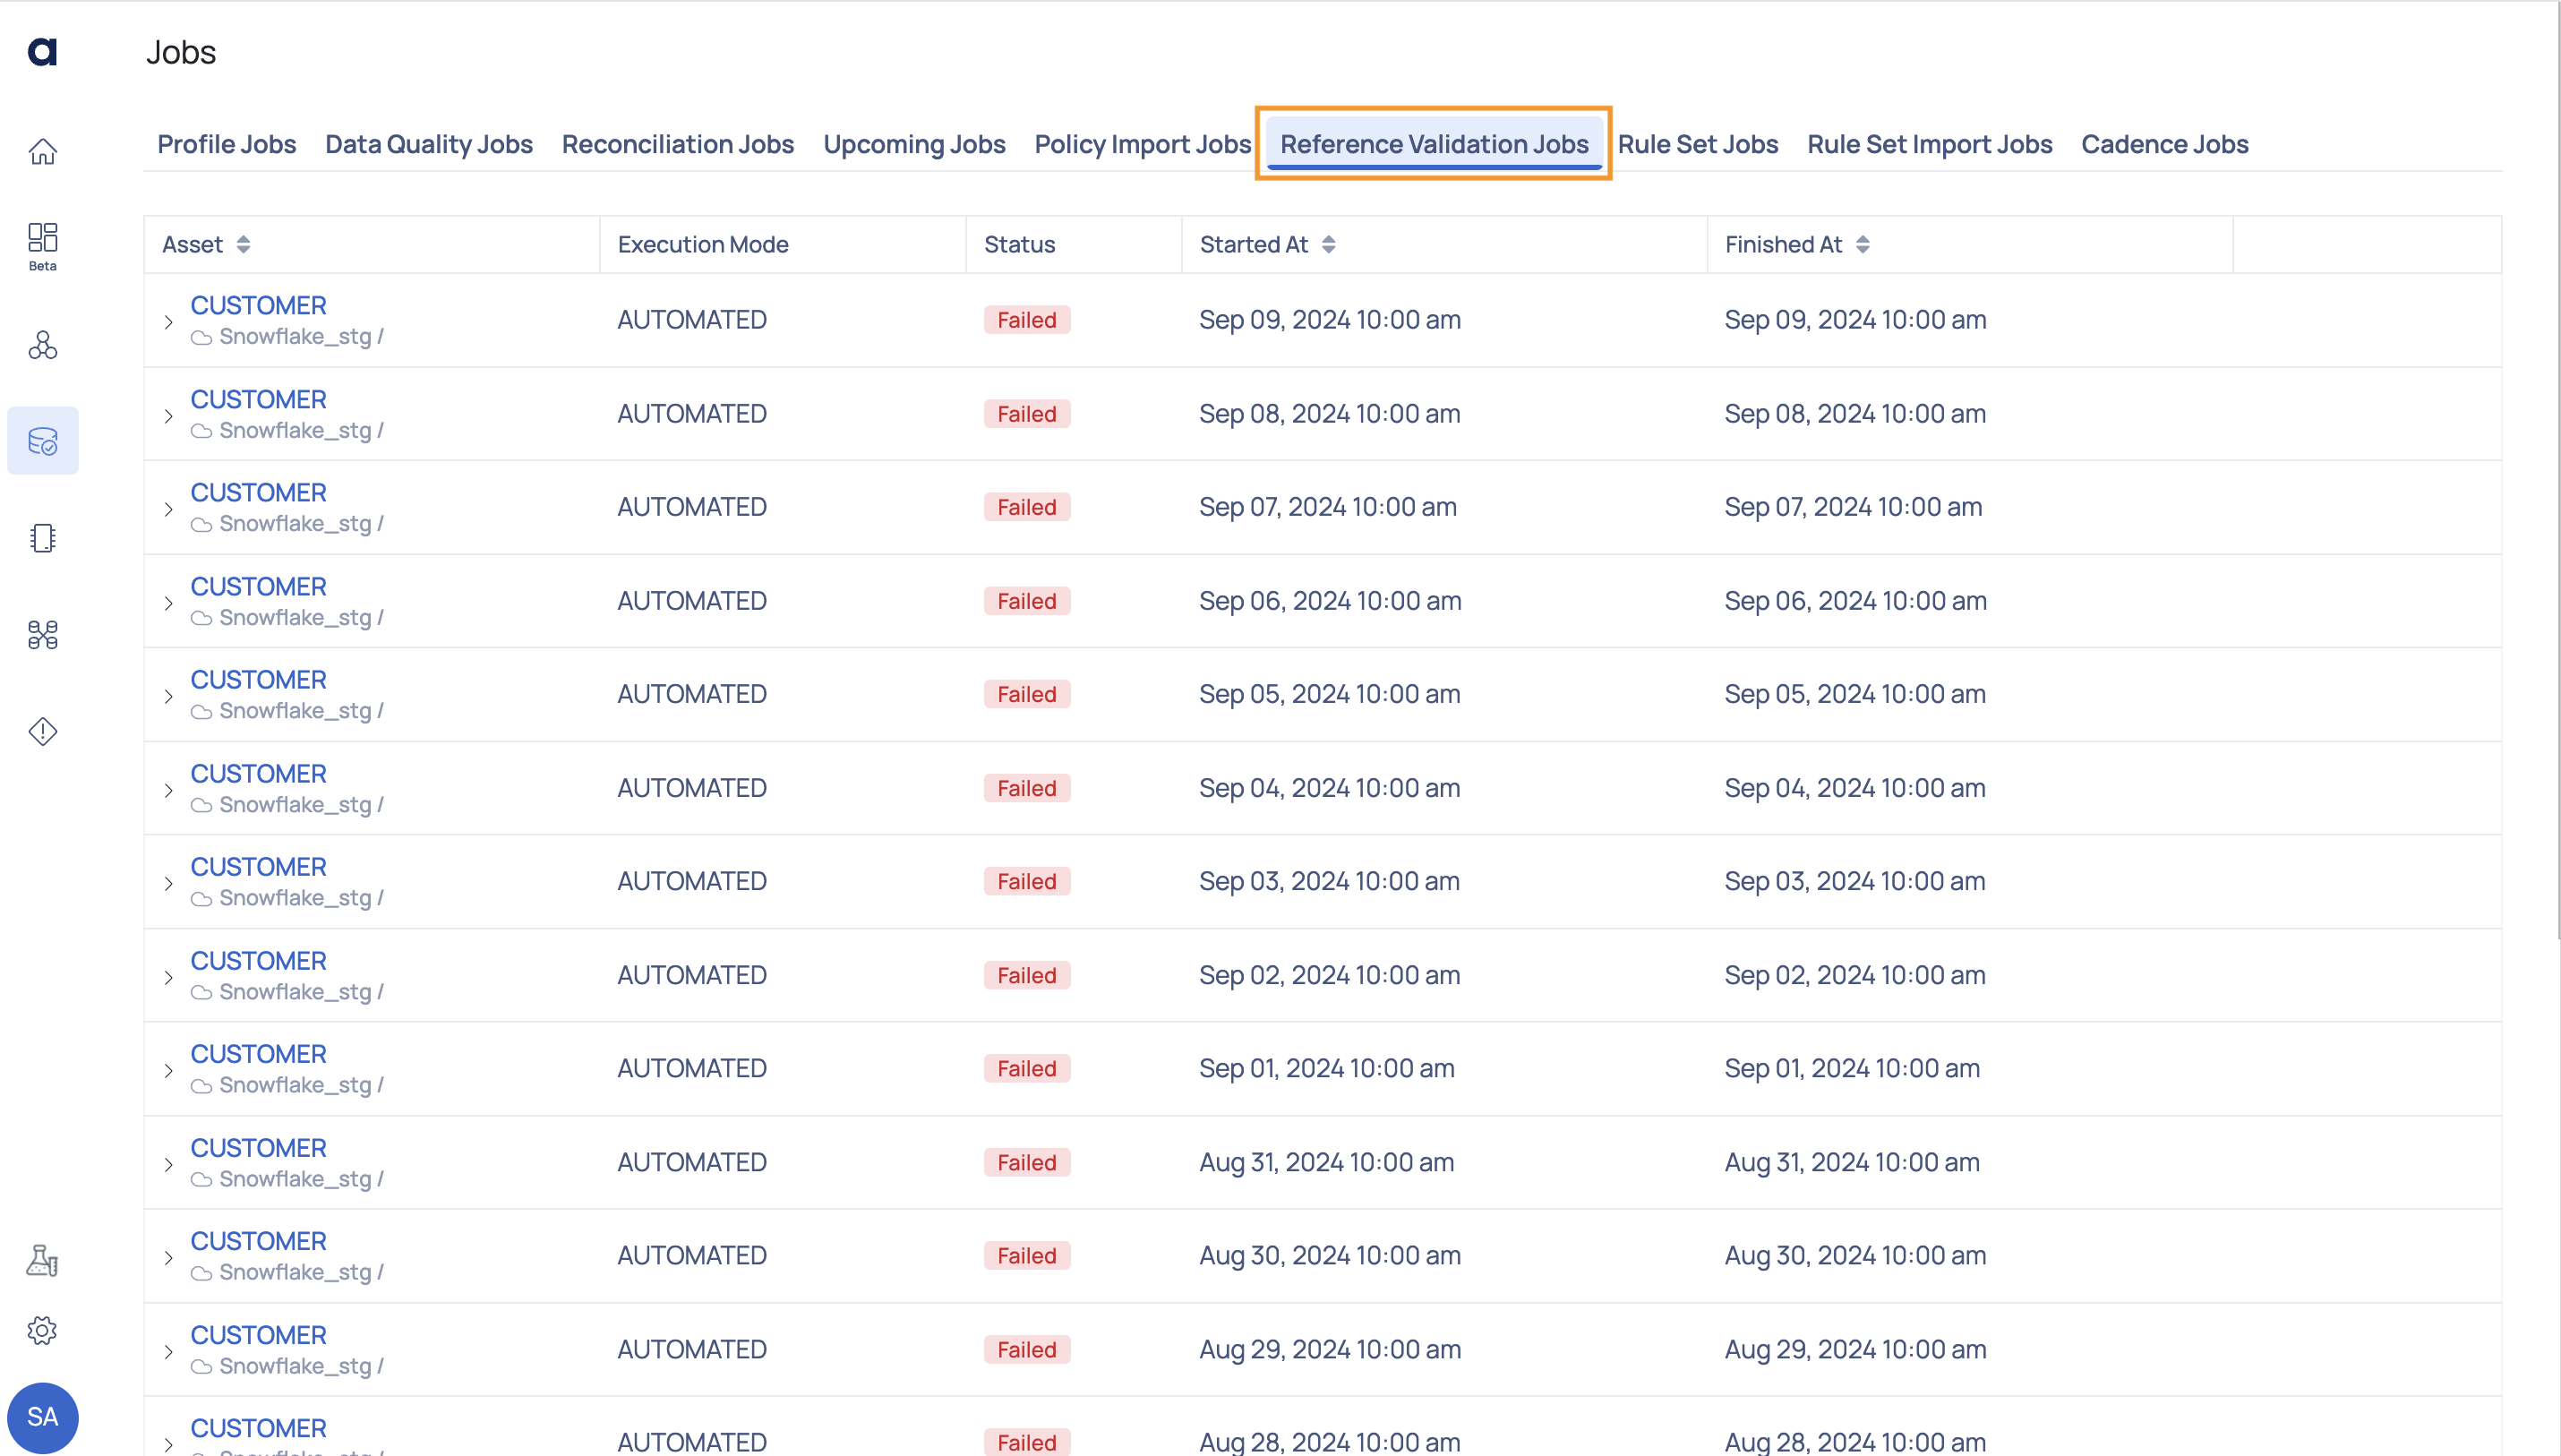
This page displays the status of reference asset validation jobs. When you use the Lookup rules in Quality policy, you must set the assets from which lookup will be done, as reference assets. To learn more about Lookup policy, see Lookup Data Quality Policy Rule.
| Fields | Descriptions |
|---|---|
| Asset | Name of the reference asset. |
| Execution Mode | The execution method of the job. |
| Status | The status of the import job. |
| Started At | The date and time when the job execution started. |
| Finished At | The date and time when the job execution completed. |
| Error Message | The error message for failed jobs. |
Rule Set Jobs
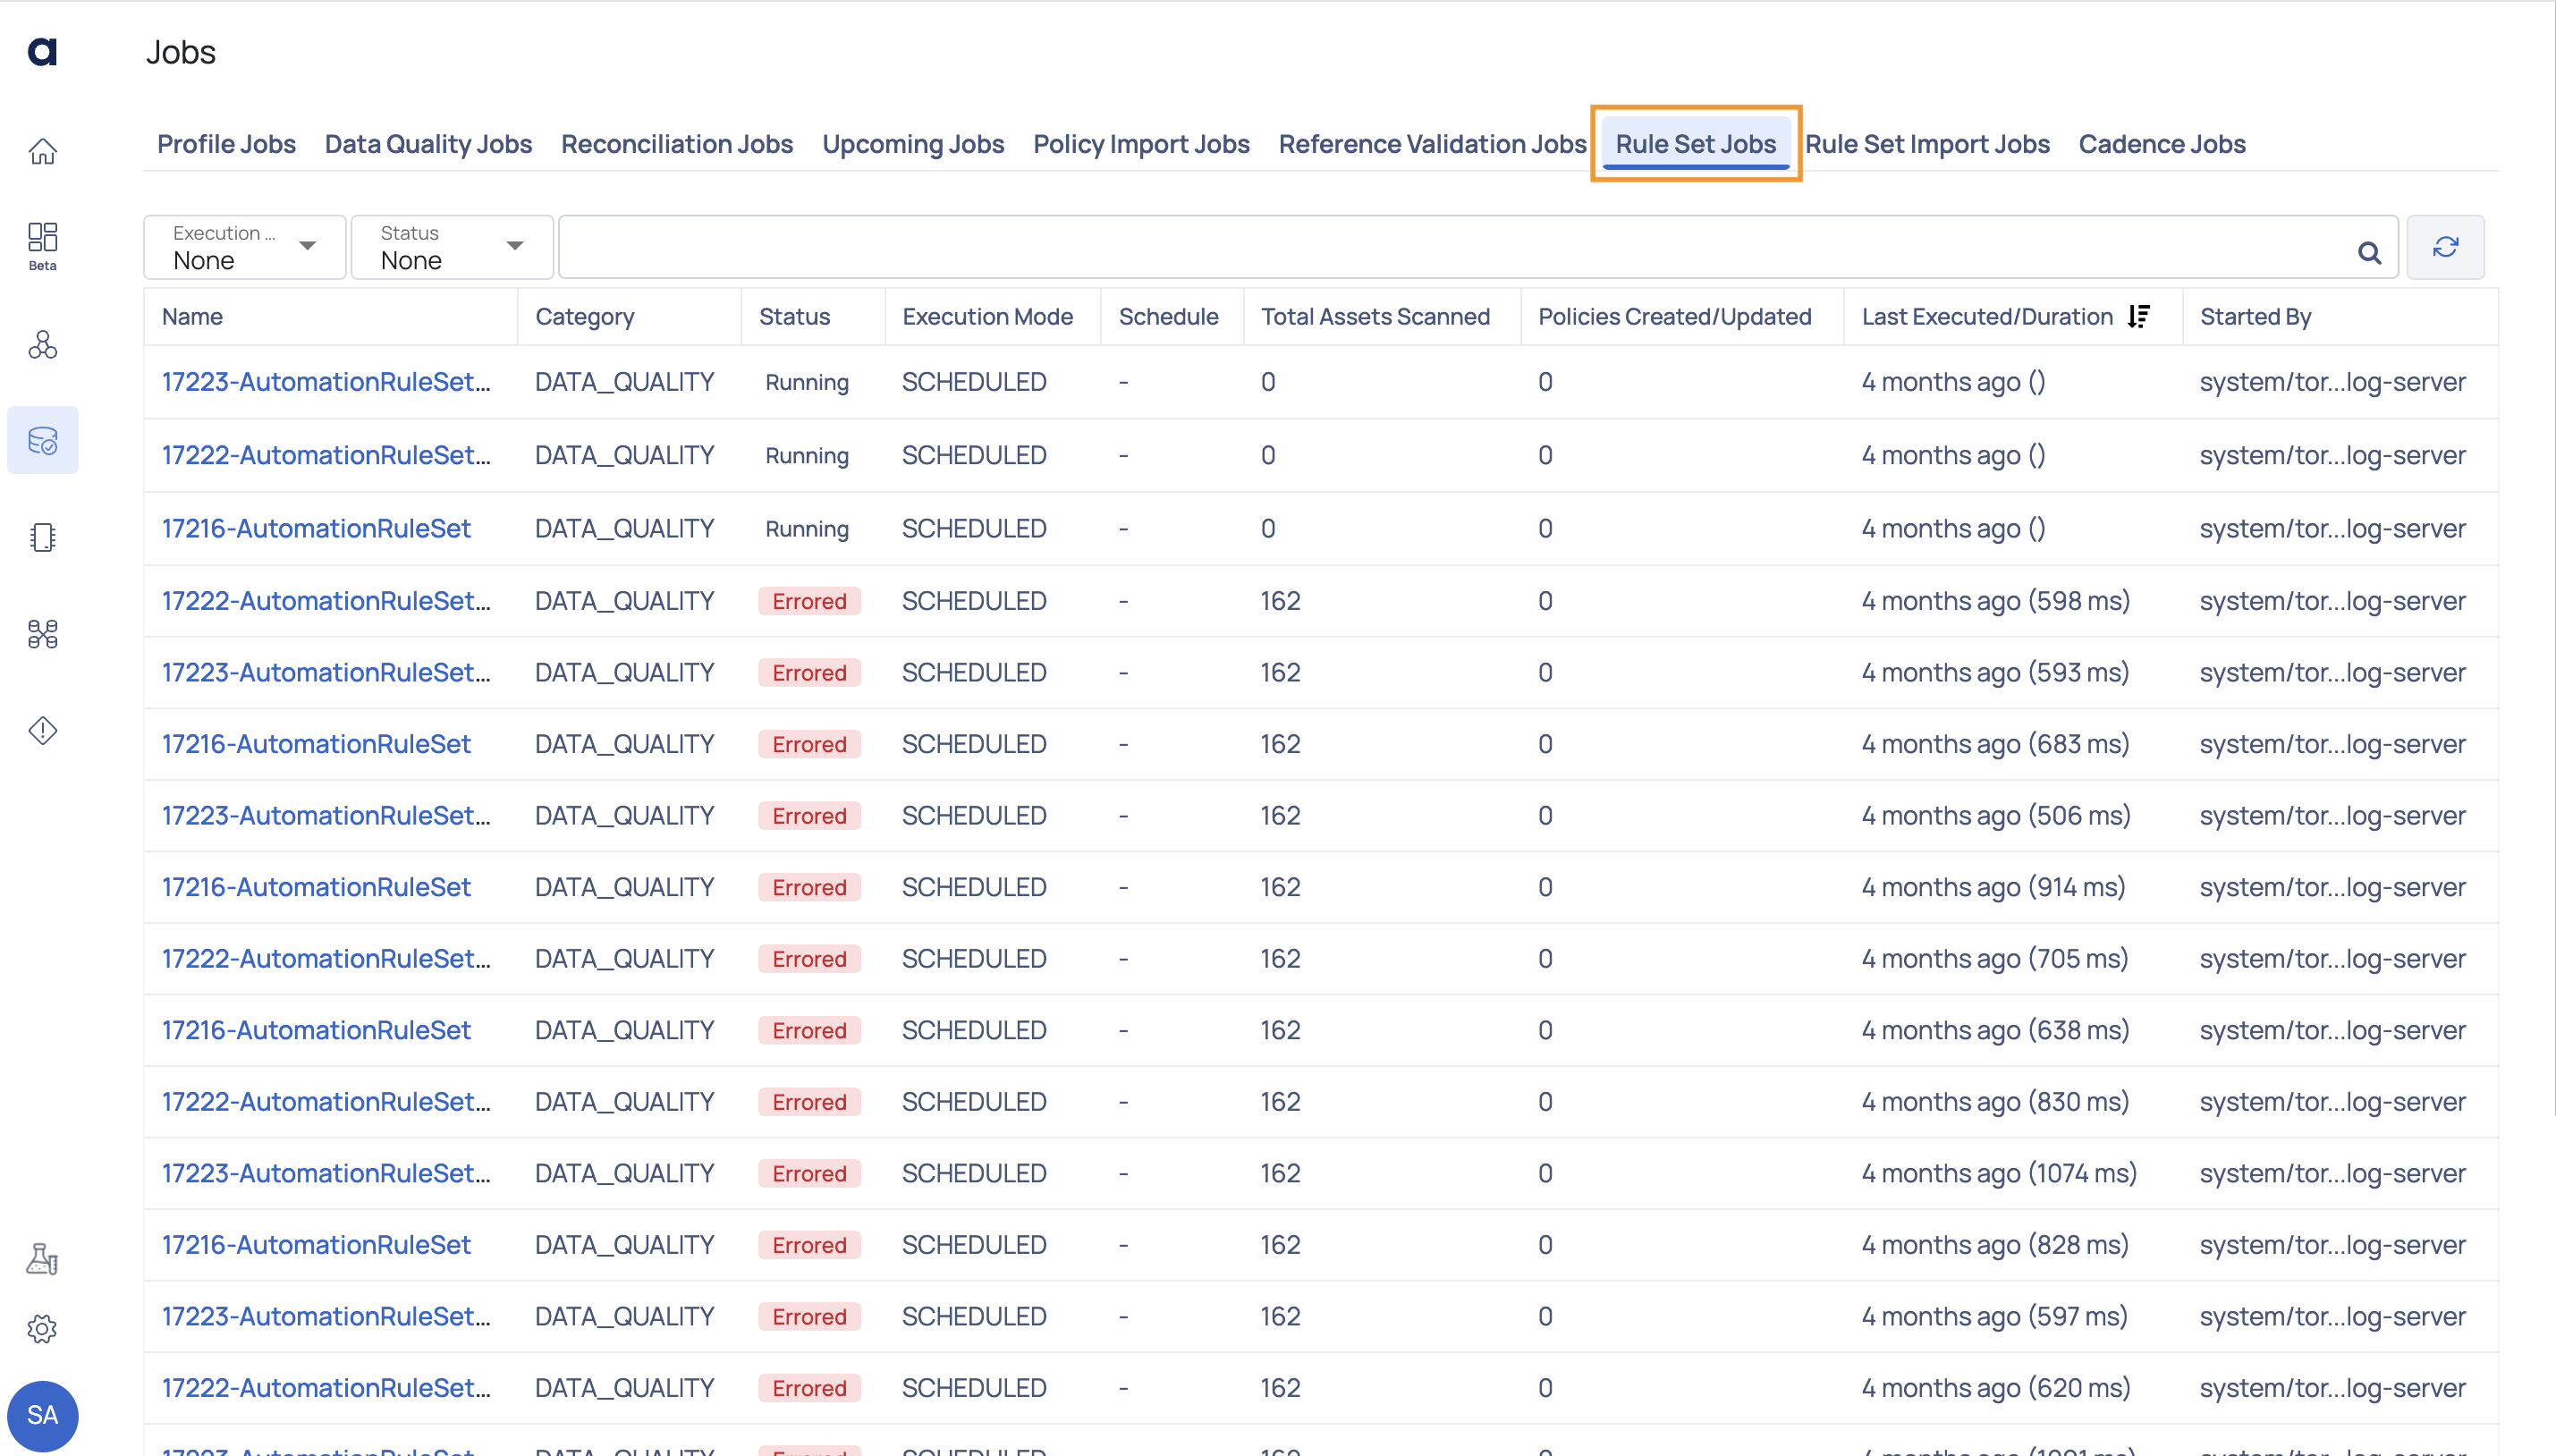
The rule set jobs page displays the status of all the rule sets applied to data sources.
| Column Name | Description |
|---|---|
| Name | Displays the name of the Rule Set jobs. |
| Category | Displays the category of the Rule Set jobs. |
| Status | Displays the status of the job. |
| Execution Mode | Displays the type of executions such as Manual or Automatic. |
| Schedule | Displays the schedule. |
| Total Assets Scanned | Displays the total number of assets scanned. |
| Policies Created/Updated | Displays the number of polices created or updated. |
| Last Executed/Duration | Displays the last executed time period in days and months and in milli seconds. |
| Started By | Displays the name of the user who has started the Job. |
Cadence Jobs

On this page, you can monitor cadence executions on an hourly basis. This feature allows you to quickly identify if a cadence job has failed for any data source and provides detailed insights into the specific state in which the job encountered issues.
Cadence anomalies are only identified for an asset if a Data Freshness policy is configured for it.
| Column Name | Description |
|---|---|
| Assembly Name | The name of the job or task being executed. |
| Monitor Execution Status | The current status of the execution of the monitoring process, indicating whether it is successful, running, or failed. |
| Cadence Anomaly Detection Status | The status of the anomaly detection process within the job, showing if it has succeeded, is waiting, or has failed. |
| Started At | The timestamp when the job or task began execution. |
| Finished At | The timestamp when the job or task completed execution. |
| Job State | The final state of the job, providing a more detailed description of the process, such as metrics requests sent, partial analysis received, or the task being fully completed. |
Crawler Jobs
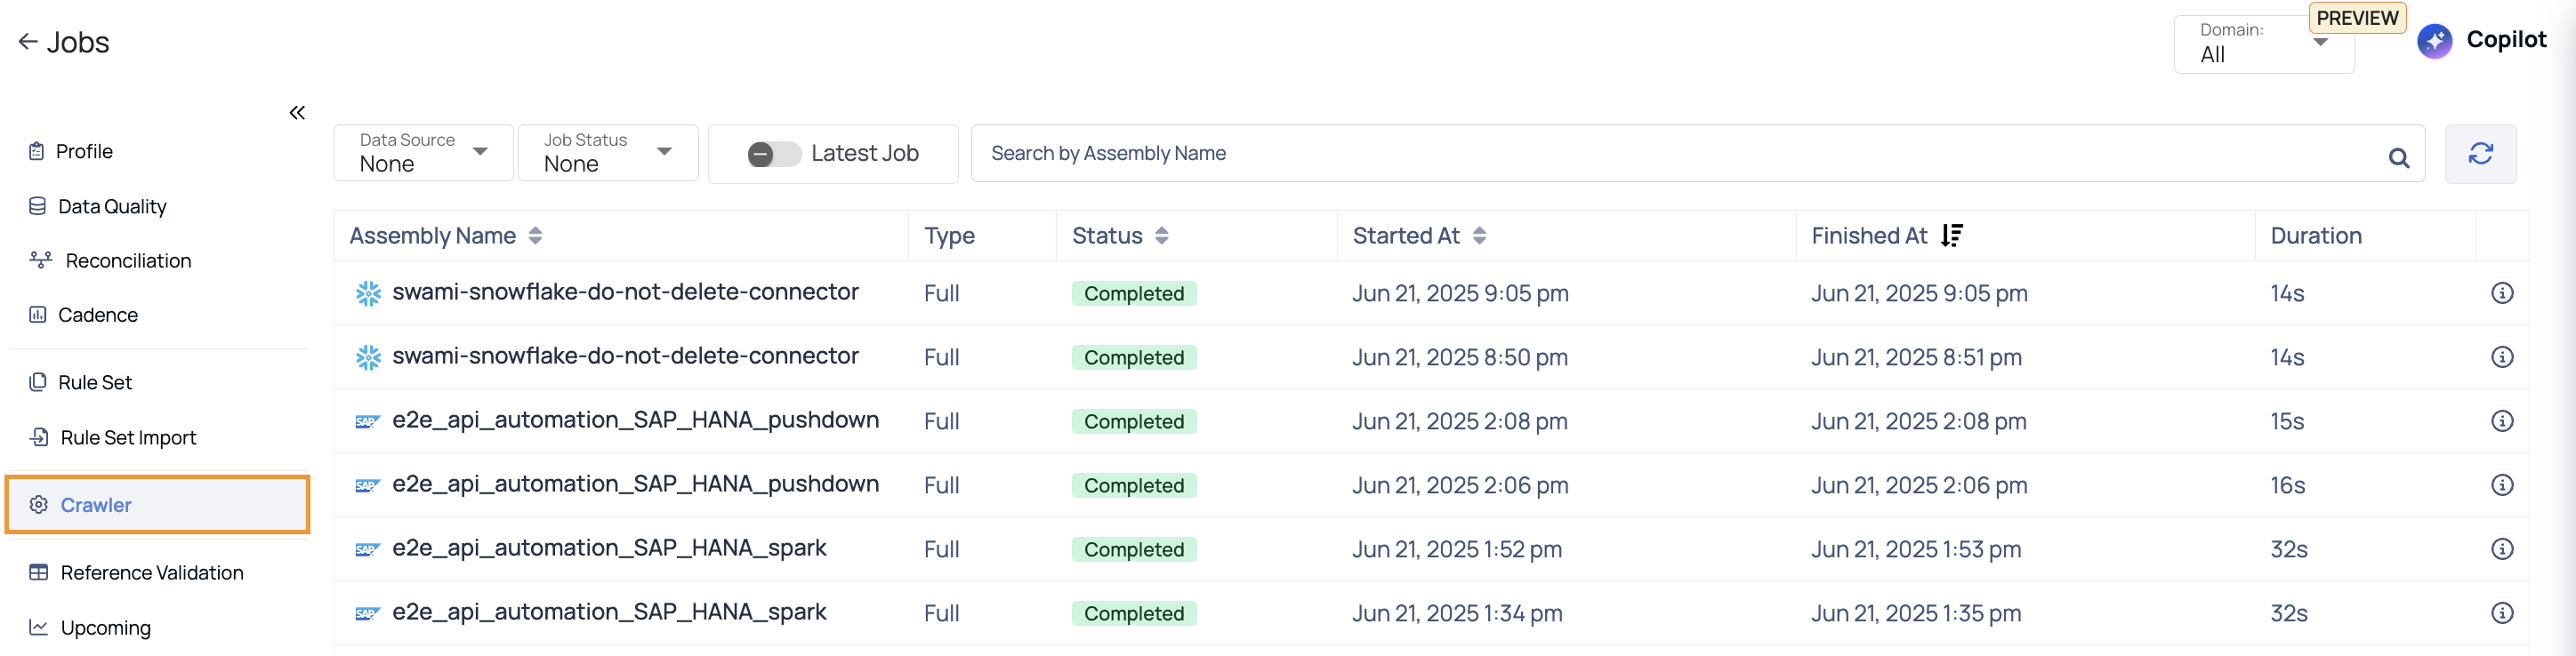
The Crawler Jobs tab provides a detailed view of all crawler executions that have been triggered across data sources. It allows you to monitor the status, duration, and key attributes of each crawler run. This helps track data asset discovery, schema extraction, and metadata collection activities within the platform.
| Column Name | Description |
|---|---|
| Assembly Name | The name of the crawler job or task being executed. |
| Type | Indicates the type of execution (e.g., Full or Selective). |
| Status | Current execution status of the crawler job (e.g., Completed, Running, Failed). |
| Started At | Timestamp when the crawler job started. |
| Finished At | Timestamp when the crawler job finished. |
| Duration | Total time taken for the execution to complete, typically shown in seconds. |
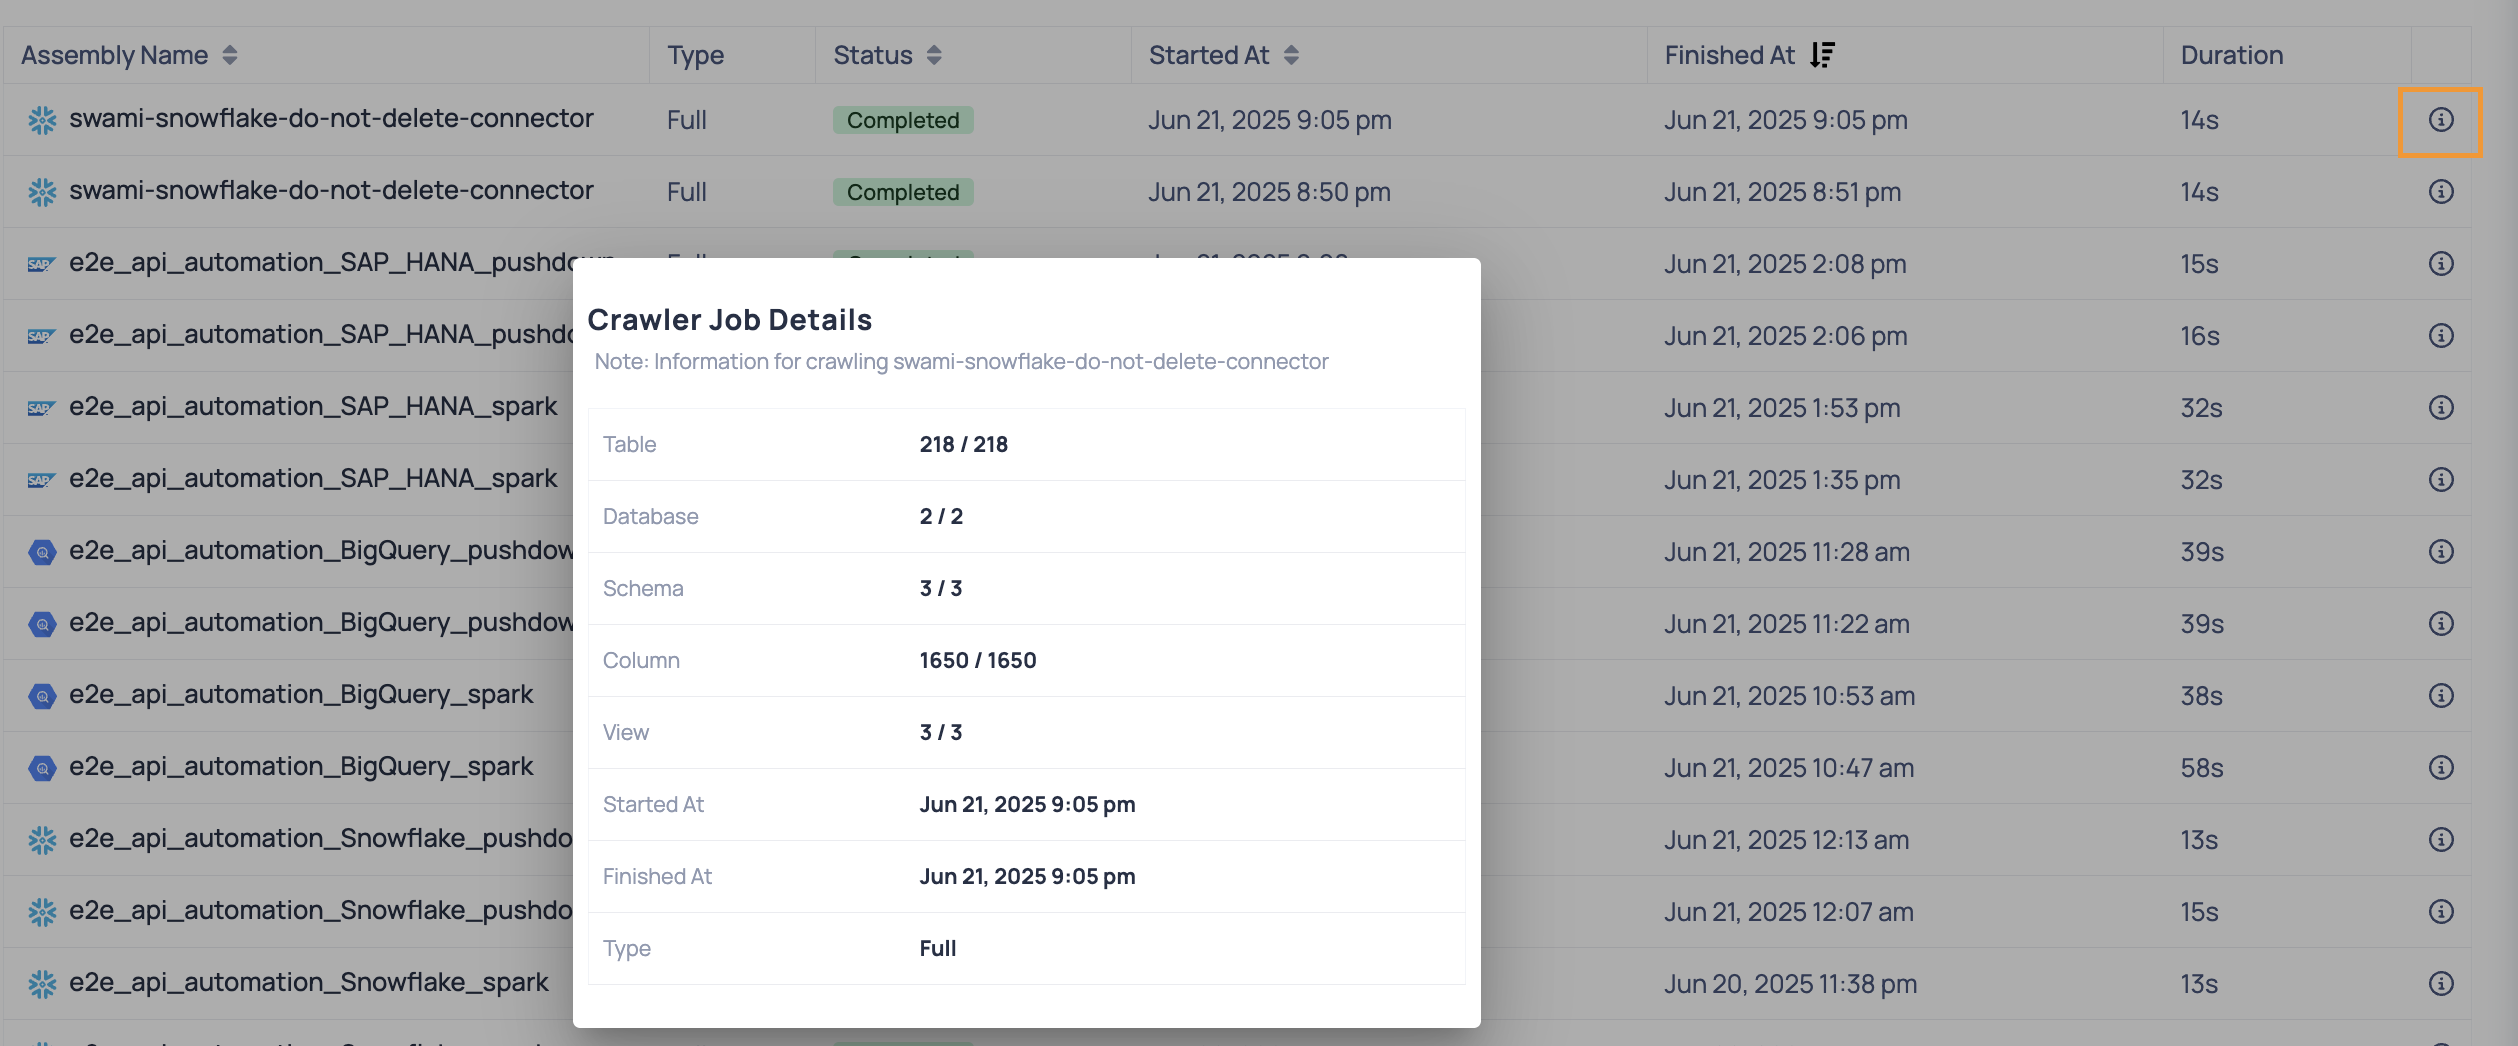
Viewing Crawler Job Details
Each crawler job listed on the Jobs > Crawler tab displays summary information such as the job type, status, start time, end time, and duration. For a deeper view into what was discovered during a particular crawler run, click the
Clicking the info icon opens a popup showing detailed statistics about the crawler job. This includes the number of discovered entities (such as tables, columns, views), timestamps, and type of crawl executed.
| Field | Description |
|---|---|
| Table | Total number of tables crawled. The format X / Y shows how many tables were successfully crawled out of the expected total. |
| Database | Number of databases the crawler accessed during the run. |
| Schema | Number of schemas discovered within the databases. |
| Column | Total number of columns processed across all tables. |
| View | Number of views discovered by the crawler. |
| Started At | Timestamp indicating when the crawler job started. |
| Finished At | Timestamp indicating when the crawler job completed. |
| Type | Indicates whether the job was a Full crawl (scans the entire data source) or Selective (scans only specific schemas, databases, or tables that were manually selected, rather than crawling the entire data source). |