
Apache Pinot Batch Data Example With Superset
This page covers ingesting batch data into Pinot and querying it from Superset.
Assumption: Apache Pinot and Superset are already installed and running.
Set up: Define Host Variable
Step 1: Ingest Batch Data into Pinot
Choose an Example Dataset
Pinot includes several example datasets in examples/batch/:
Dataset | Description |
|---|---|
airlineStats | Flight statistics data |
baseballStats | Baseball player statistics |
billing | Billing records |
starbucksStores | Starbucks store locations |
githubEvents | GitHub event data |
Create Schema and Table
Verify:
If AddTable fails or tables list is empty, use curl instead:
Ingest Data
Update the default ingestion job file to use your hostname (creates .bak backup):
Run the ingestion:
To restore the original file: mv examples/batch/airlineStats/ingestionJobSpec.yaml.bak examples/batch/airlineStats/ingestionJobSpec.yaml
Verify Data
Results
Step 2: Connect Superset to Pinot
Add Database Connection
In Superset, go to Settings → Database Connections
Click + Database
Select Apache Pinot (or "Other")
Enter the SQLAlchemy URI:
Format:
Example:
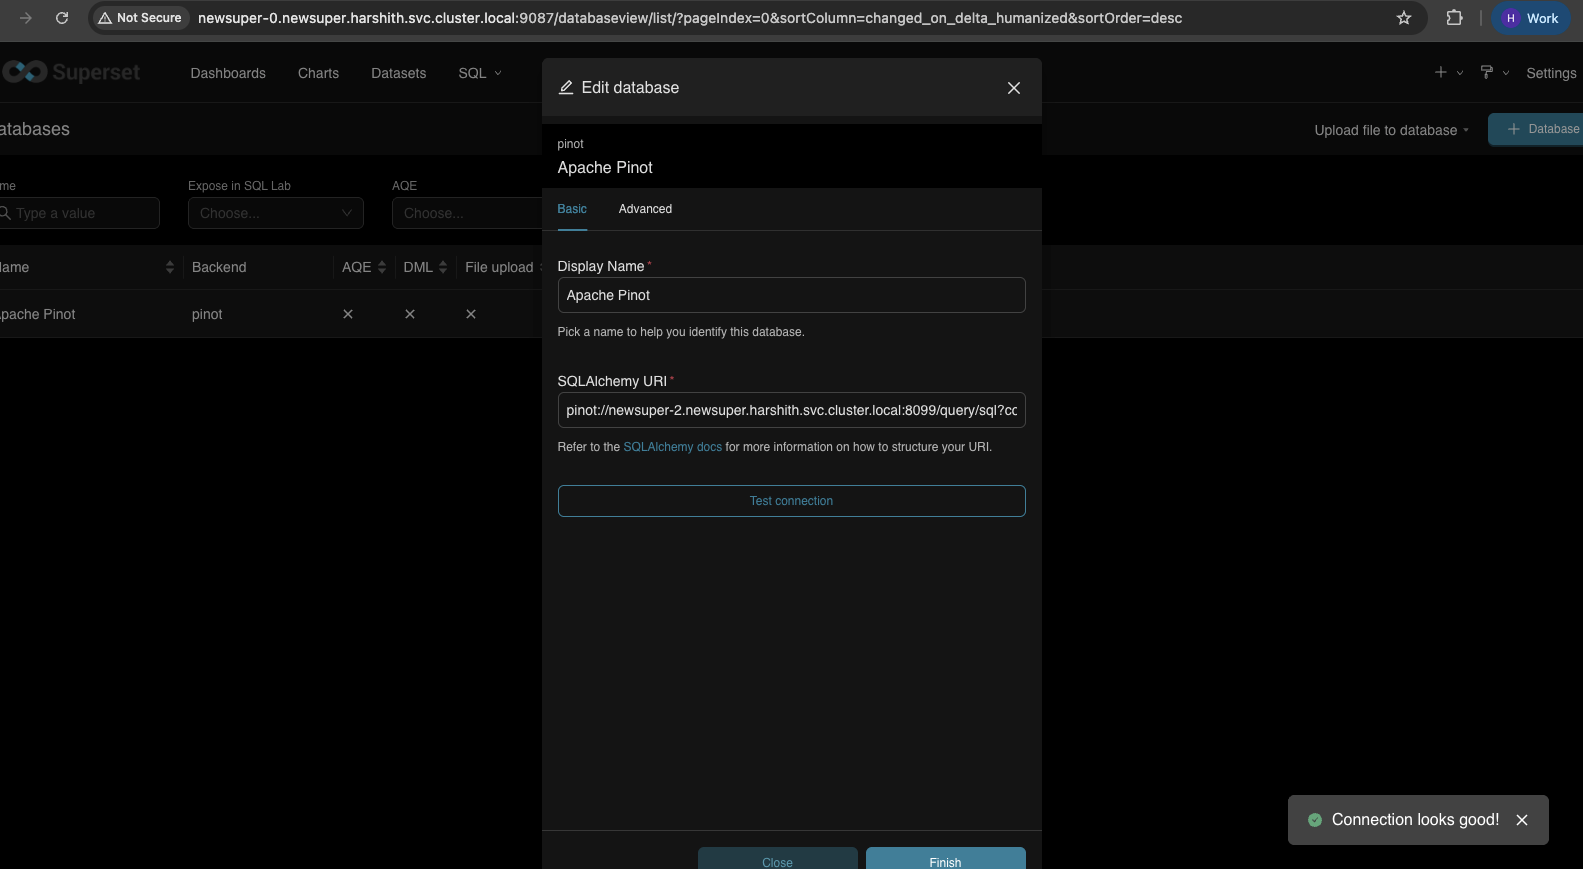
Click Test Connection → Connect
Create Dataset
Go to Datasets → + Dataset
Select your Pinot database
Select schema:
defaultSelect table:
airlineStatsClick Create Dataset and Create Chart
Step 3: Query in Superset
SQL Lab Queries
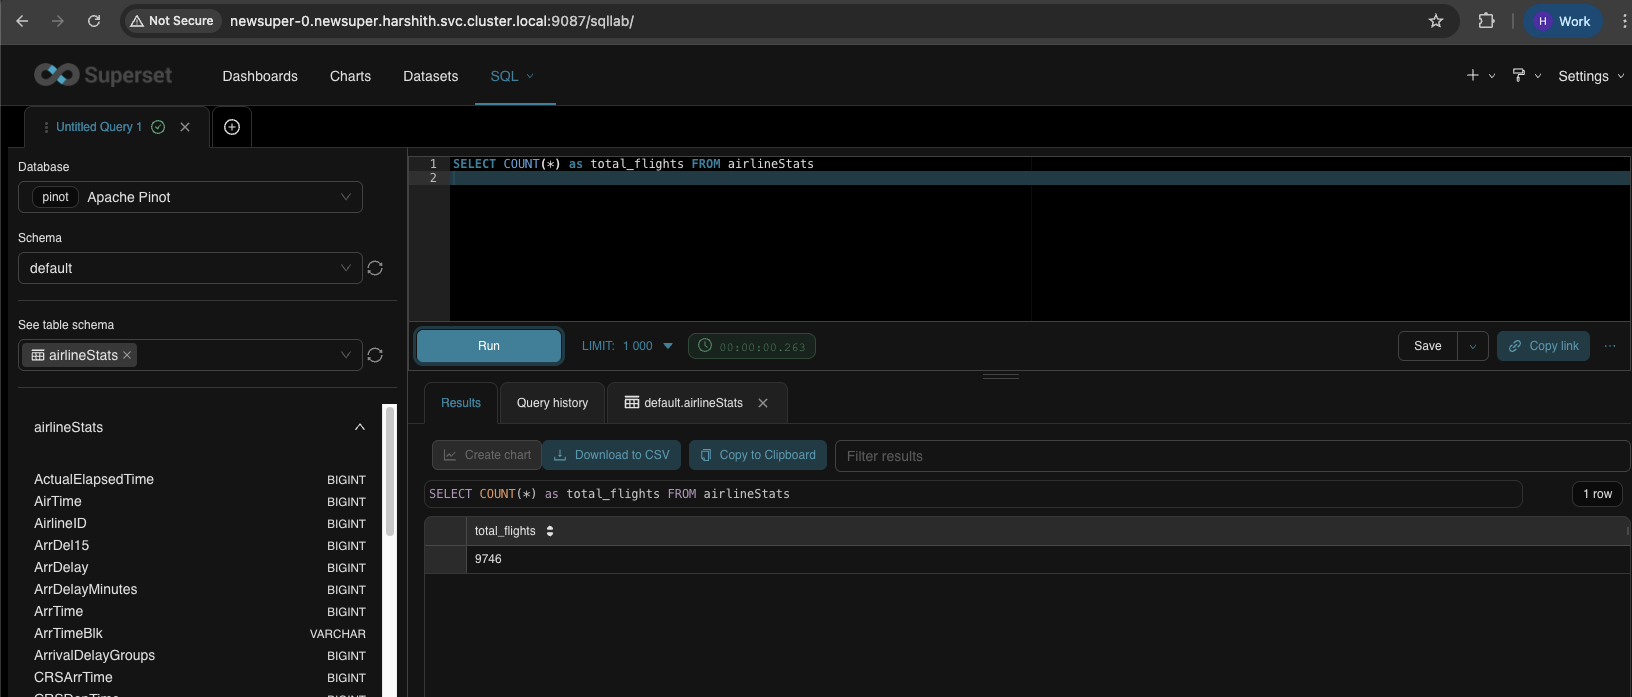
Go to SQL Lab → SQL Editor:
Row count:
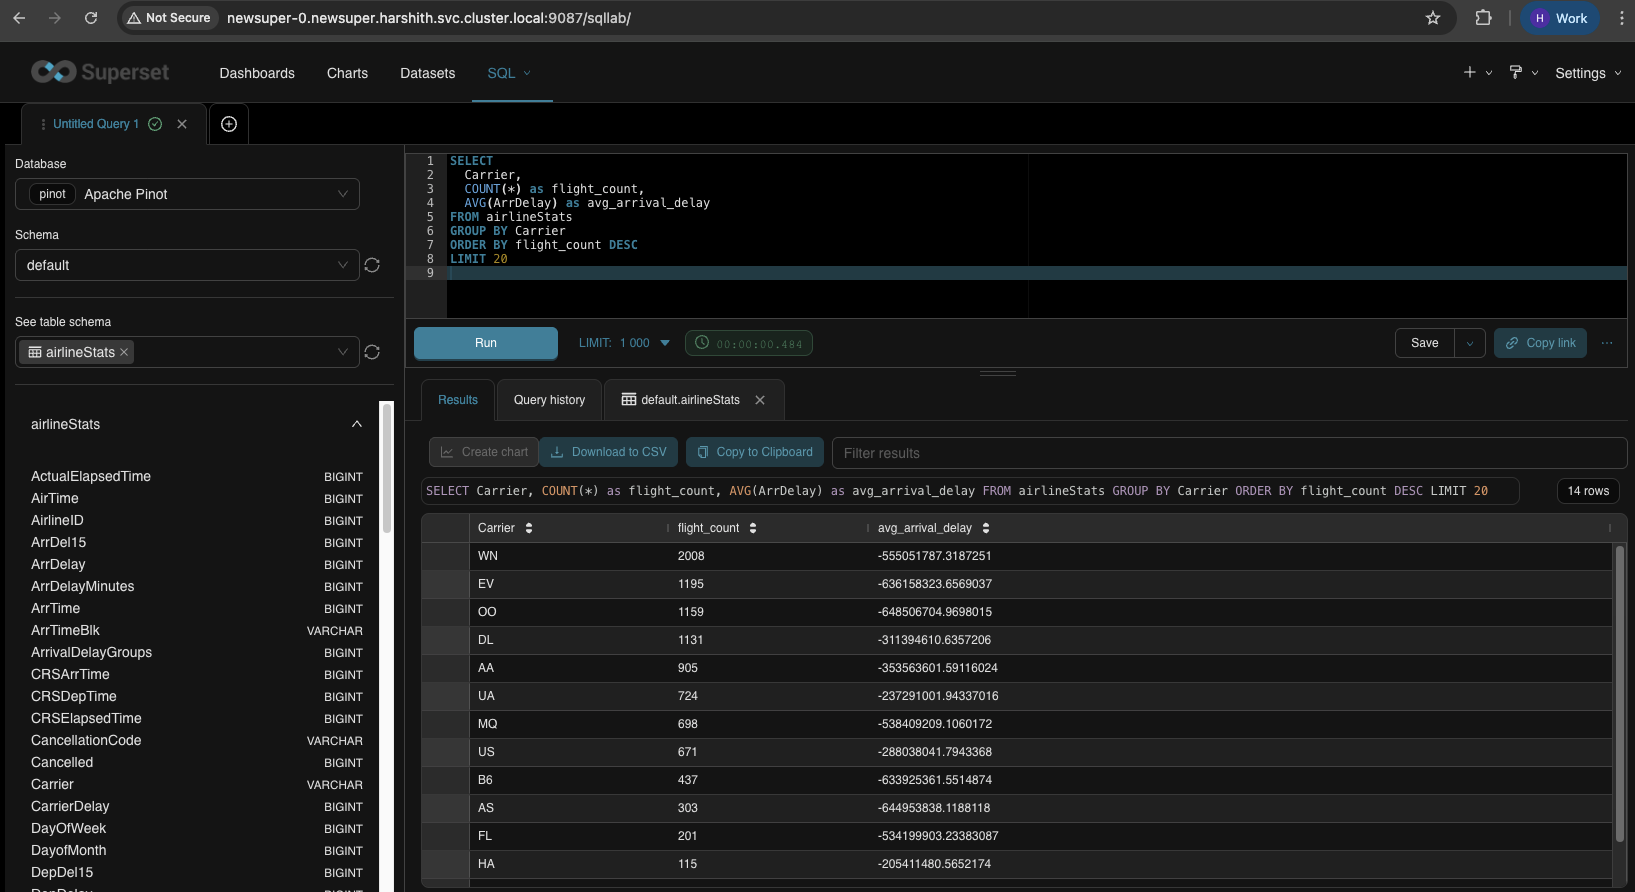
Flights by carrier:
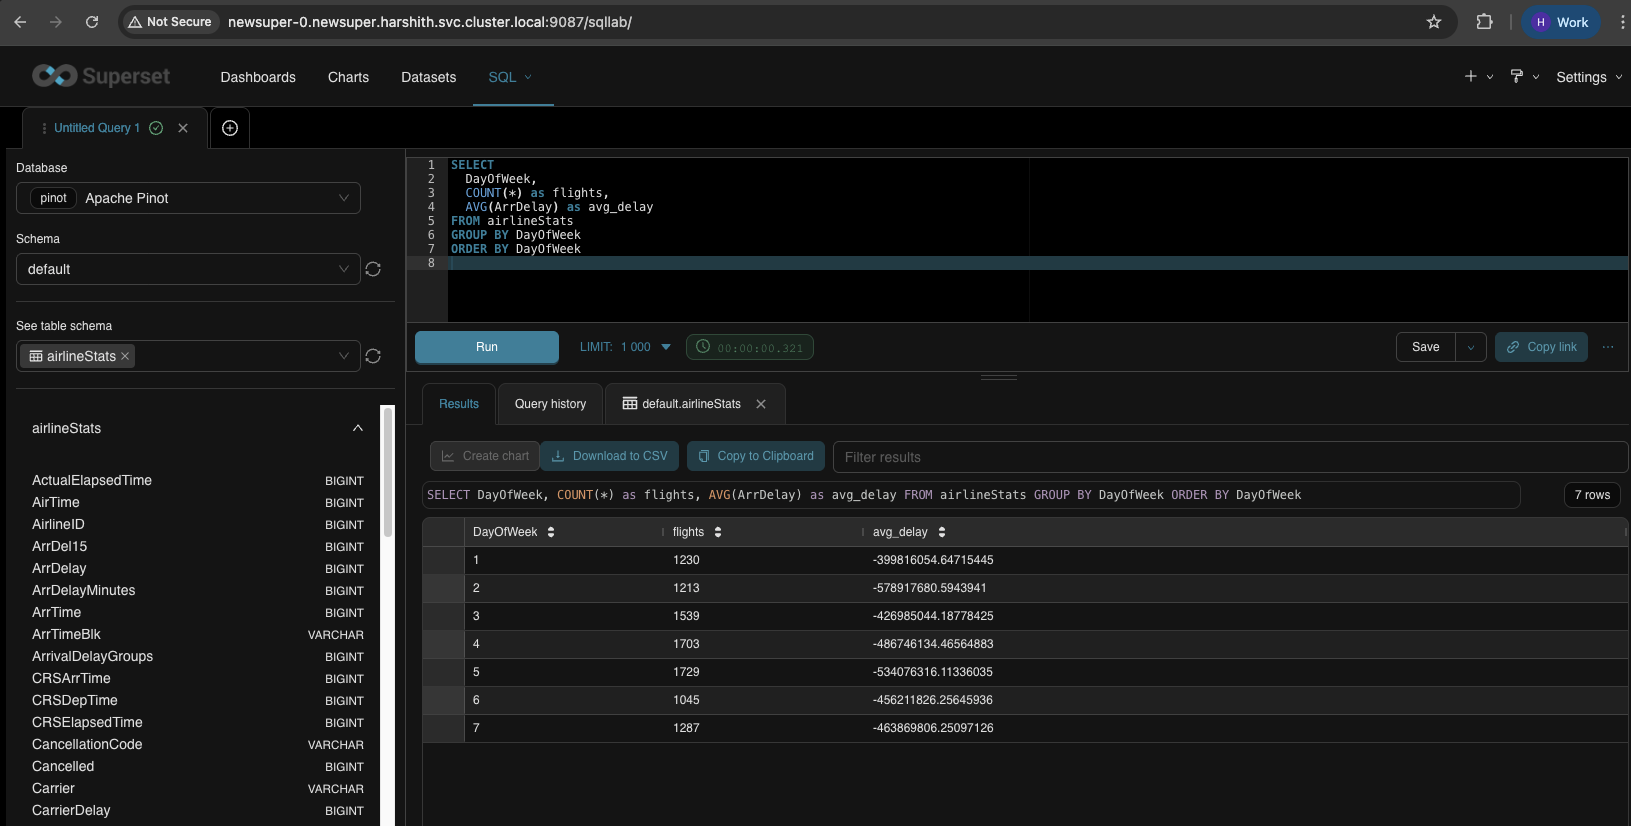
Delays by day of week:
Top routes:
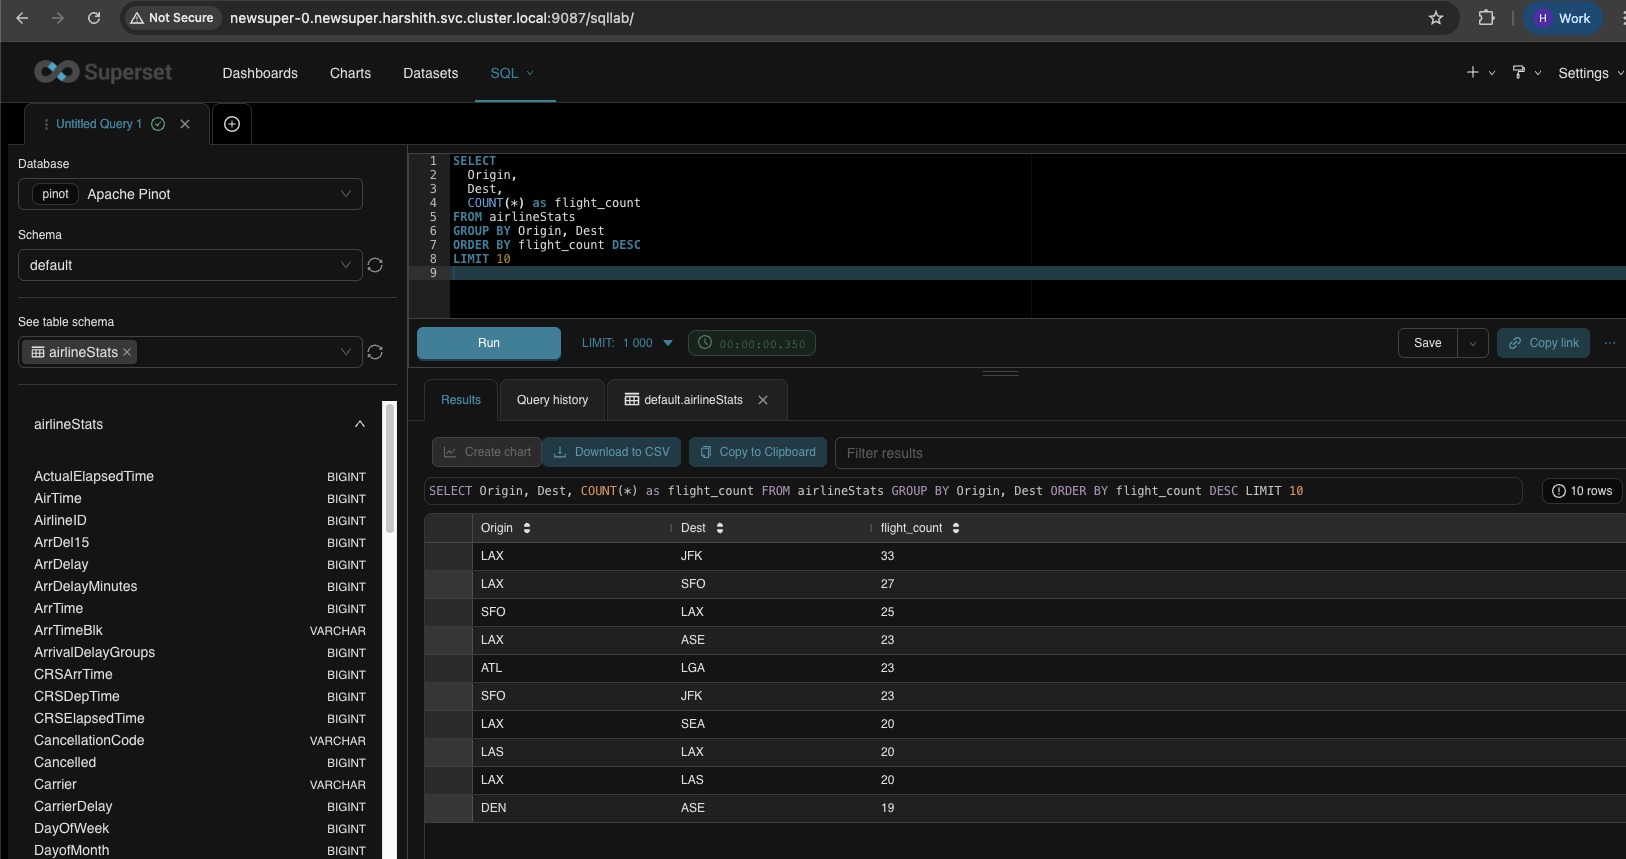
Create Charts
To create a chart: Datasets → click on airlineStats → Create Chart → select chart type.
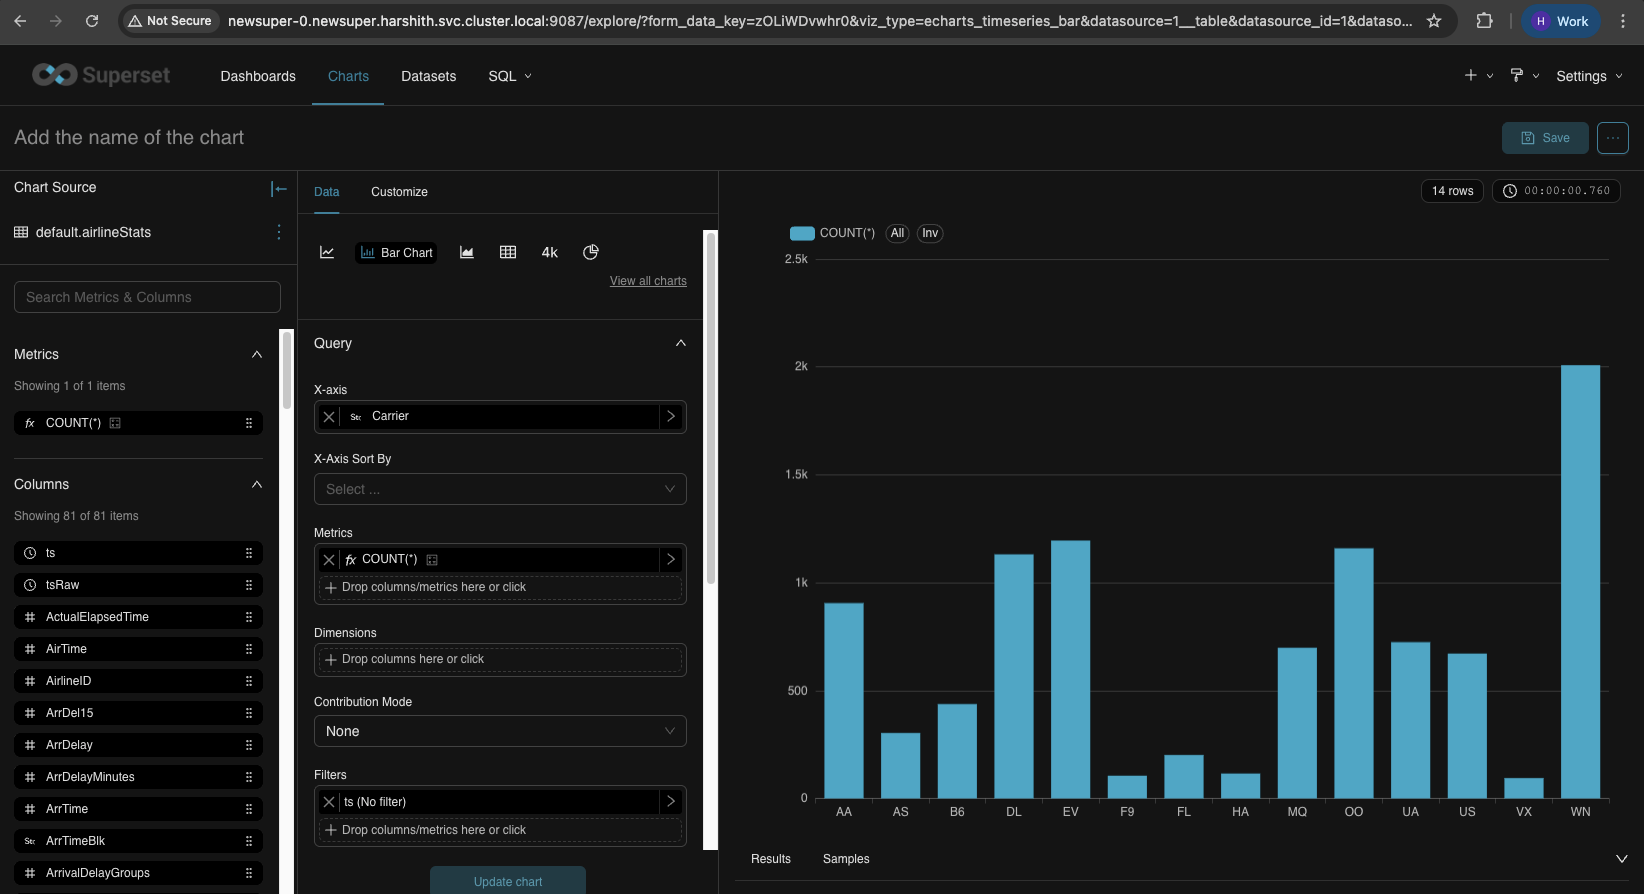
Bar Chart - Flights by Carrier
Field | Value | Description |
|---|---|---|
X-Axis | Carrier | Airline carrier codes (AA, UA, DL, etc.) shown on the horizontal axis |
Metrics | COUNT(*) | Number of flights (bar height) |
Dimensions | (leave empty) | Not needed for a simple bar chart |
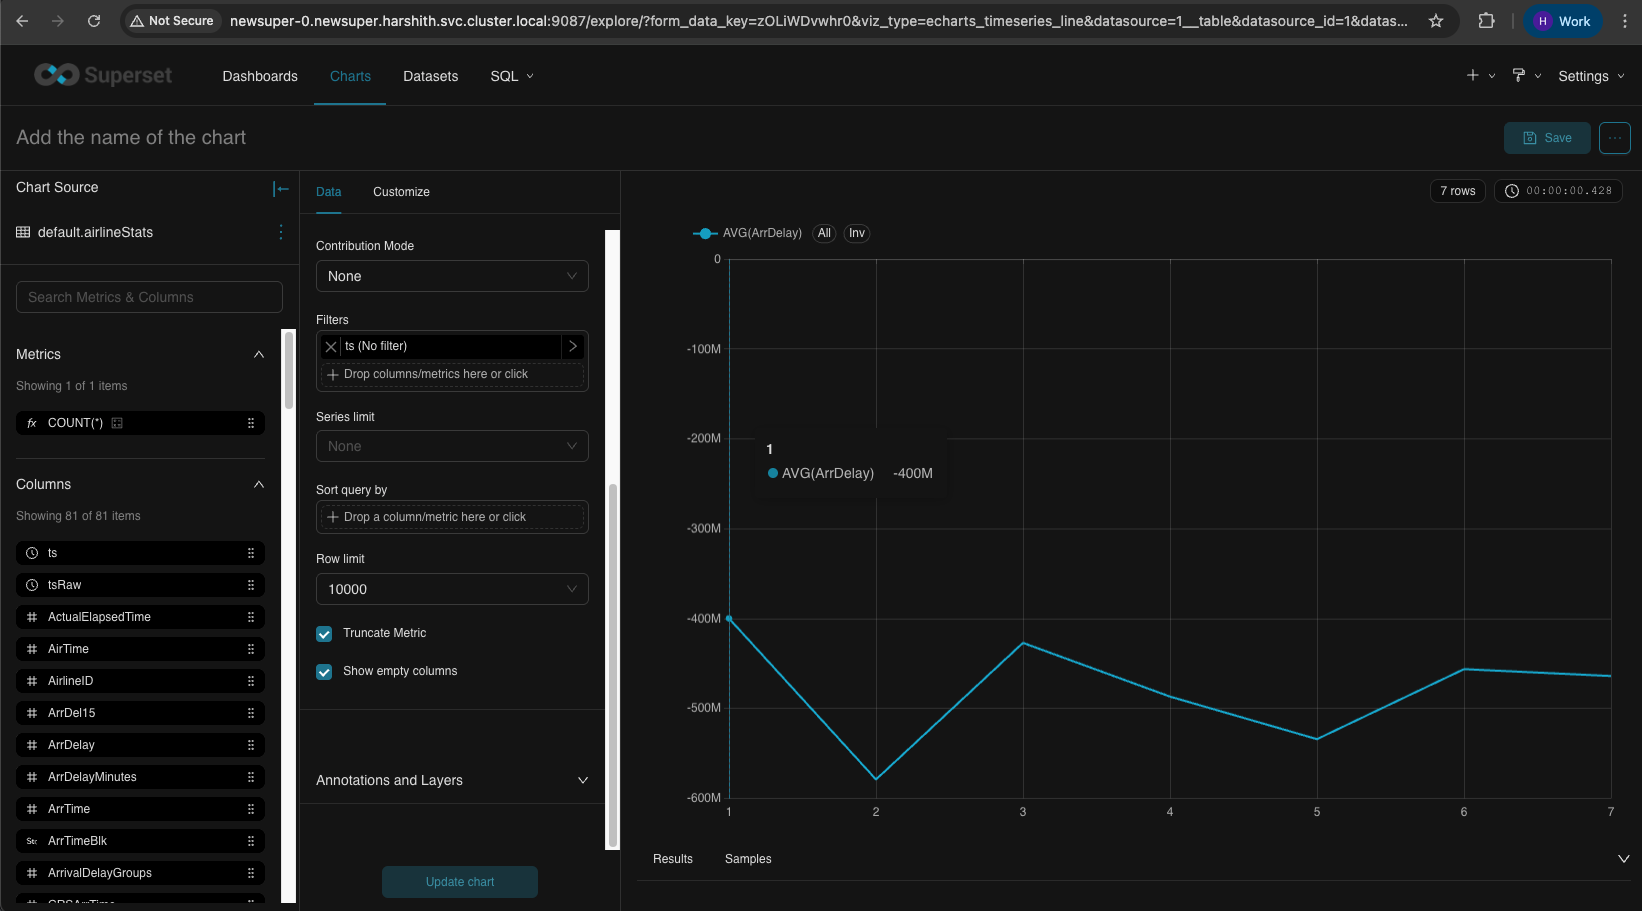
Line Chart - Average Delay by Day of Week
Field | Value | Description |
|---|---|---|
X-Axis | DayOfWeek | Day of week (1-7) shown on horizontal axis |
Metrics | AVG(ArrDelay) | Average arrival delay in minutes (line value) |
Dimensions | (leave empty) | Not needed for single line |
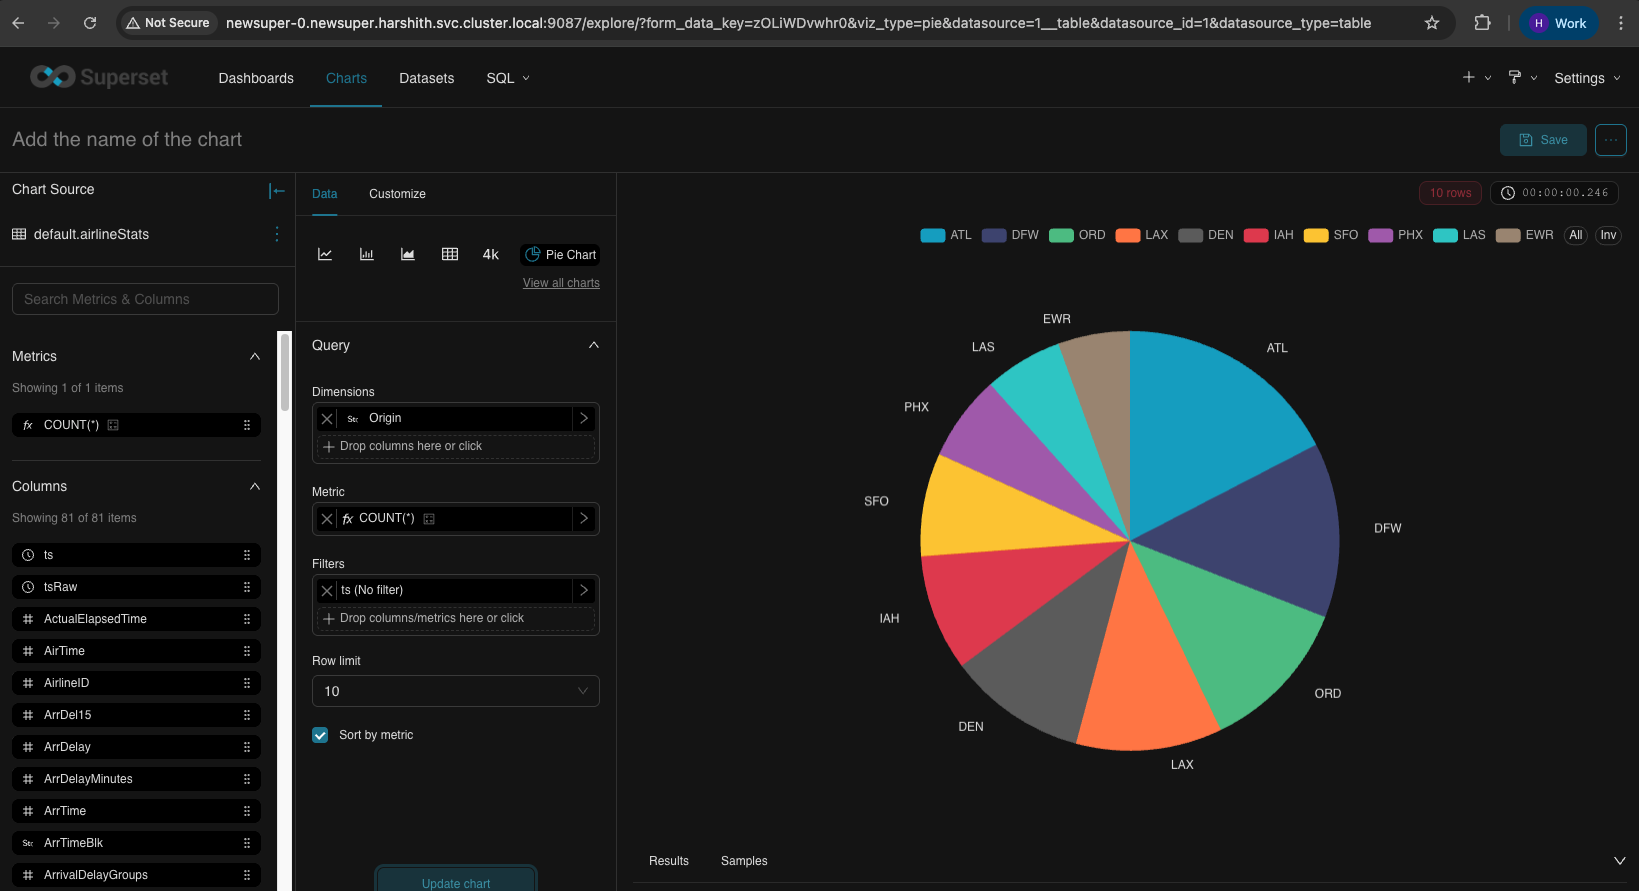
Pie Chart - Flights by Origin Airport
Field | Value | Description |
|---|---|---|
X-Axis | (not used) | Pie charts don't use X-axis |
Metrics | COUNT(*) | Number of flights (slice size) |
Dimensions | Origin | Airport codes - each slice represents an origin airport |
Row Limit | 10 | Show top 10 airports only |
Don't put the same column in both X-Axis and Dimensions - this causes a "Duplicate column/metric labels" error.
Create DashBoards
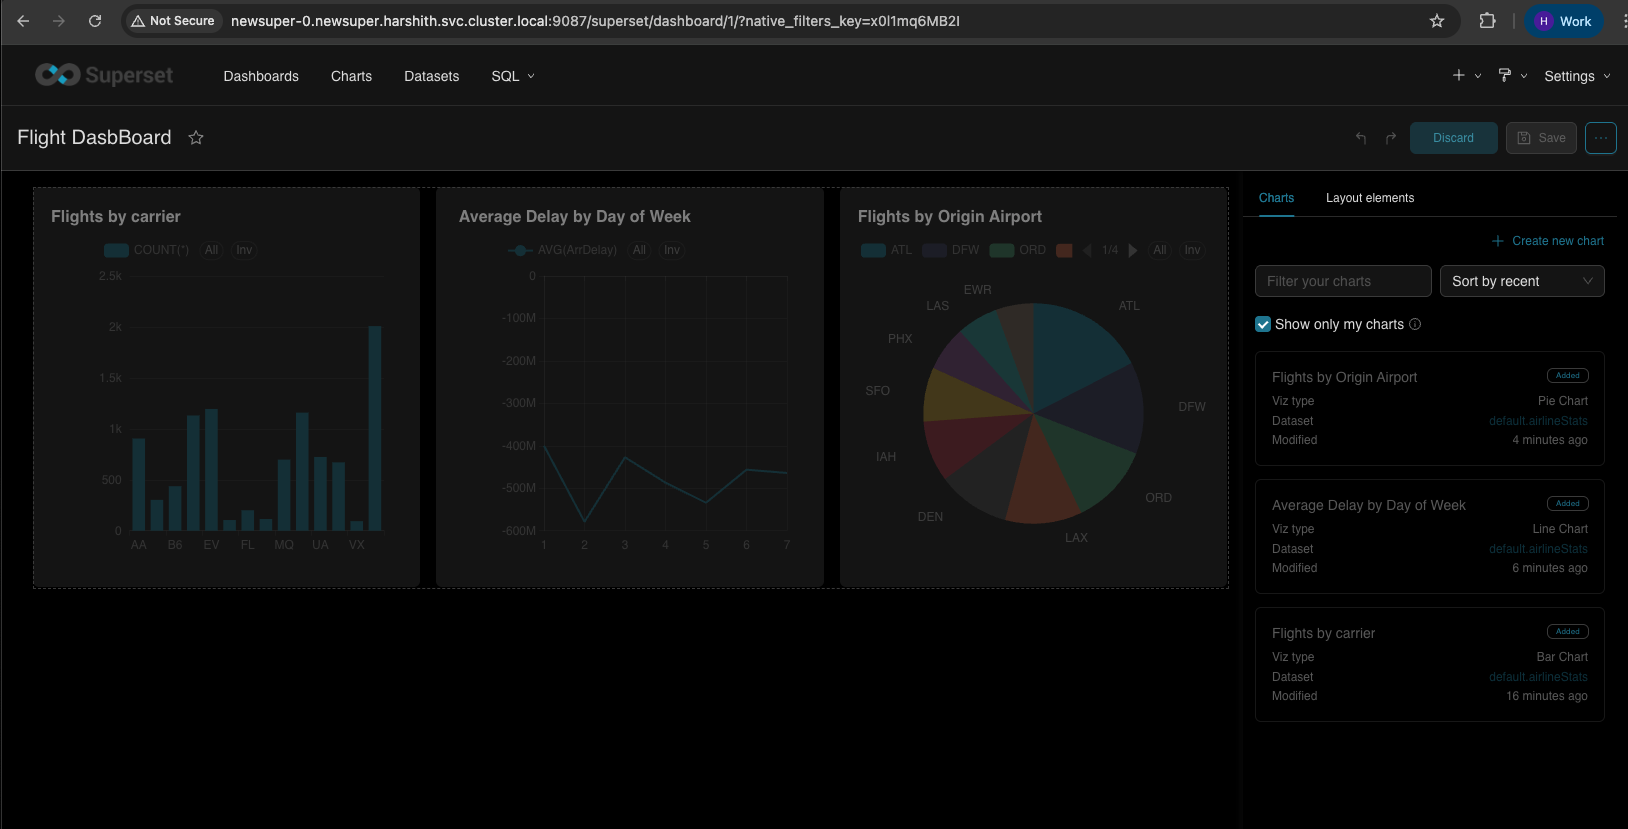
Hit Dashboards on the top bar and create a new dashboard, import charts (which we just created ) as shown by drag and drop, give it a name on the top left, and save.
Optionally, you can publish a chart
appears in the Charts list
can be added to dashboards
can be shared with others
persists in Superset DB
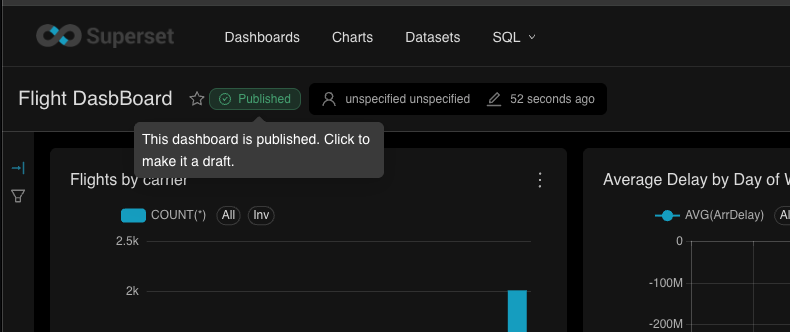
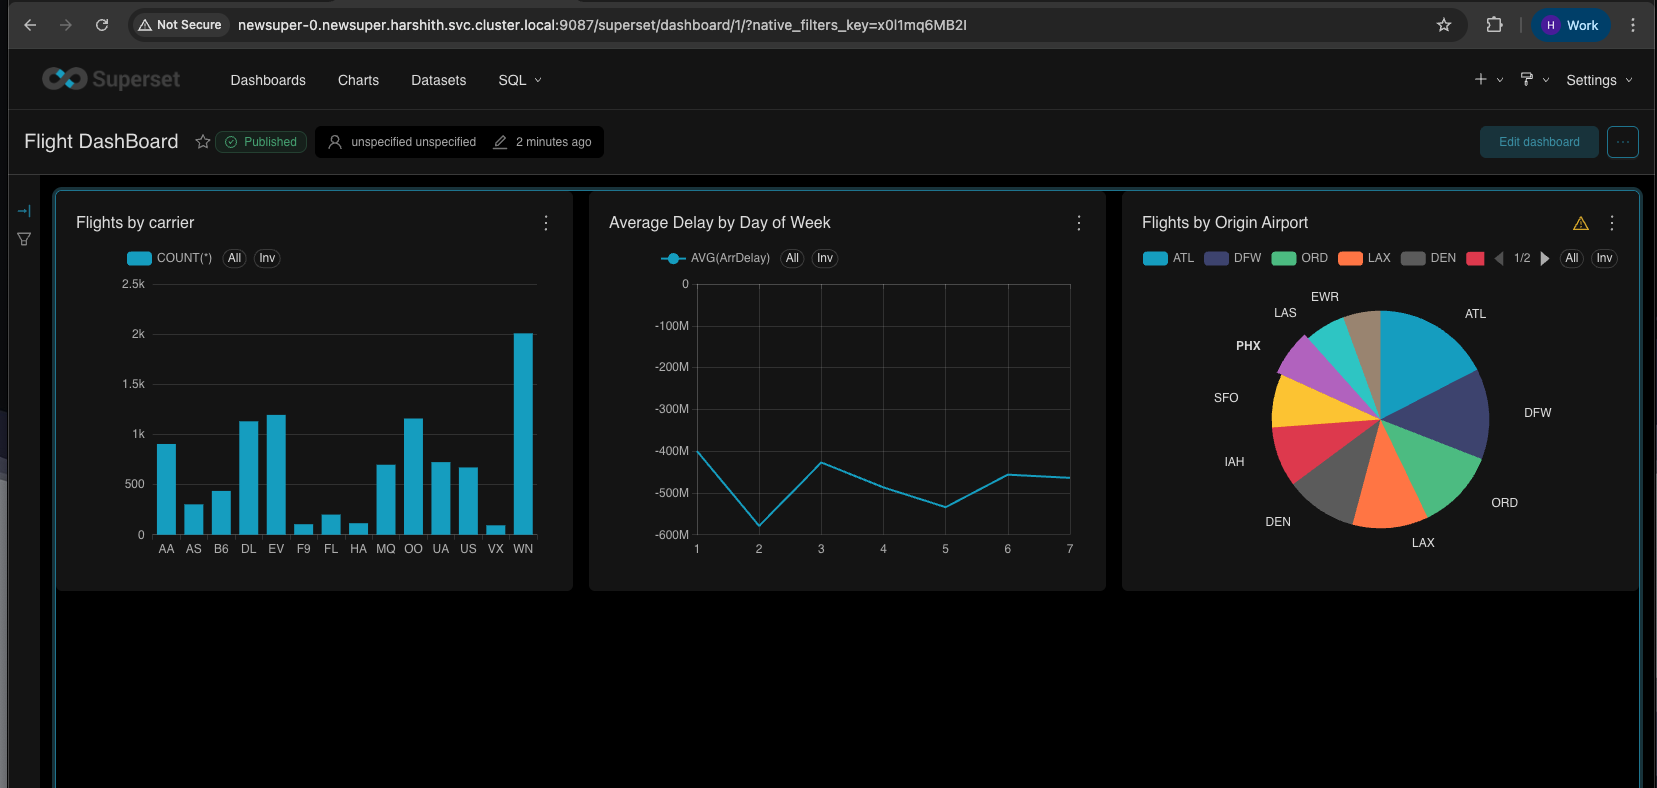
You can download dashboards or individual charts by clicking the 3-dot menu on the top right.
Quick Reference
Connection String
Pinot SQL Notes
Supported:
SELECT,GROUP BY,ORDER BY,LIMIT, aggregationsNot supported:
JOIN, subqueries, window functions