Analyzing the Application Logs
The Application tab enables you to search for application logs in your cluster. The Application logs can be used to debug applications that might not work as expected. The log files contain events that occur during the application run.
For the comprehensive analysis of logs, choose one of the ways to access the Logs page:
- Log in to the Pulse UI > Home > click on Logs Summary.
- Log in to The Pulse UI > select Logs on the left-side navigation bar.
On the Logs page, by default, the application logs appear on the screen. However, you can switch between different tabs to access Application, HDFS, and Ranger logs.
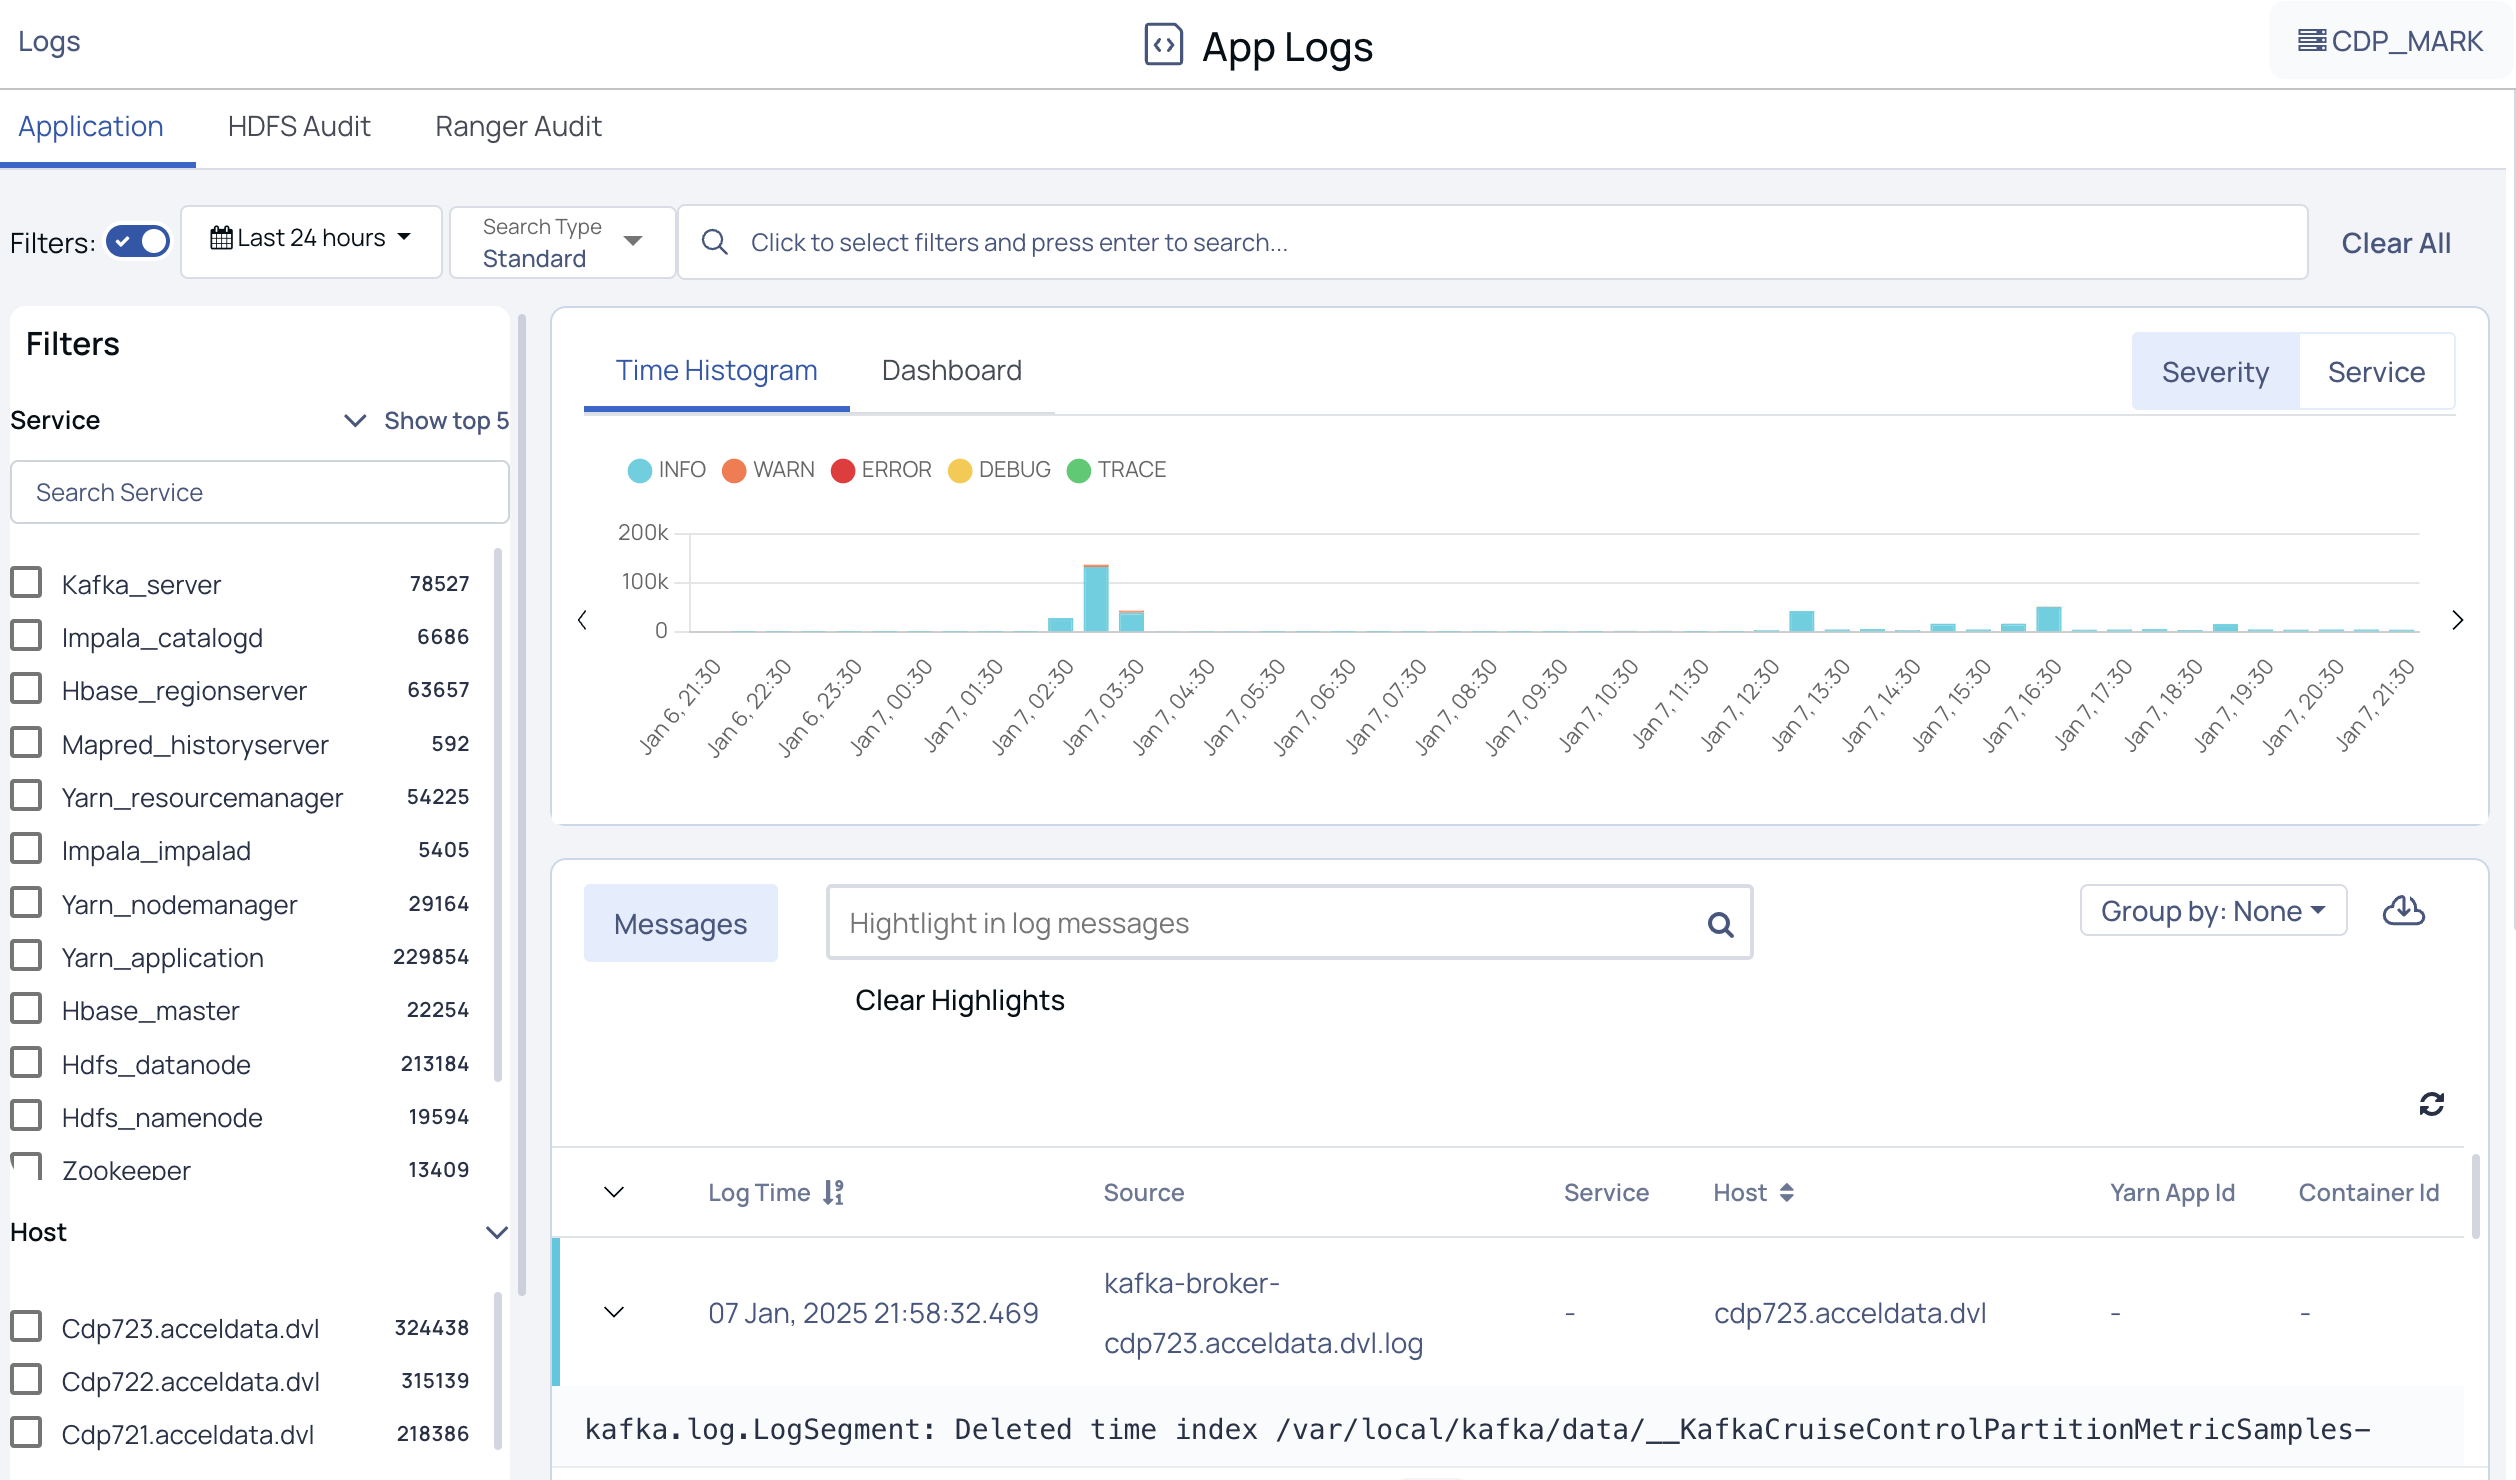
Pulse provides the following functionalities to search and filter the logs displayed.
| Functionality | Description |
|---|---|
| Filters | Turn on the Filters functionality to filter the logs based on the service, host, and log level. |
| Timestamp | Choose an option to select a time period (For example, Today, Last 12 hours, Last 3 Months, etc.) or choose a “custom date and time” and click Apply. |
| Search Type | Select the Search type:
|
| Search Logs | If you select the search type as Standard, the following filters are available to search for logs.
In case you select Elastic QS, you need to create a query using keywords like Source, Host, Log Level, Yarn App ID, Container ID, Log Level, Message, and Service, etc. along with operators and corresponding details. For more details, see Query Examples. |
Searching the Application Logs
You can search for logs of applications and associated services installed in your cluster. These logs are displayed within the timeline you select.
- On the Application Logs tab, select the Time period and Search Type. Select one of the following search types to search for logs:
- Standard Search: Select filters like Source, Host, Log Level, Yarn App ID, Container ID, Log Level, Message, and Service, add an operator, and enter filter details to search logs.
- Elastic QS Search: Create a query using keywords like Source, Host, Log Level, Yarn App ID, Container ID, Log Level, Message, and Service, etc. along with operators and corresponding details. For more details, see Query Examples.
The query string accepts only boolean operators.
- Click Enter.
The Logs are displayed for the query you have created within the timeline selected.
Filtering the Application Logs
You can filter the logs of applications and associated services installed in your cluster. These logs are displayed within the timeline you select.
- On the Application Logs tab, turn on the filter option (if turned off), and select the time period.
- On the left panel under Filters, you can apply the following filters for searching logs.
- Service: Search and select the service to filter logs. These services display the time stamp at which the associated logs were last captured at.
- Host: Select a host from the list. Displays the list of logs of applications running on the host.
- Log level: Select a Log level. Displays the list of logs that belong to the log level selected.
You can select multiple filters at a time to filter the logs.
The histogram, dashboard, and message details get updated automatically upon selecting a service, host, or log-level details.
On Histogram, you can filter the logs by selecting Severity or Service.
The Logs are displayed for the filter and time period you have selected.
Visual Log Insights
Time Histograms
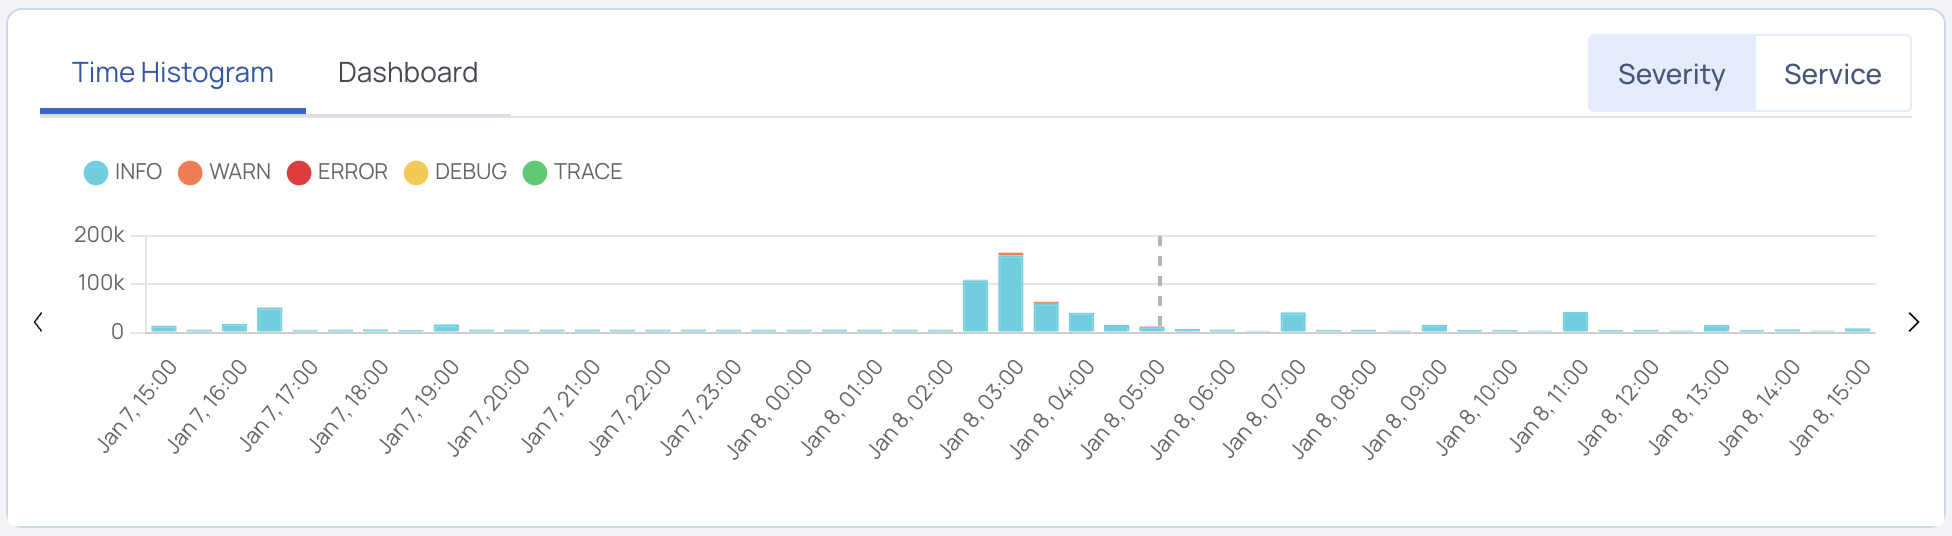
This panel displays the logs in the form of a histogram where you can see the number of records for a particular time frame. You can view the histogram by Severity and Service.
The Severity view displays the number of records of the following: Error, Info, Warn, Debug, Trace. The following image is an example of the Severity view.
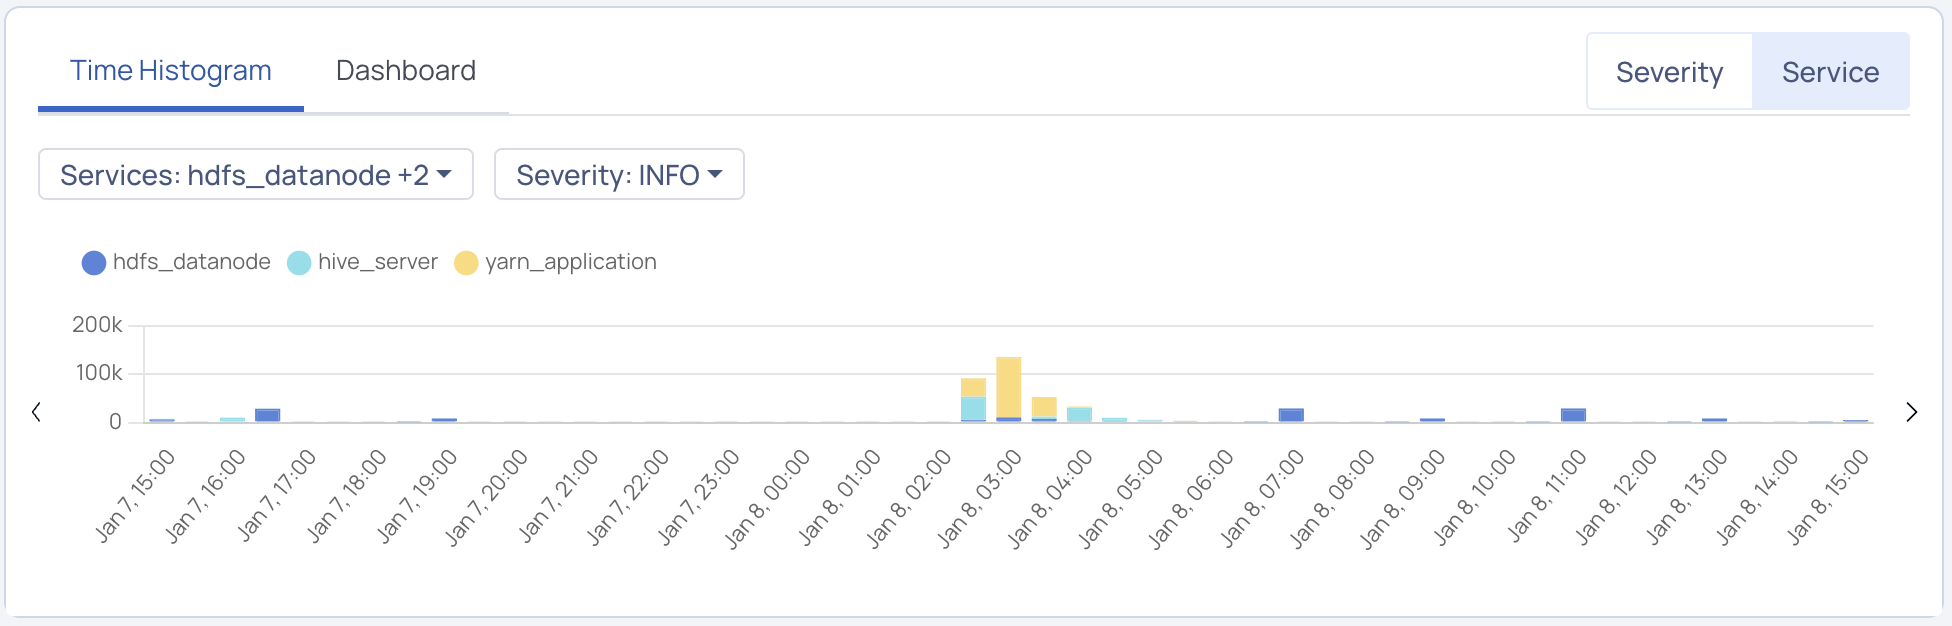
The Services view displays the number of records of services. You can add or remove a service from appearing in the histogram. Click the drop-down in the top left corner of the Time Histograms tile and select or deselect services. The following image is an example of the Services view.
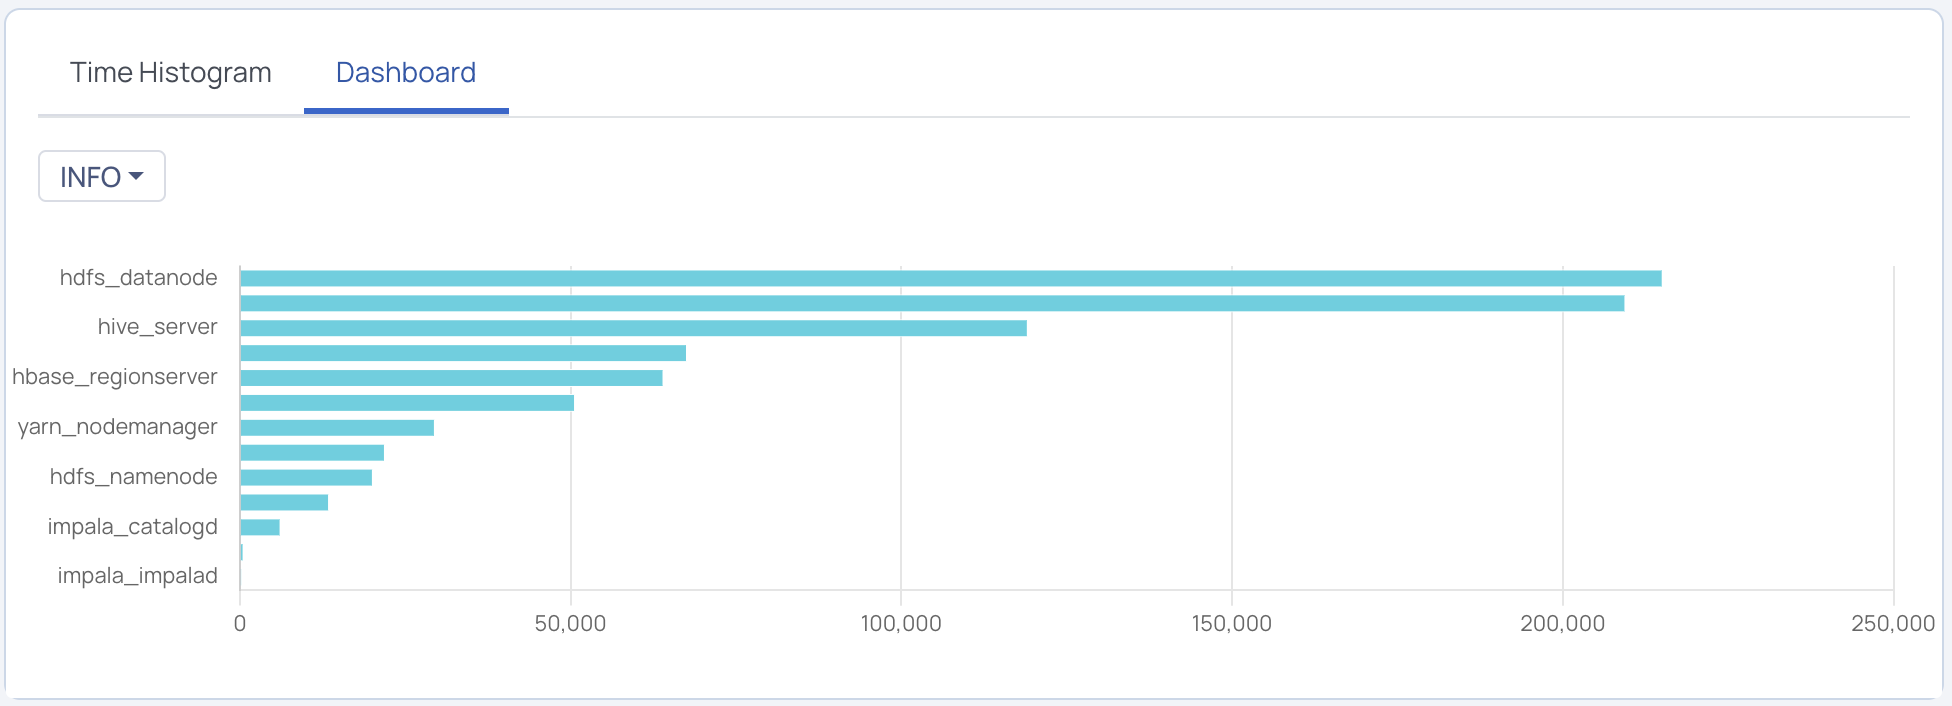
Dashboard
This panel displays the aggregated values of severity in services. Click the drop-down located in the top left of the Time Histograms tile and choose the severity level of the service whose aggregated value you want to view. The following image is an example of the Dashboard panel.
Detailed Log Messages
This panel displays details of the following tabs:
- Messages
- Searching highlights in log messages
Messages
| Field Name | Description |
|---|---|
| Message | The time at which the log was captured. |
| Log Time | The detailed message of the event that occurred in the application at a certain time. A Message displays values in the following format: (Message body) (Hostname) (source). Click the ... icon and click View in Context to view the [Log Context](Log Context) details of a particular log. To copy the message to the clipboard, click the icon next to the message. |
| Source | The origin or entity where the error or event was triggered. |
| Service | The specific service or application that encountered the error. |
| Host | The system where the service is running. |
| Yarn App ID | The identifier for the application in Hadoop YARN. |
Log Context
The Log Context window displays the following details:
- Message
- Timestamp
- Source file
- Host
- A table with up to ten logs from the same source before and after the selected log. A total of 20 logs are displayed. The selected log is highlighted.
By clicking on Lines and selecting the desired number of logs, you can change the number of logs displayed in the table.
To copy the message click the icon next to the message. The message is copied to the clipboard.
Features
Grouping Logs
You can group the logs by Trace, Severity, or Host. Click the Group By drop-down label in the top left corner of the log details panel and select grouping criteria.
Downloading Logs
To download the logs, click the icon in the top right corner of the table. The logs can be downloaded in the .xlsx or .logs format. Pulse allows you to specify the number of rows to download.