
Click HBase --> Tables in the side navigation bar to view all the HBase tables in a cluster. The Tables page is displayed.
The statistics displayed are from the last 24 hours by default. To view statistics from a custom date range, click the Time frame icon in the top-right corner of the page and select the required time frame and timezone.
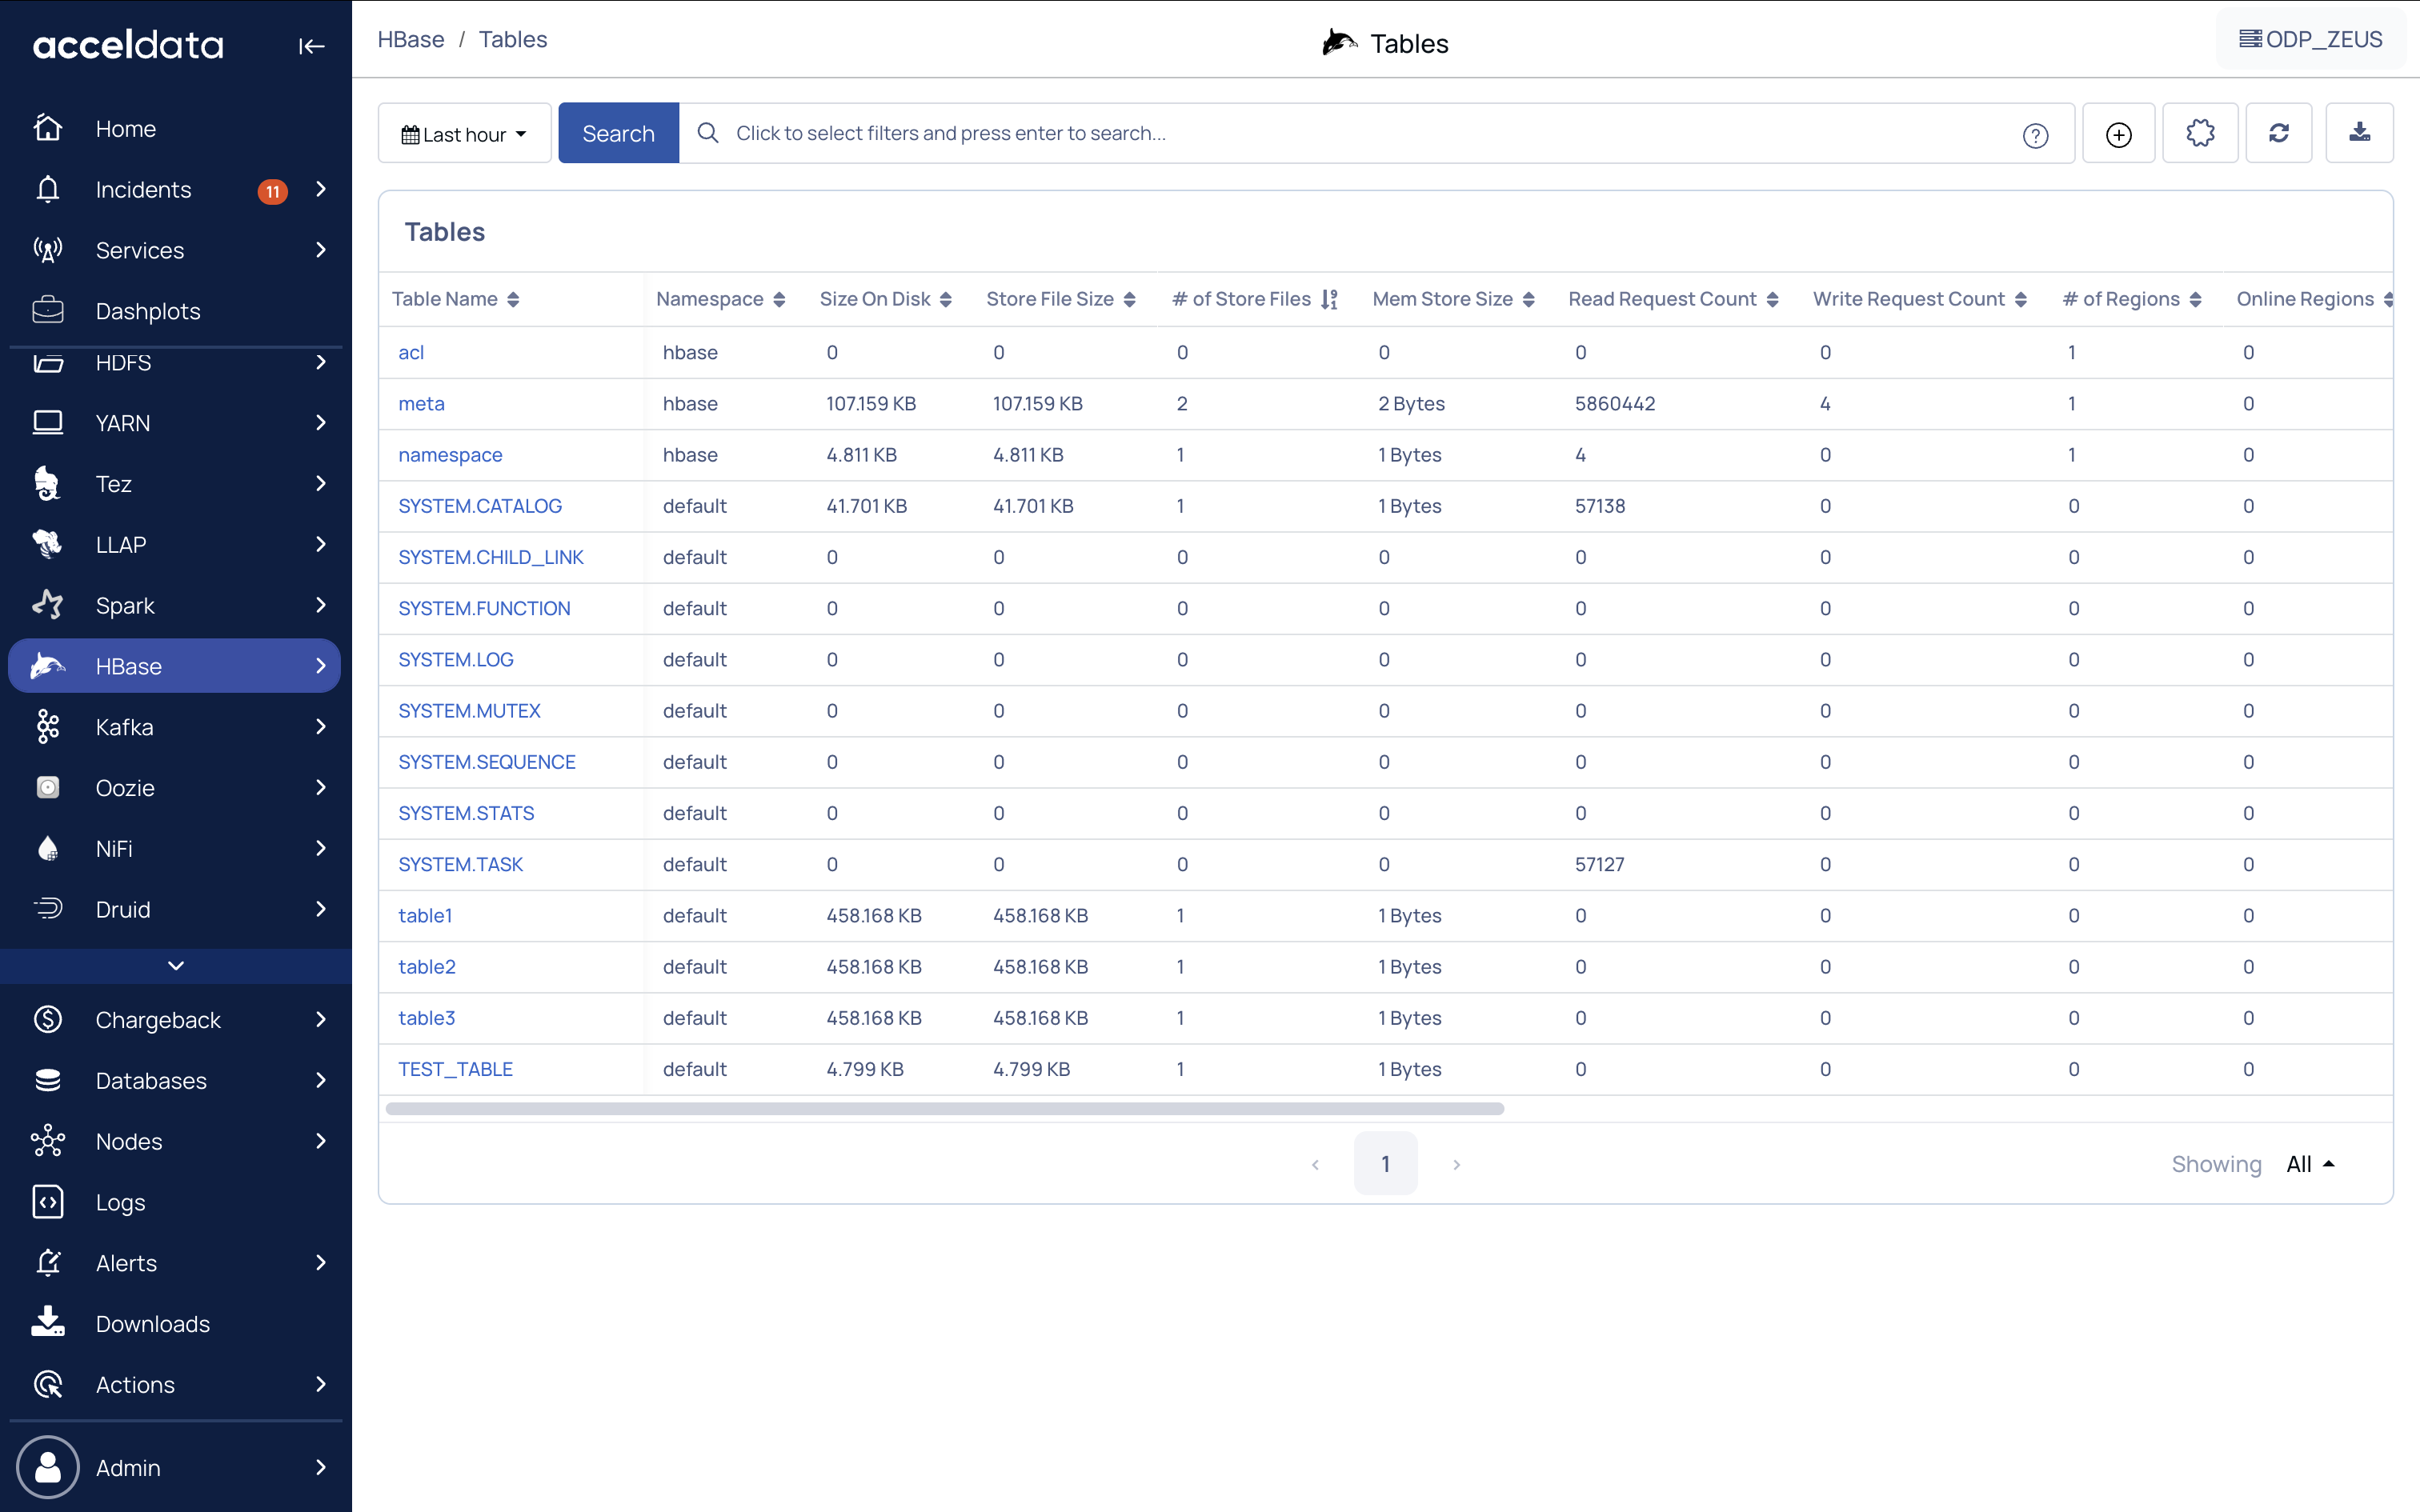
The following table describes the table properties:
Column Name | Description |
|---|---|
Table Name | The name of the table. |
Size on Disk | The size of the table on the disk. |
Store File Size | The size of store files in the table. |
# of Store File | The number of store files. |
Mem Store Size | The memStore is where the data is stored before being written on the actual disk. MemStoreSize is the size of the memStore. |
Read Request Count | The number of read request counts. |
Write Request Count | The number of write request counts. |
# of Regions | The number of regions in the table. |
Online Regions | The number of regions in online state. |
Offline Regions | The number of regions in offline state. |
Failed Regions | The number of regions in failed state. |
Split Regions | The number of regions in split state. |
Filtering
You can apply filter to the name of the table. To apply filter, perform the following:
Click Table Name. A drop-down list is displayed with the list of the table names.
Select the table name. You can select one or more table names from the list. The table displays the details for the selected name.
(Optional) You can search the name of the table using the search box in the drop-down list.
(Optional) Select All to clear the applied filter. (or) Click Reset to clear the applied filter.
Search Option
Perform the following steps to search for a record in the search bar.
Select a search parameter. Pulse provides you multiple search parameters.
Select a suitable operator for your parameter.
Enter the search term and hit the Enter key.