
Click Impala → Queries to view the list of queries. By default, queries that completed execution over the past 24 hours are displayed.
There are two ways to view the metrics. By default, the metrics are shown in the Group By view. However, you can choose to group them by User or Resource Pool.
Default View
The following table displays the default view of the query metrics with detailed information.
Metrics | Description |
|---|---|
Query ID | The ID of the query |
Database | The name of the database |
Resource Pool | The name of the resource pool |
Duration | The duration taken to run the query |
Variance | The difference between the actual and the estimated duration |
State | The state of the query |
User | The name of the user who initiated the query |
Query Type | The type of the query |
Coordinator | The caches metadata for all table partitions and data files |
#Row | The number of rows in the query |
Thread CPU Time | The sum of the CPU time used by all threads of the query. |
Per Node Peak Memory Usage | The peak memory usage per node. |
HDFS Aggr Read Memory | The sum of HDFS bytes read from memory by the query. |
Start Time | The Query start time |
Completion Time | The query completion time |
Statistics Corrupt | Represents the number of tables or partitions with corrupt or unusable statistics. Corrupt stats can mislead the query planner, potentially resulting in inefficient query execution plans. |
Statistics Missing | Indicates the number of tables or partitions involved in the query that are missing table or column statistics. Lack of statistics can lead to suboptimal query plans, as the query planner relies on these stats for cost-based optimization. |
Group by User or Resource Pool View
You can group the metrics by User or Resource Pool to view them accordingly.
Perform the following steps to group the metrics:
Click Group-By drop-down menu in the top right corner of the page, the drop-down menu is displayed.
Select the type of grouping you want to display from the following list:
User
Resource Pool
The details by selected type is grouped in the table.
(Optional)To ungroup the queries, select Ungroup.
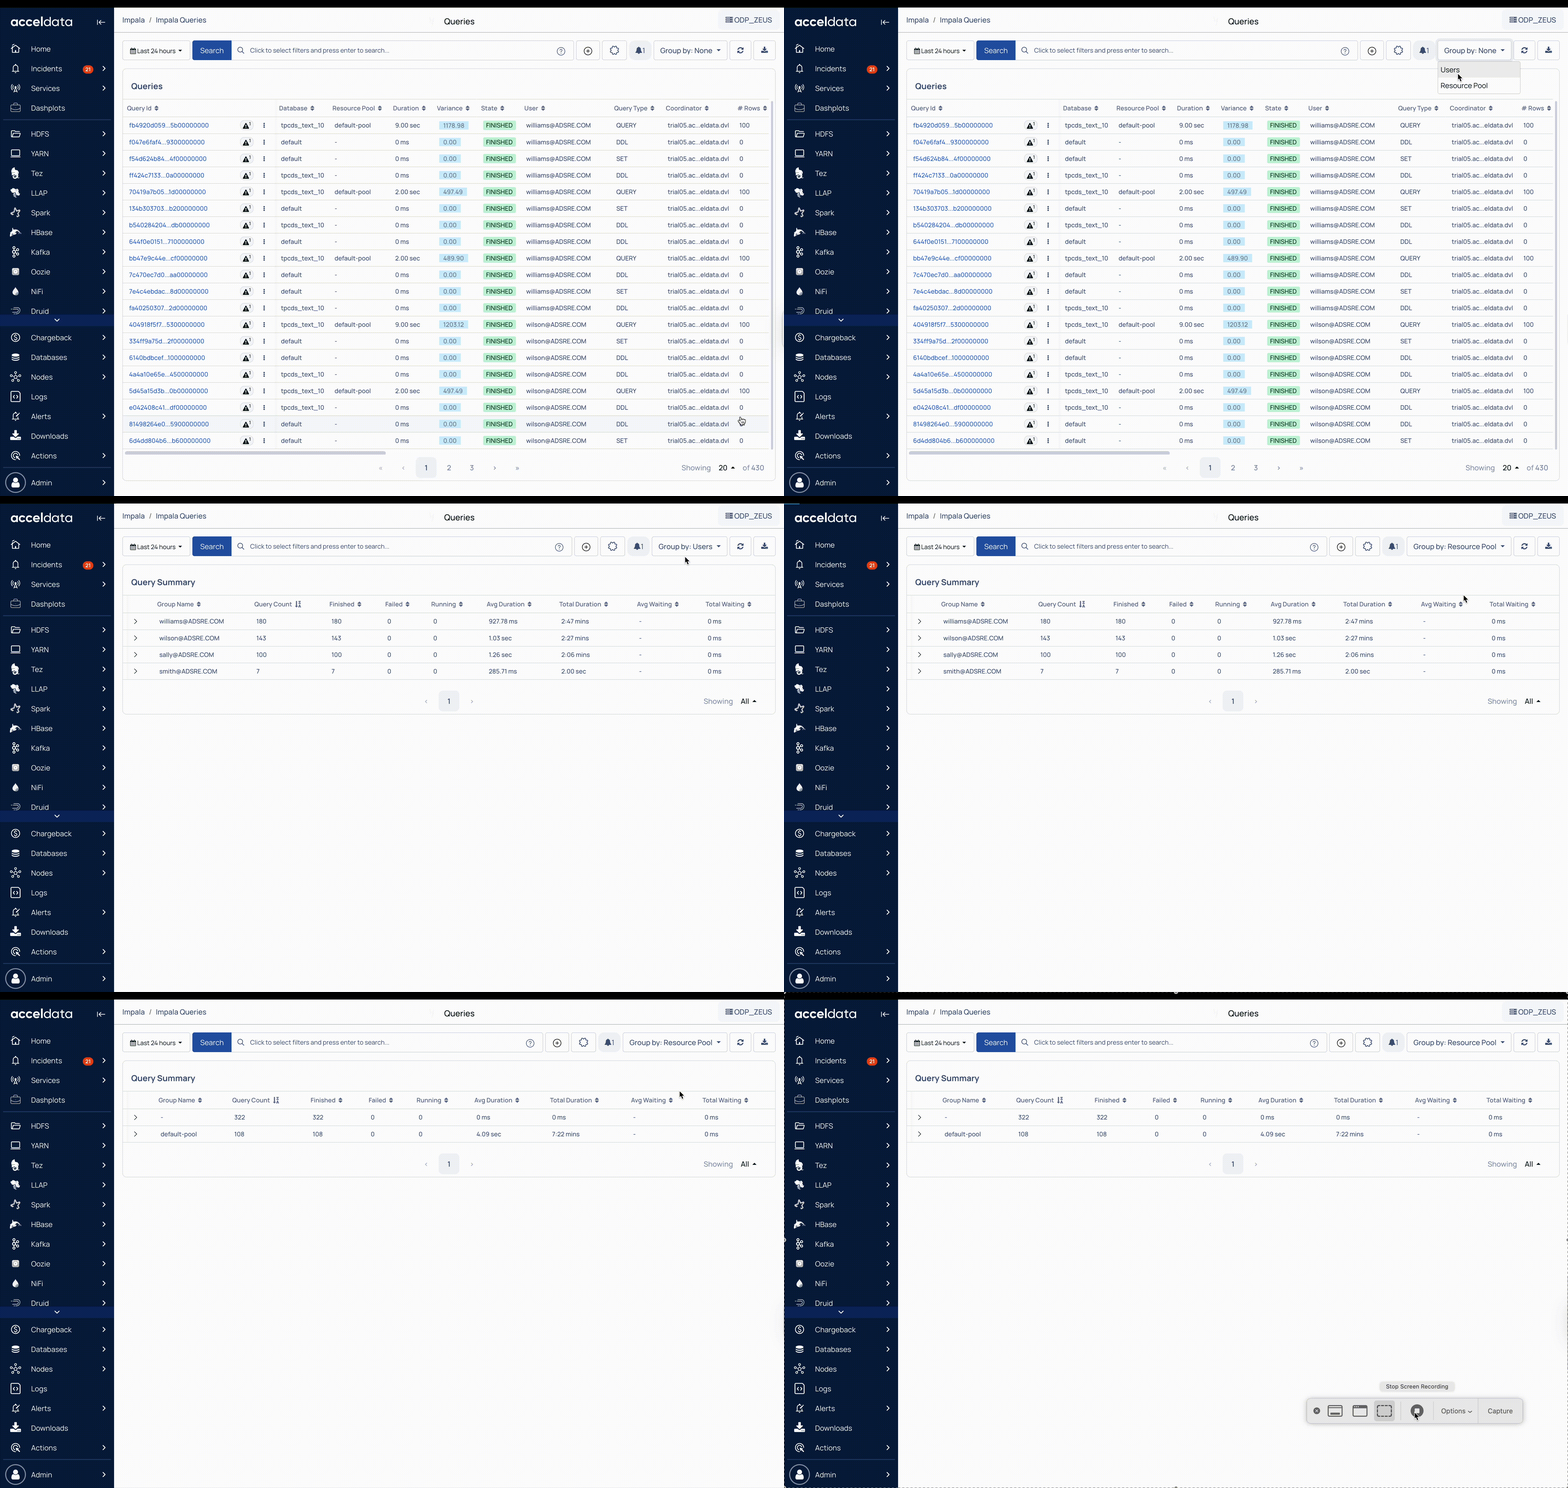
The following tables provides description of the metrics displayed for each job group:
Metrics | Description |
|---|---|
Group Name | The name of the group. |
Query Count | The total number of queries |
Finished | The total number of completed queries |
Failed | The total number of failed queries associated by a particular group. |
Running | The total number of running queries associated by a particular group. |
Avg Duration | The average time taken to execute a query by a particular group. |
Total Duration | The total time taken to execute a query by a particular group. |
Avg Waitings | The average wait time for a query |
Total Waitings | The total waiting time for a query |
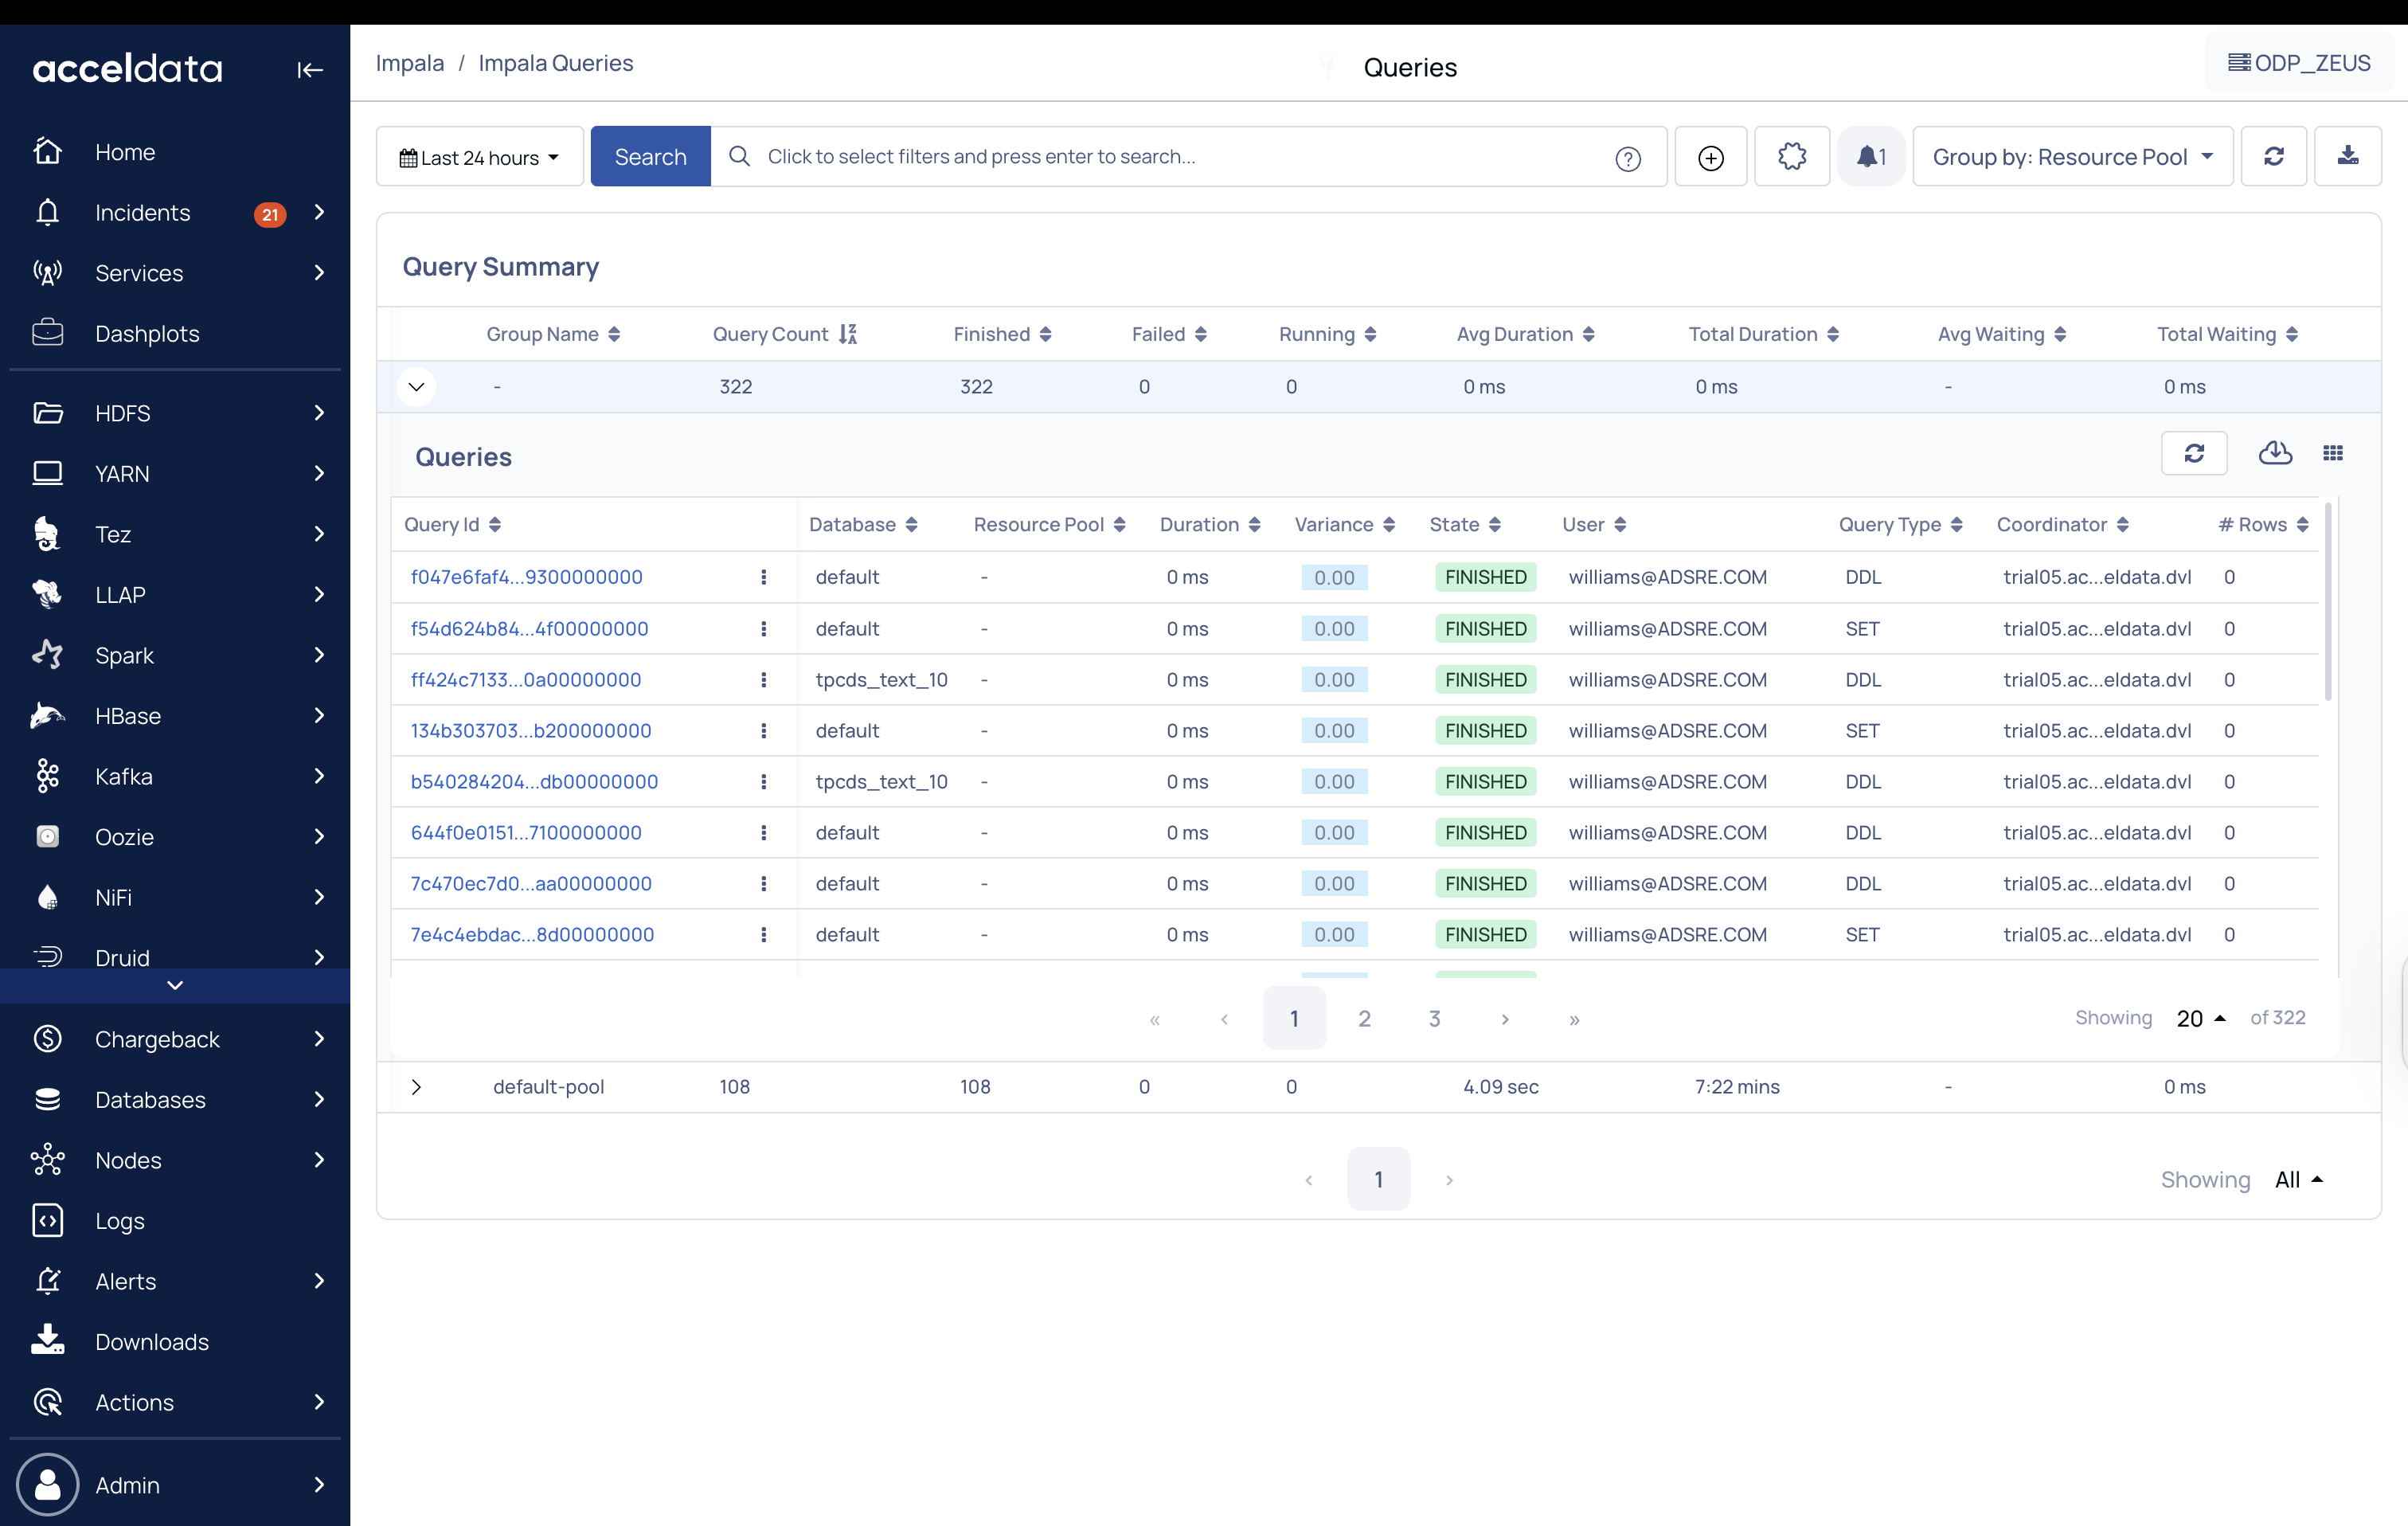
Click on the group row to view the details of the jobs in that group.
Search Option
Perform the following steps to search for a record in the search bar.
Select a search parameter. Pulse provides you multiple search parameters.
Select a suitable operator for your parameter.
Enter the search term and hit the enter key.
Important
For String Data type fields, you can use the =~ operator. This operator allows you to search strings by entering partial string. You can also use regular expressions to search a required value.

Adding/Removing Columns
To apply a filter to the column of the table, perform the following:
Click the table settings icon. The Select Columns window is displayed.
Select/deselect the checkbox from the available list of column names. By default, all the checkboxes are selected.
Click Apply.
(Optional) You can search for the name of the column using the search box.
The following metrics are displayed for each query:
Metric | Description |
|---|---|
Query ID | The ID of the query. The following action can be performed on the Query ID:
|
Database | The database on which the query was run. |
Resource Pool | The name of the resource pool used by the Query. |
Duration | The total time taken by the query to run. |
Variance | Variance indicates if a job is slower than previous runs. It is calculated as (avgValue - currentValue)/stdDeviation. |
State | The state of the query, whether Running, Succeeded, Exception, or Finished. Click on the status to view details on the Impala Query Details page. |
User | The user that ran the query. |
Query Type | The type of the query, whether DDL, DML, or Query. |
Coordinator | The name of coordinator node used by the query. |
# of Rows | The number of rows produced by the query. |
Thread CPU Time | The sum of the CPU time used by all threads of the query. |
Per Node Peak Memory Usage | The peak memory usage per node. |
HDFS Aggr Read Memory | The sum of HDFS bytes read from memory by the query. |
Start Time | The date and time at which the query started running. |
Completion Time | The date and time at which the query completed. |
Incidents
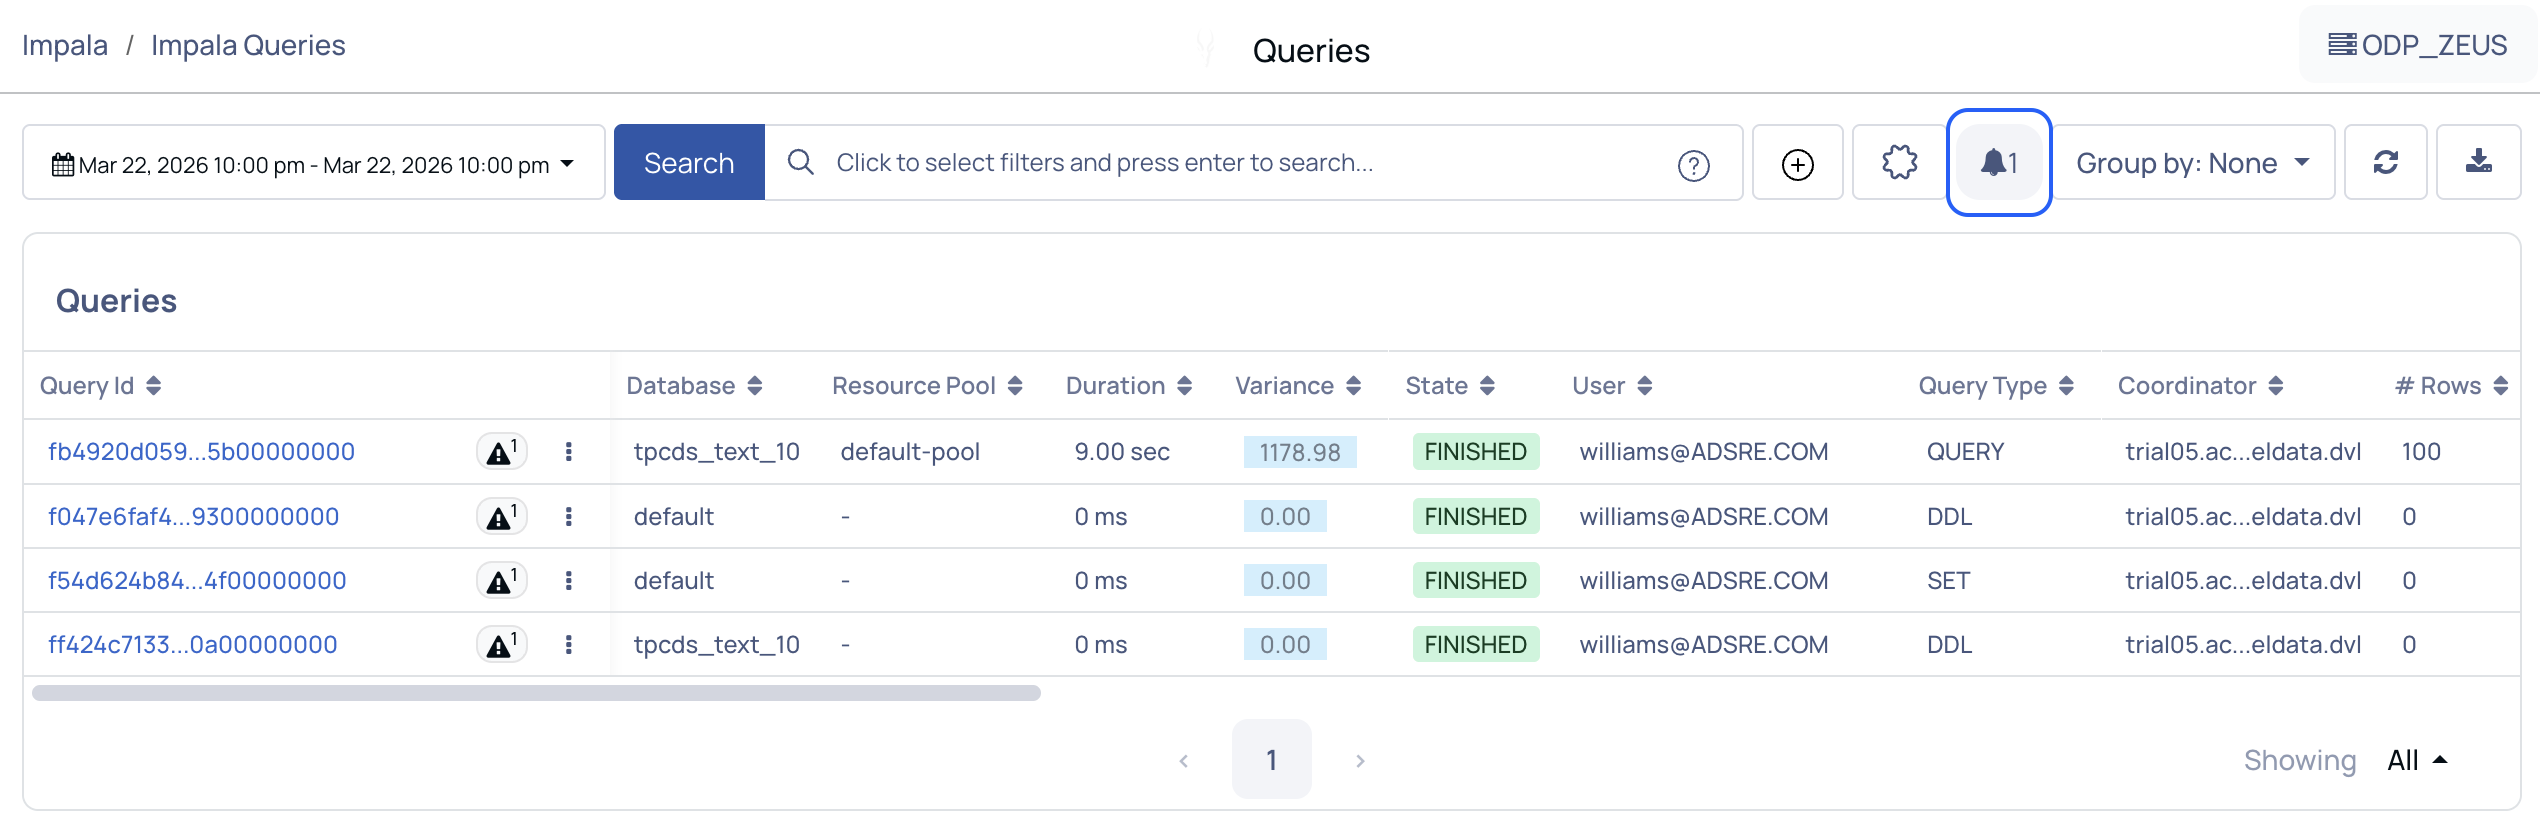
To hide or display the Incident details panel, click the Incidents button. By default, the Incident details are displayed.
You can view the incidents that were raised for the queries in the Incidents panel. Select an incident group to filter the queries displayed in the table.
View incidents
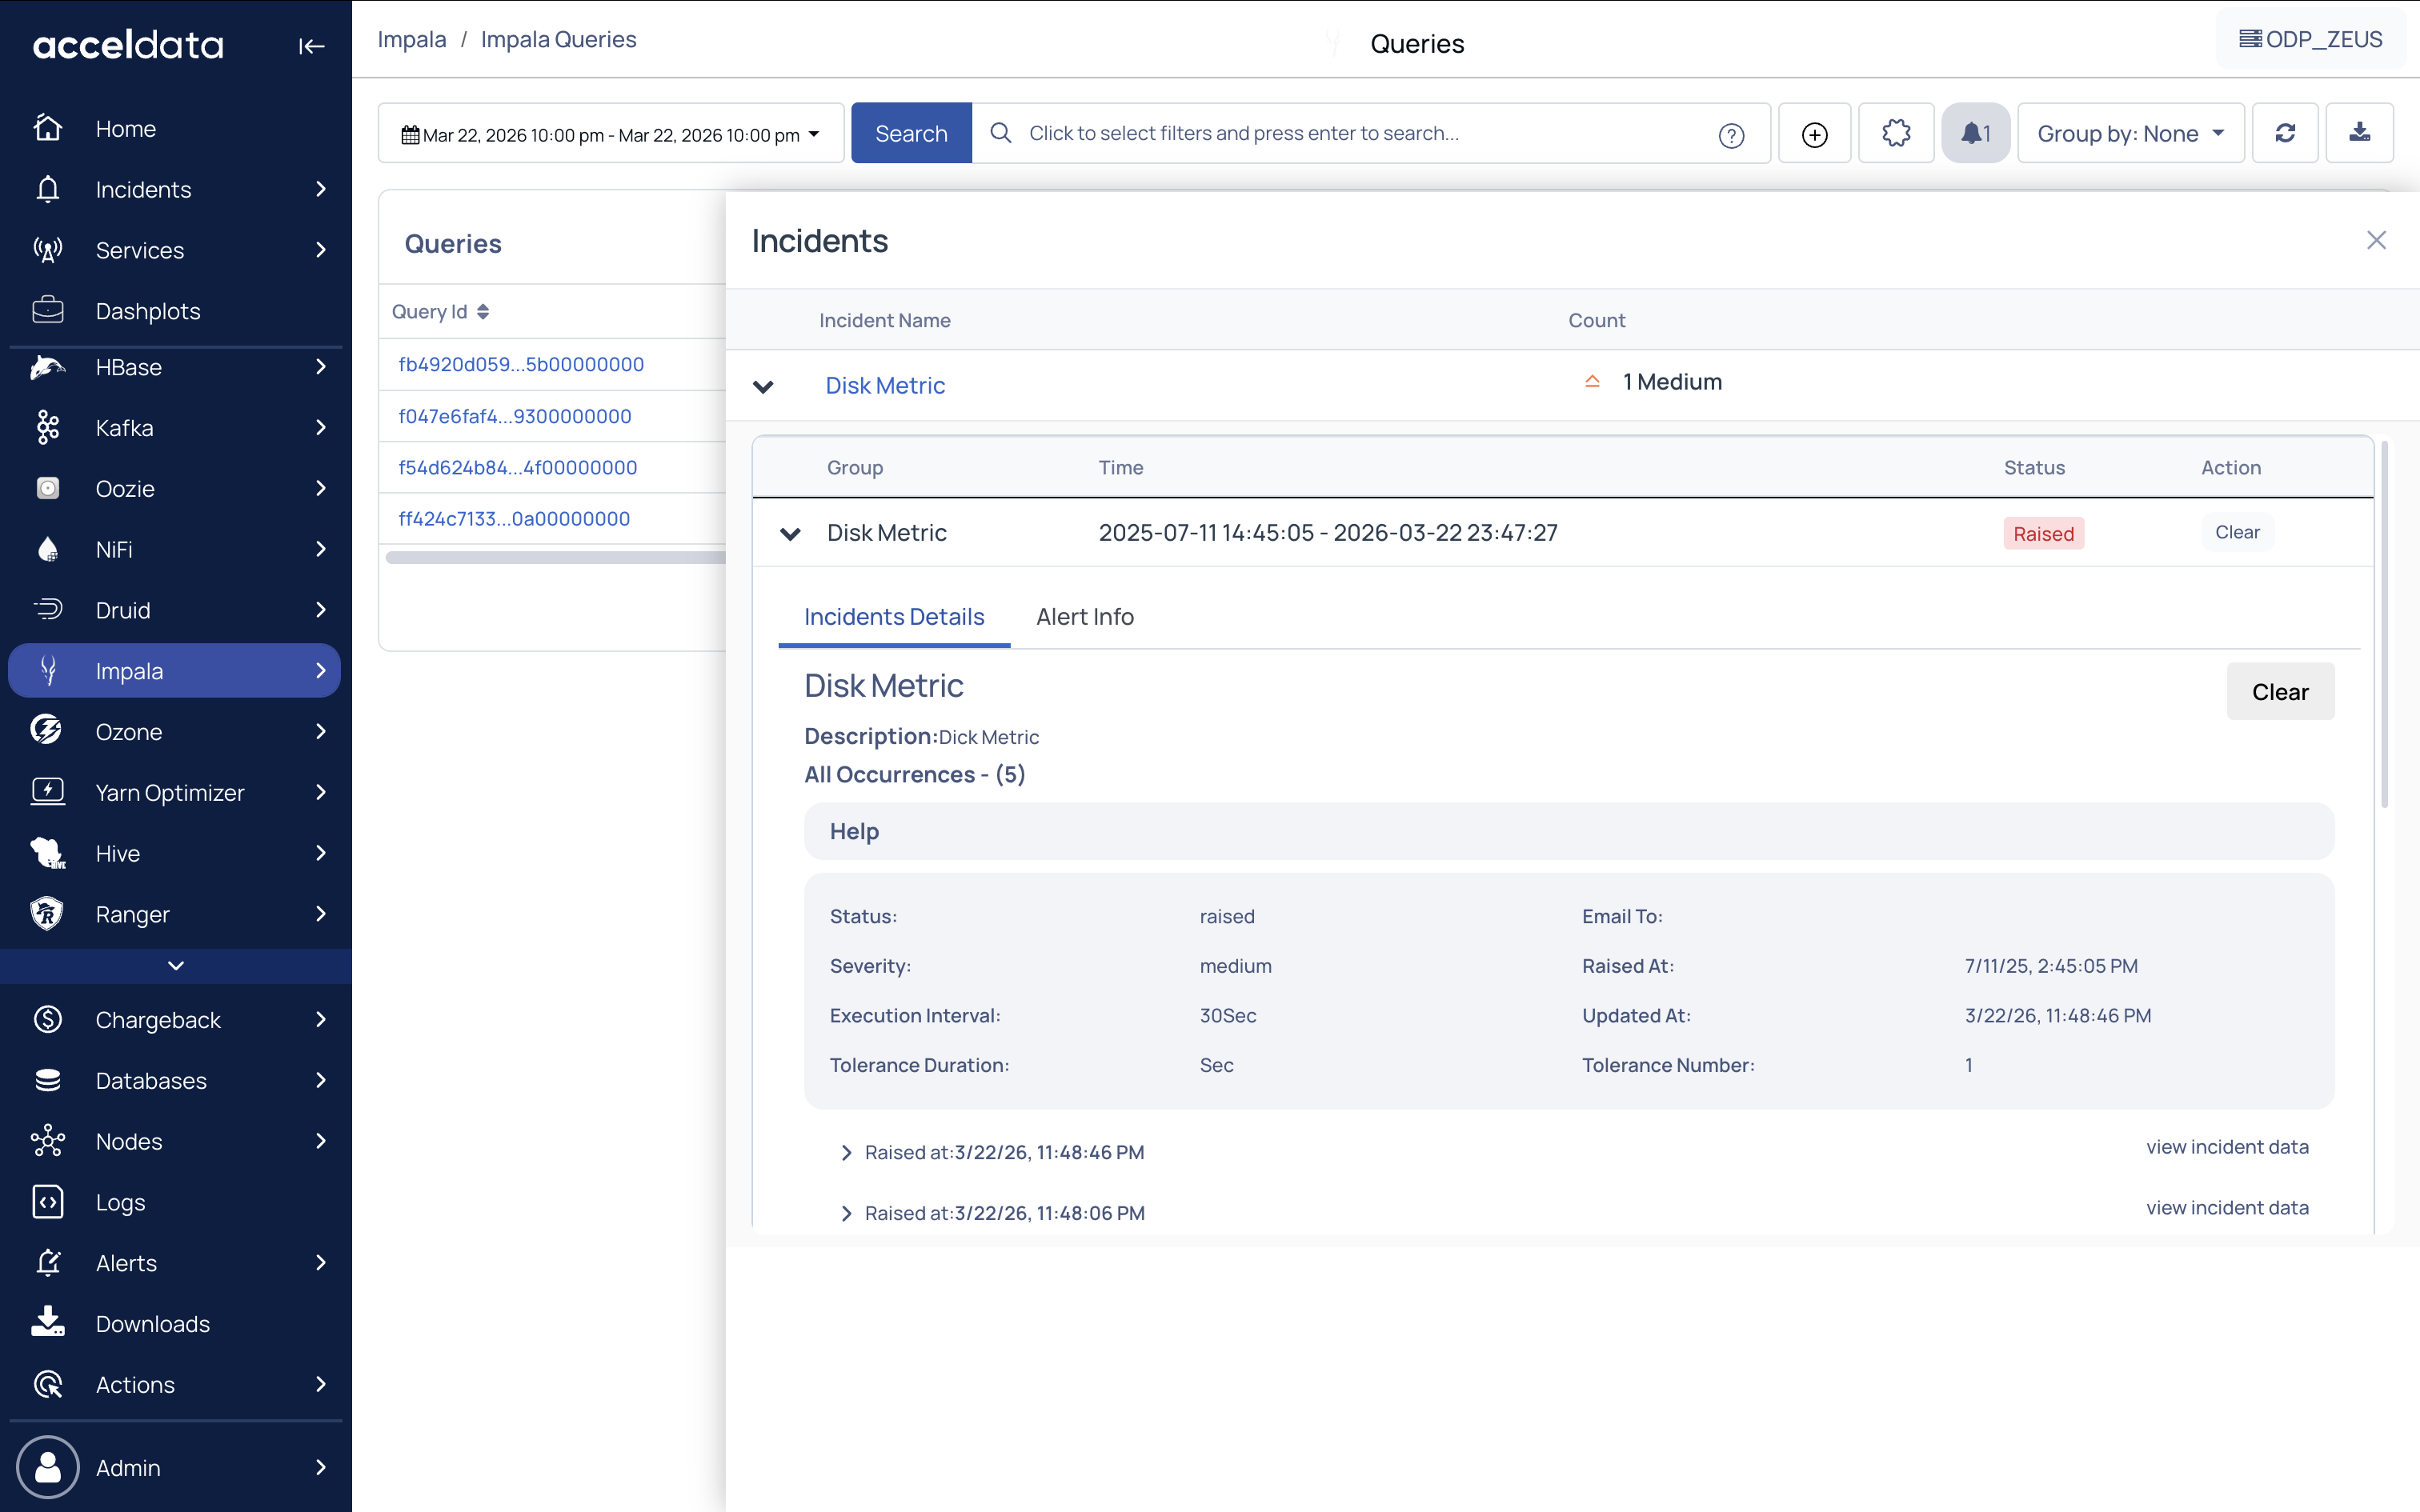
Click View Incident to view the list of incidents in the Incidents window. Click an incident in the Incident panel to view its details. The following table provides details of the data displayed in the Incidents window:
Name | Description |
|---|---|
Name | Name of the incident group. |
Duration | Displays the start date and time and the end date and time of the incident. |
Host | Name of the host. |
Status | Displays the status, whether it is raised or cleared. To change the status from raised to cleared, click Clear. |
To view the details of an incident click . The details of the incidents is displayed. To hide the details, click .
Advanced Search Options
The search field in the Impala Queries Page supports Influx-like query statements. For example, if you want to search for a query, use the format parametername:value. However, you need to know the full name of the parameter to be able to use it. For example, the name of the parameter visible in the UI is User. However, internally, the parameter name is effective_user. Hence, if you want to search for queries with User = Mark, you need to type effective_user:Mark.
Download Records
The option to download Impala Queries from the Pulse UI in .xlsx format is not supported due to high memory consumption, which could impact the Pulse UI service performance.
You can download the query results in .csv format, which is lighter and more efficient.
To improve stability during large export jobs, Pulse introduces configurable environment variables for download job retention, job concurrency, lock lifetime, and compression level.
These settings help reduce memory and CPU pressure during large Impala query exports and improve recovery for stuck jobs. For details, see <will add a link>
Note This is introduced in Pulse 4.1.0. Acceldata does not recommend modifying the default values with the Pulse versions earlier to 4.1.0.