
The Impala Query Details page contains the following panels:
Summary Panel
The summary panel displays the following information.
Field Name | Description |
|---|---|
User | The name of the user that ran the job. |
State | Status of the job. The state can be one of the following: Created, Initialized, Compiled, Running, Finished, Exception, and Unknown. |
Duration | The total time taken by the query to run. |
Database | The database on which the query was run. |
Coordinator | The host coordinating this query. |
# Fragments | The number of fragments of the Impala query. |
Start Time | The time at which the query started to run. |
End Time | The time at which the query stopped running. |
Query Trends
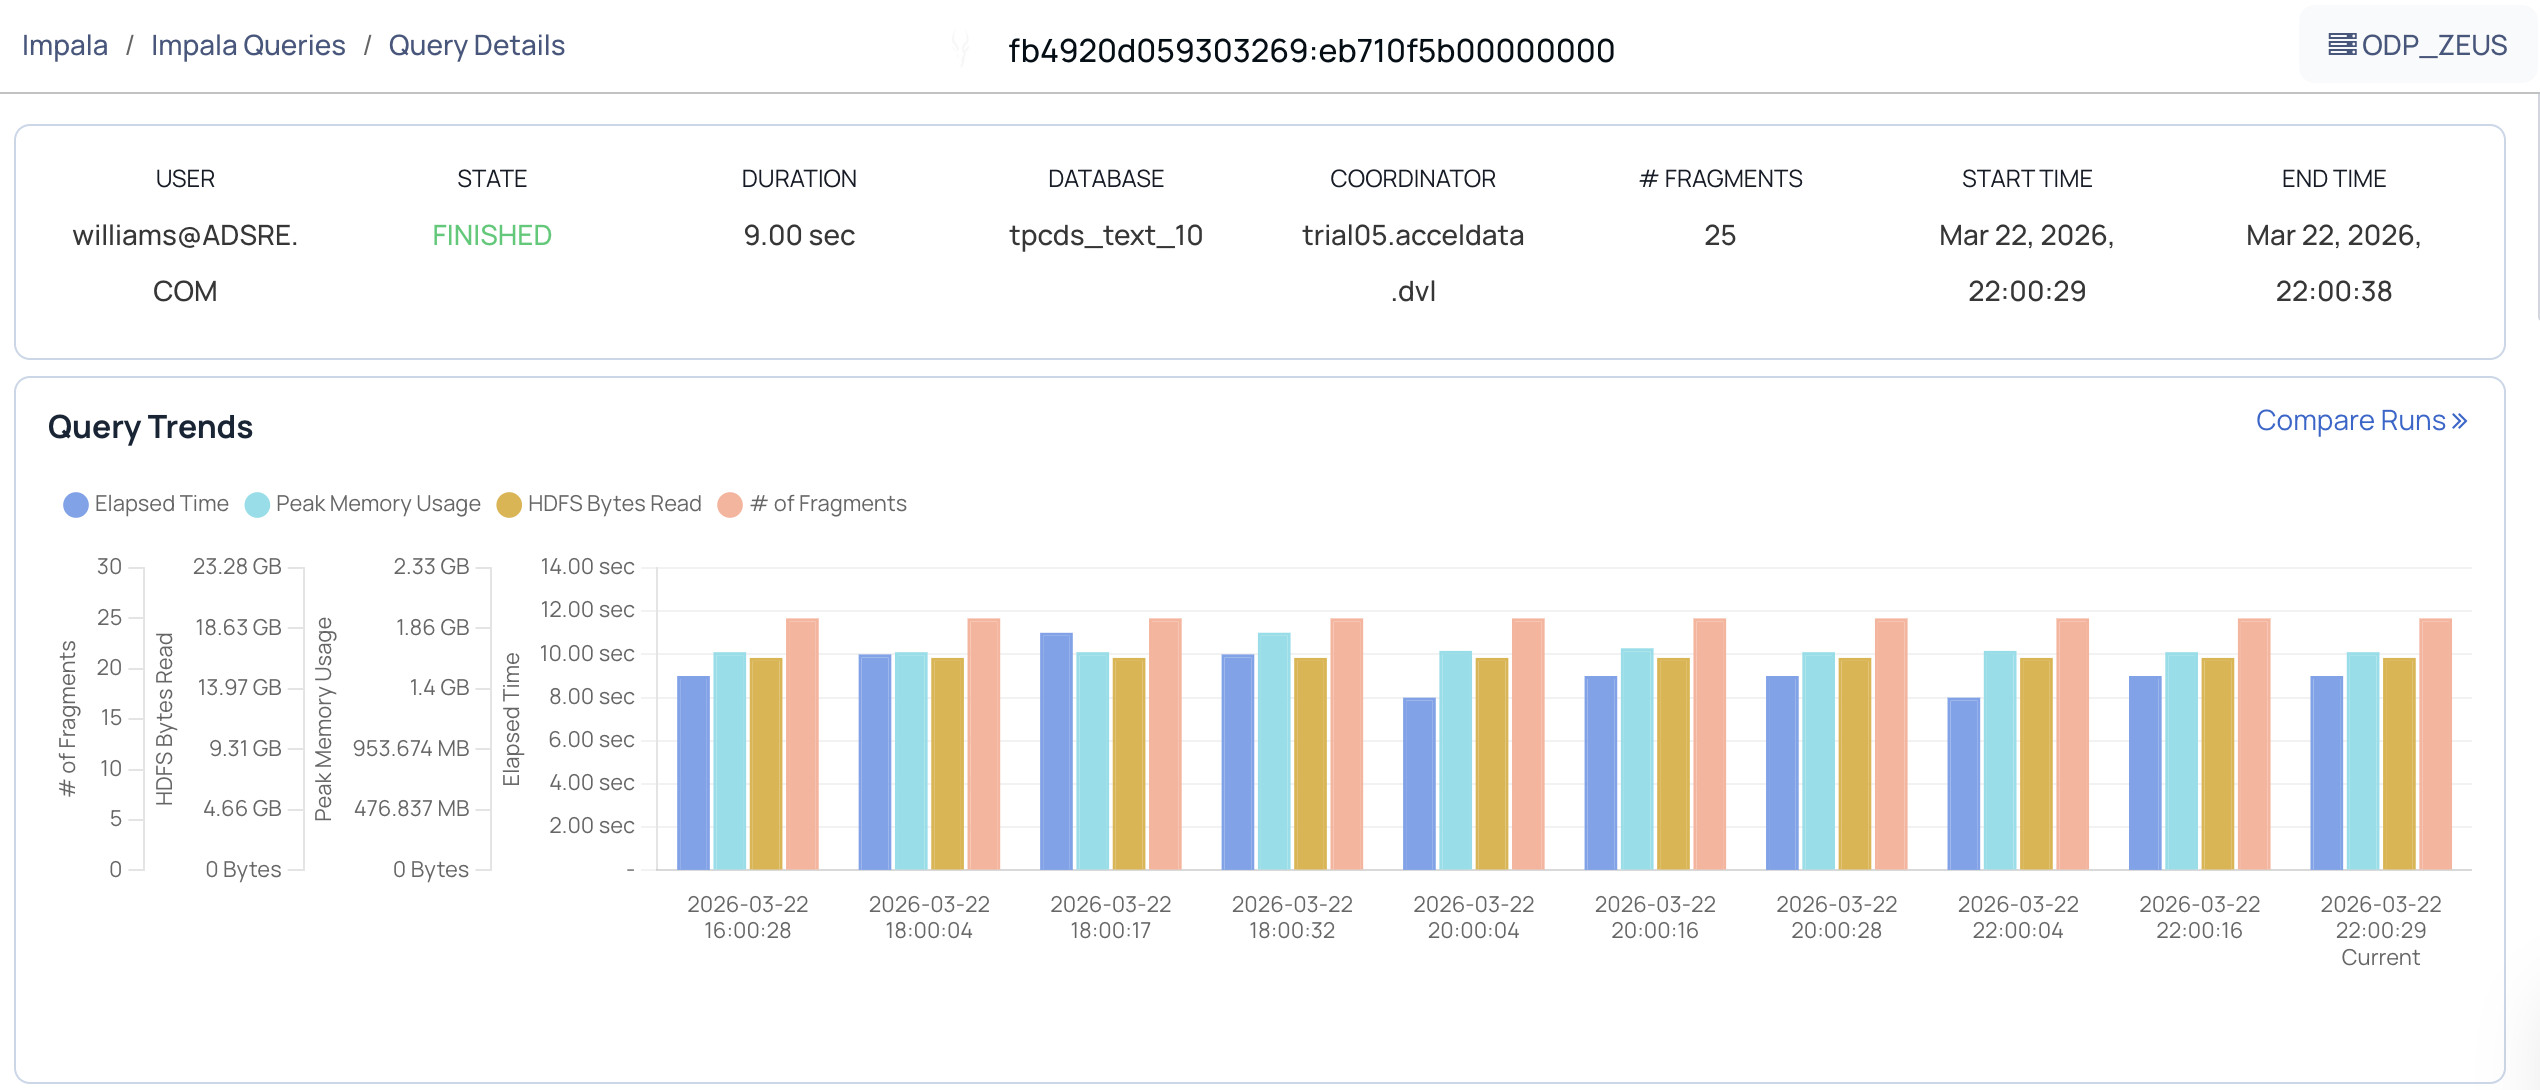
The Query Trends panel displays a chart showing the pattern of jobs running at a particular time, based on the following factors:
Metric | Description |
|---|---|
Elapsed Time | The time taken to run the jobs at a particular time. |
Peak Memory Usage | The highest amount of memory allocated by the query. |
HDFS Bytes Read | The sum of HDFS bytes read from memory by the query. |
# of Fragments | The number of fragments of the Impala query. |
Configuration Difference
Click Compare Runs to compare different runs of the query. Select the runs that you want to compare. You can choose from upto 10 previous runs of the query. The metrics that are different are highlighted and displayed at the very top of the comparison result.
Recommendations
The Recommendations panel displays recommendations that you can use to improve the performance of the SQL Query.
Query
The Query panel displays the query along with the Join Columns and Table.
Note The following actions can be performed:
Click the icon to copy the SQL query onto the clipboard.
Click theicon to beautify the query.
Click the table name, to view table details in the Impala Table Details page.
Query Timeline
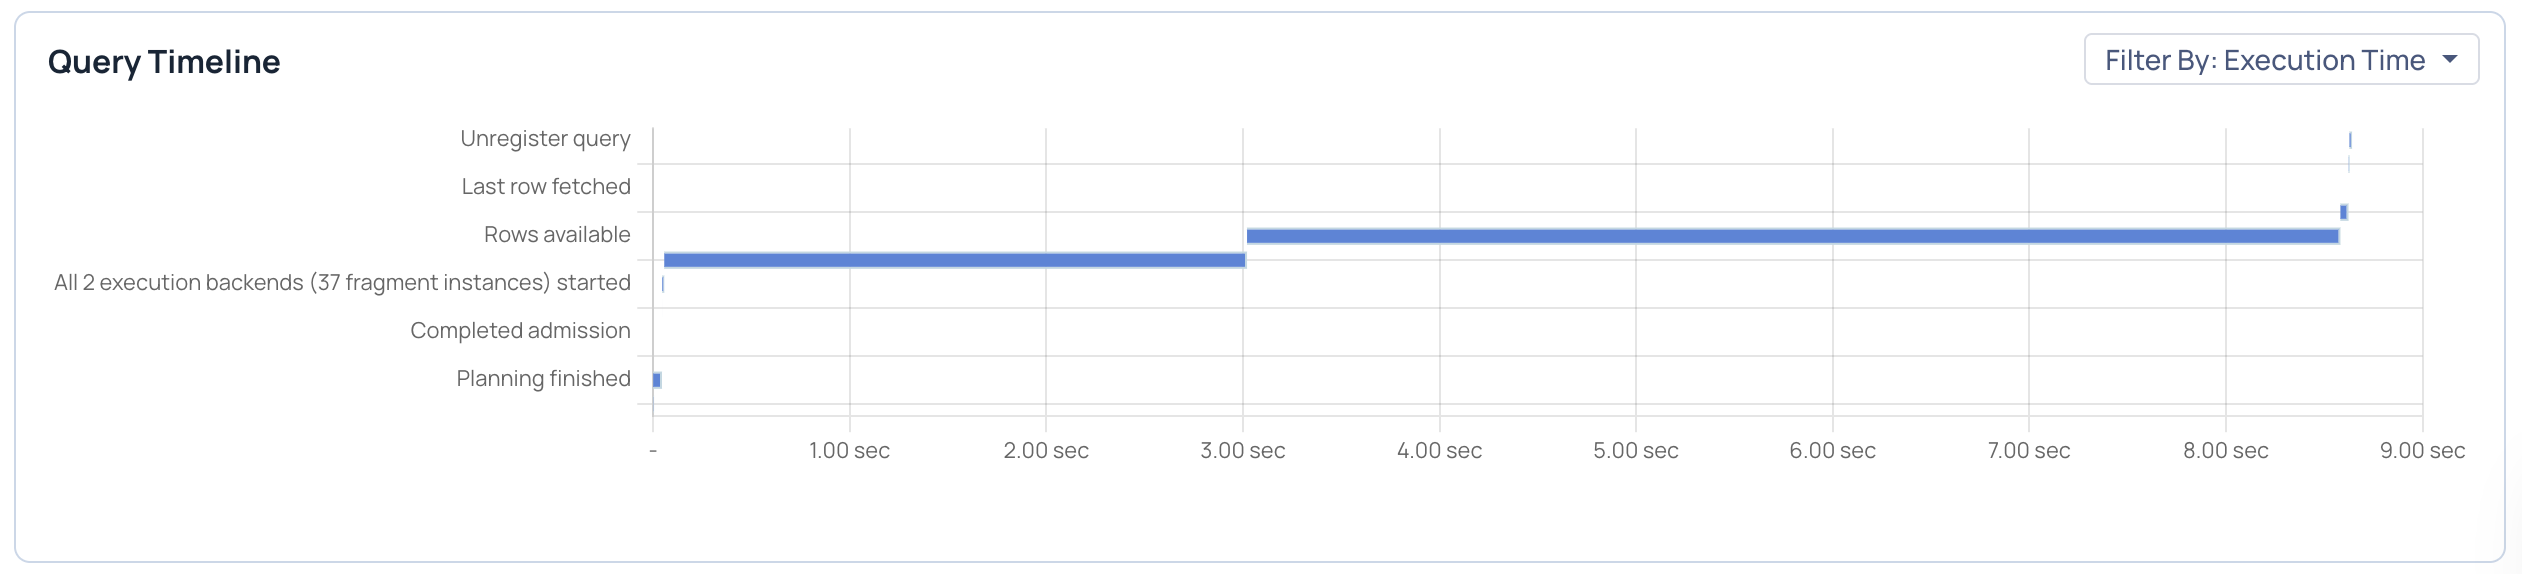
The Query Timeline panel displays the stages of the query execution or compilation with the time taken for each stage. You can view the time line by filtering by Execution Time or by Compilation Time. The series of steps for each process is displayed along with the time taken by each step. Hover over a section to view the time taken by the specific step.
Query Execution Metrics
The query execution metrics are categorized into the following groups - General, Thread Metrics, HDFS Metrics, and Other Metrics.
Metric Type | Metric Name | Description |
|---|---|---|
General | Query ID | The ID of the query. |
Database | The database on which the query was run. | |
Query Type | The type of the query SQL statement, whether DML, DDL, or Query. | |
Rows Produced | The number of rows produced by the query. | |
Admission Result | The result of admission, whether admitted immediately, queued, rejected, or timed out. | |
Admission Waiting Time | The time from submission for admission to completion of admission. | |
Per Node Peak Mem Usage | The peak memory usage per node. | |
Client Fetch Wait Time | The total amount of time the query spent waiting for the client to fetch row data. | |
Client Fetch Wait Time Percentage | The total amount of time the query spent waiting for the client to fetch row data divided by the query duration, expressed as a percentage. | |
Estimated per Node Peak Memory | The planning process's estimate of per-node peak memory usage for the query. | |
Total File Formats | A list of all the file formats used in the query. | |
Out Of Memory | Whether the query ran out of memory. The value can be True or False. | |
Memory Spilled | The amount of data written to disk when there isn't enough memory available for processing. | |
Estimated Per-node Peak Memory | The highest amount of memory used by any node during job execution, estimated per node. | |
Thread Metrics | Aggregate Total Threads CPU Time | The sum of the CPU time used by all threads of the query. |
Aggregate Total Threads CPU Time Percentage | The sum of the CPU time used by all threads of the query divided by the total thread time, expressed as a percentage. | |
Aggregate Total Network Receive Wait Time | The sum of the time spent waiting to receive data over the network by all threads of the query. | |
Aggregate Total Network Receive Wait Time Percentage | The sum of the time spent waiting to receive data over the network by all threads of the query divided by the total thread time, expressed as a percentage. | |
Aggregate Total Network Send Wait Time | The sum of the time spent waiting to send data over the network by all threads of the query. | |
Aggregate Total Network Send Wait Time Percentage | The sum of the time spent waiting to send data over the network by all threads of the query divided by the total thread time, expressed as a percentage. | |
Aggregate Total Storage Wait Time | The sum of the time spent waiting for storage by all threads of the query. | |
Aggregate Total Storage Wait Time Percentage | The sum of the time spent waiting for storage by all threads of the query divided by the total thread time, expressed as a percentage. | |
Threads Total Time | The sum of thread CPU, storage wait and network wait times used by all threads of the query. | |
Aggregate Total Threads System Time | The total system time taken by all threads for this query. | |
Aggregate Total Threads Wall Clock Time | The total wallclock time taken by all threads for this query. | |
HDFS Metrics | HDFS Aggregate Per Host Peak Memory Usage | The sum of peak memory usage of all the nodes for the query. |
HDFS Aggregate Peak Memory Usage | The highest amount of memory allocated by this query at a particular time across all nodes. | |
HDFS Aggregate Bytes Read | The total number of bytes read from HDFS by this query. | |
HDFS Aggregate Bytes Read Local | The total number of local bytes read from HDFS by this query. This is only for completed queries. | |
HDFS Aggregate Bytes Read Remote | The total number of remote bytes read from HDFS by this query. This is only for completed queries. | |
HDFS Aggregate Bytes Read Data Node Cache | The total number of bytes read from HDFS that were read from the HDFS cache. This is only for completed queries. | |
HDFS Aggregate Bytes Read Short Circuit | The total number of bytes read from HDFS by this query that used short-circuit reads. This is only for completed queries. | |
Avg HDFS Thread Read Throughput | The average HDFS scanner read throughput for this query. This is calculates by dividing the total bytes read from HDFS by the total time spent reading by all HDFS scanners. | |
Other Metrics | Network Address | The network address that issued this query. |
Node with Peak Memory Usage | The node with the highest peak memory usage for this query. | |
Planning Wait Time | The total amount of time the query spent waiting for planning to complete. | |
Planning Wait Time Percentage | The total amount of time the query spent waiting for planning to complete divided by the query duration, expressed as a percentage. | |
Number Of Backends | The number of backend connections from this Impala Daemon to other Impala Daemons. | |
Number of Query Fragments Instances | The number of query fragment instances. | |
Pool | The name of the resource pool in which this query executed. | |
Statistics Corrupt | Whether the query was flagged with any corrupt blocks warning during the planning process. | |
Statistics Missing | Whether the query was flagged with missing table or column statistics warning during the planning process. | |
Statistics Missing Tables | The name of the missing table. |
Error Details
The error panel is displayed only if there is an error during the running of the query. It displays the error encountered during the run.
Query Fragment Stats
The Query Fragments Stats panel displays statistics about the fragments of the query. The fragments are represented by dots and are spread across a scale of lowest to highest value. You can choose the scale as Execution Time, Peak Memory Usage, or HDFS Bytes Read. Hover over a dot to view the fragment name. Click a fragment to view its details.
Query Fragment Details
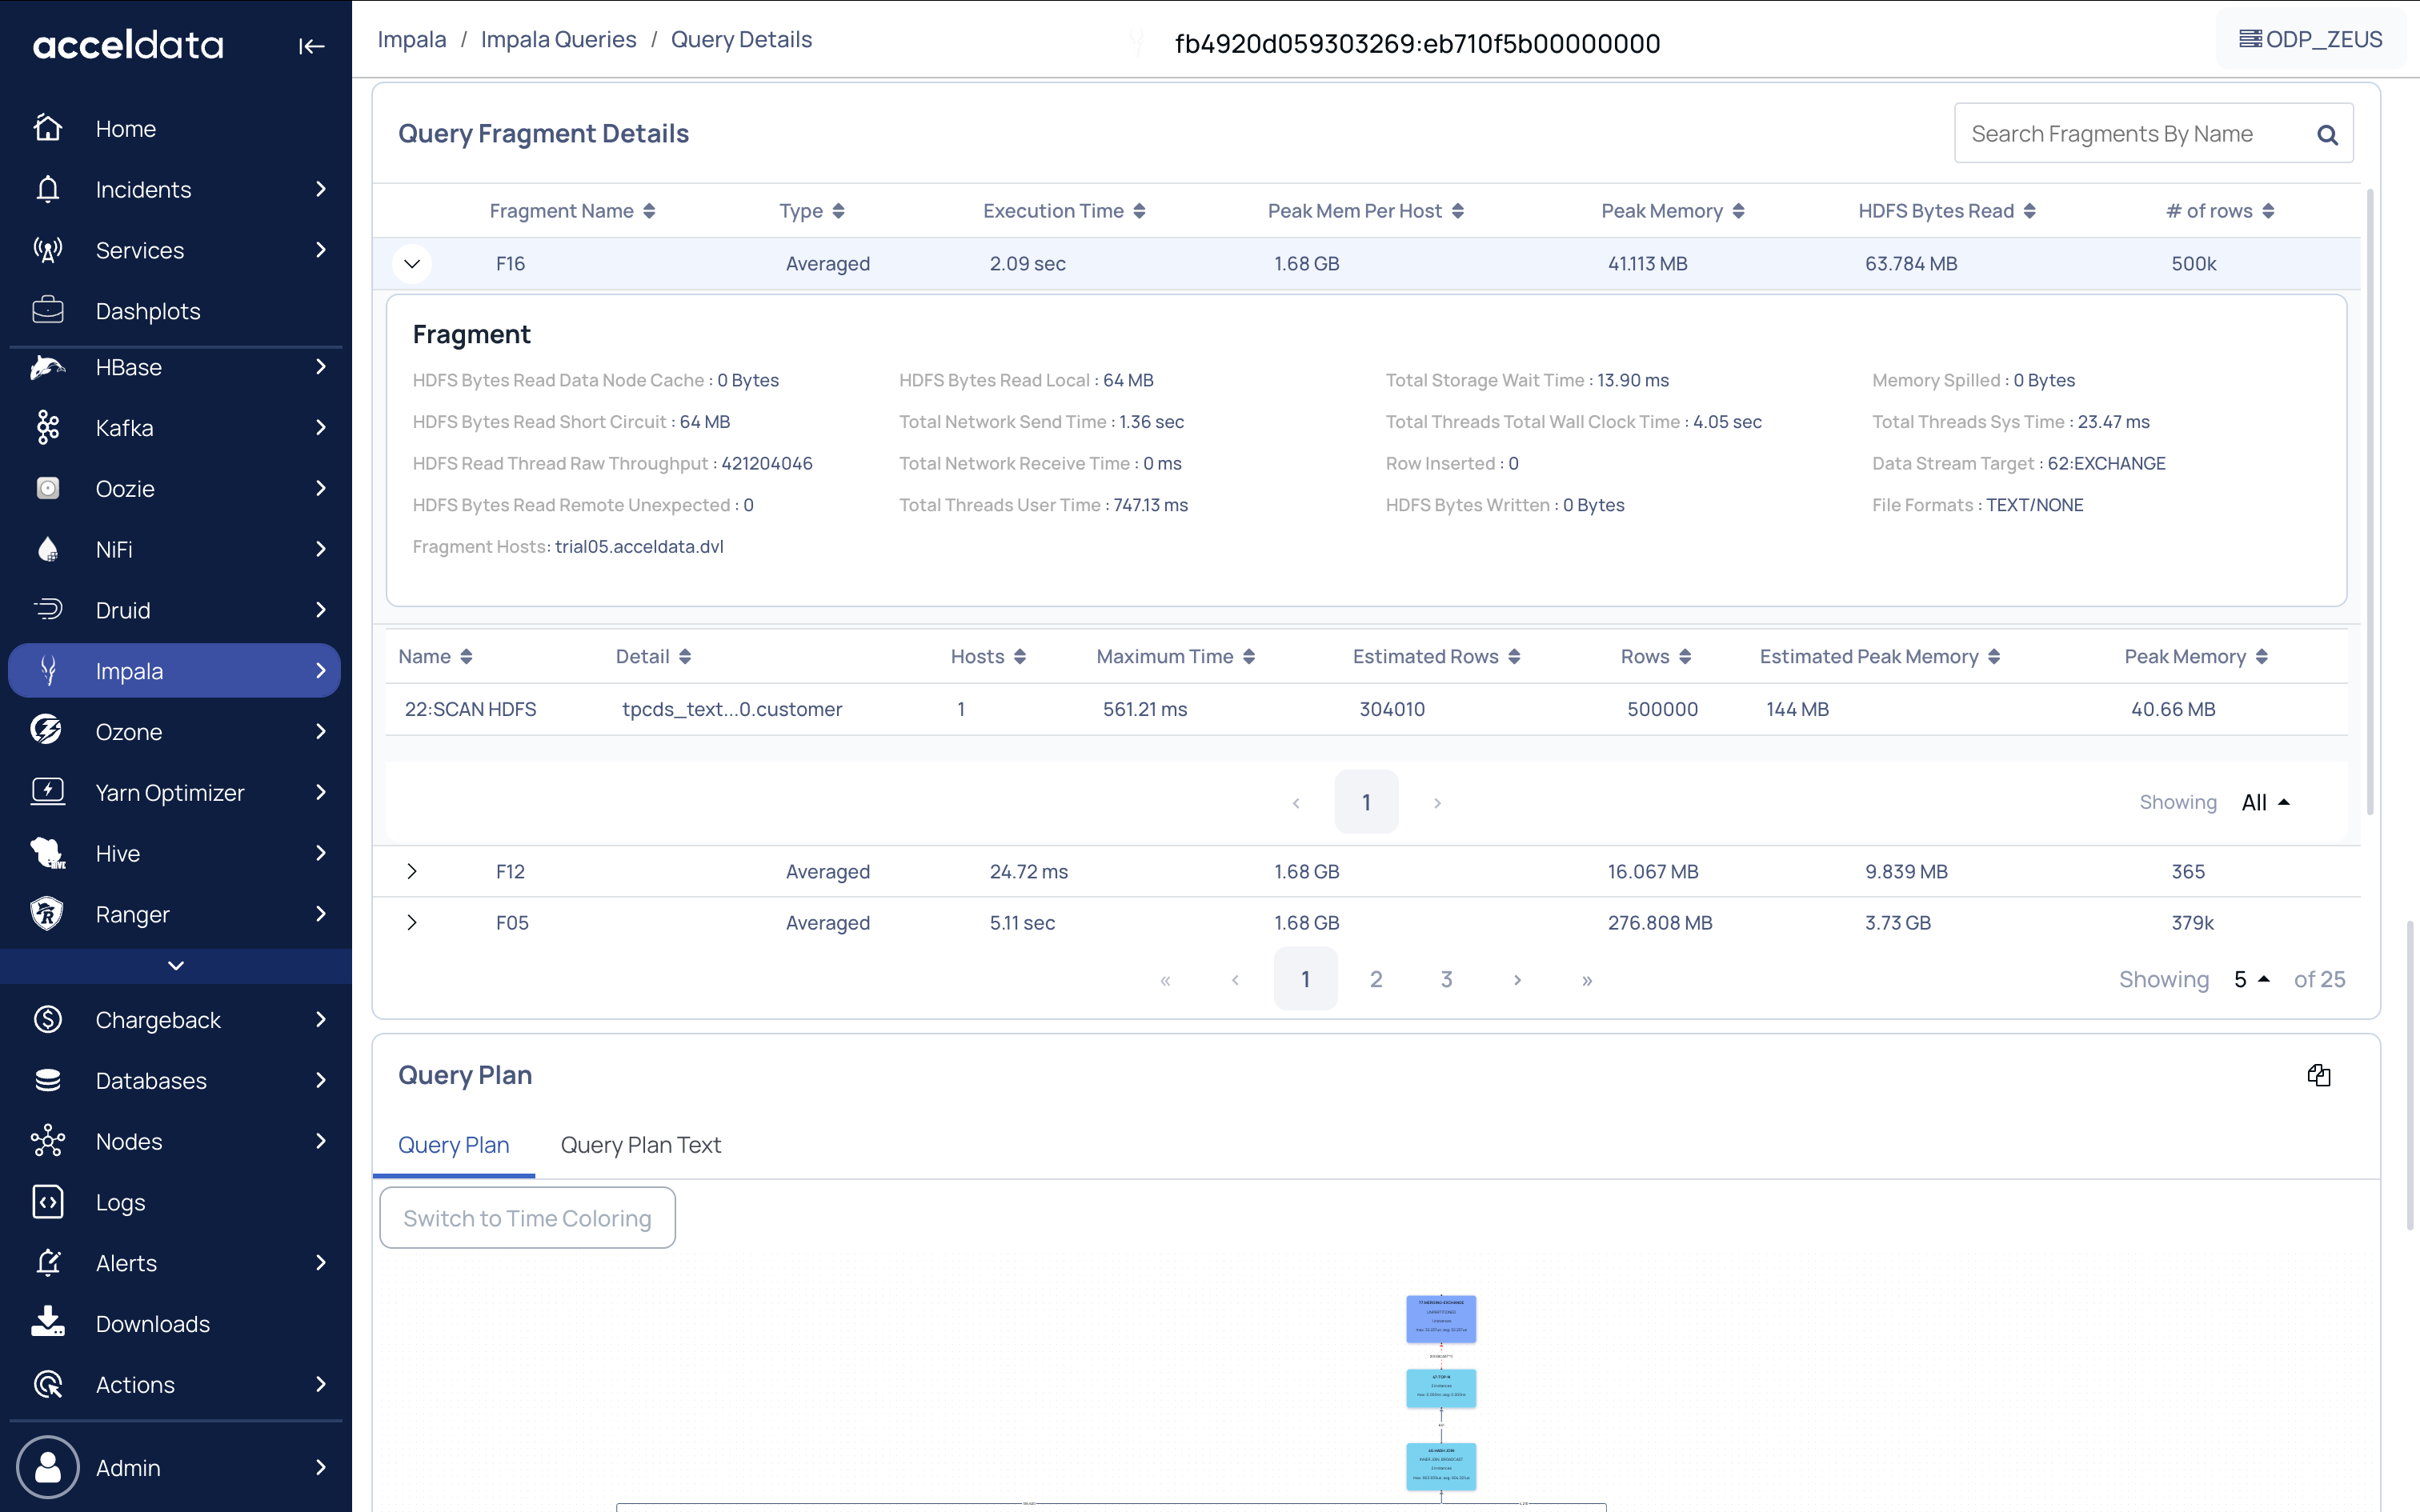
Click a fragment to view its details along with its operators. Click an operator to view it in the Query Plan.
You can search for a fragment by name. To search for a fragment, click the search box and type the name of the fragment.
The following table provides description of the metrics displayed in the Query Fragment Details table:
Column | Description |
|---|---|
Fragment Name | The ID of the stage. |
Type | The number of tasks in the stage. |
Execution Time | The graphical representation of the duration of the tasks. |
Peak Mem Per Host | The time taken to complete tasks in that stage. |
HDFS Bytes Read | The maximum memory occupied by tasks. |
# of Rows | The rate of input/output operations (in %). |
Query Plan
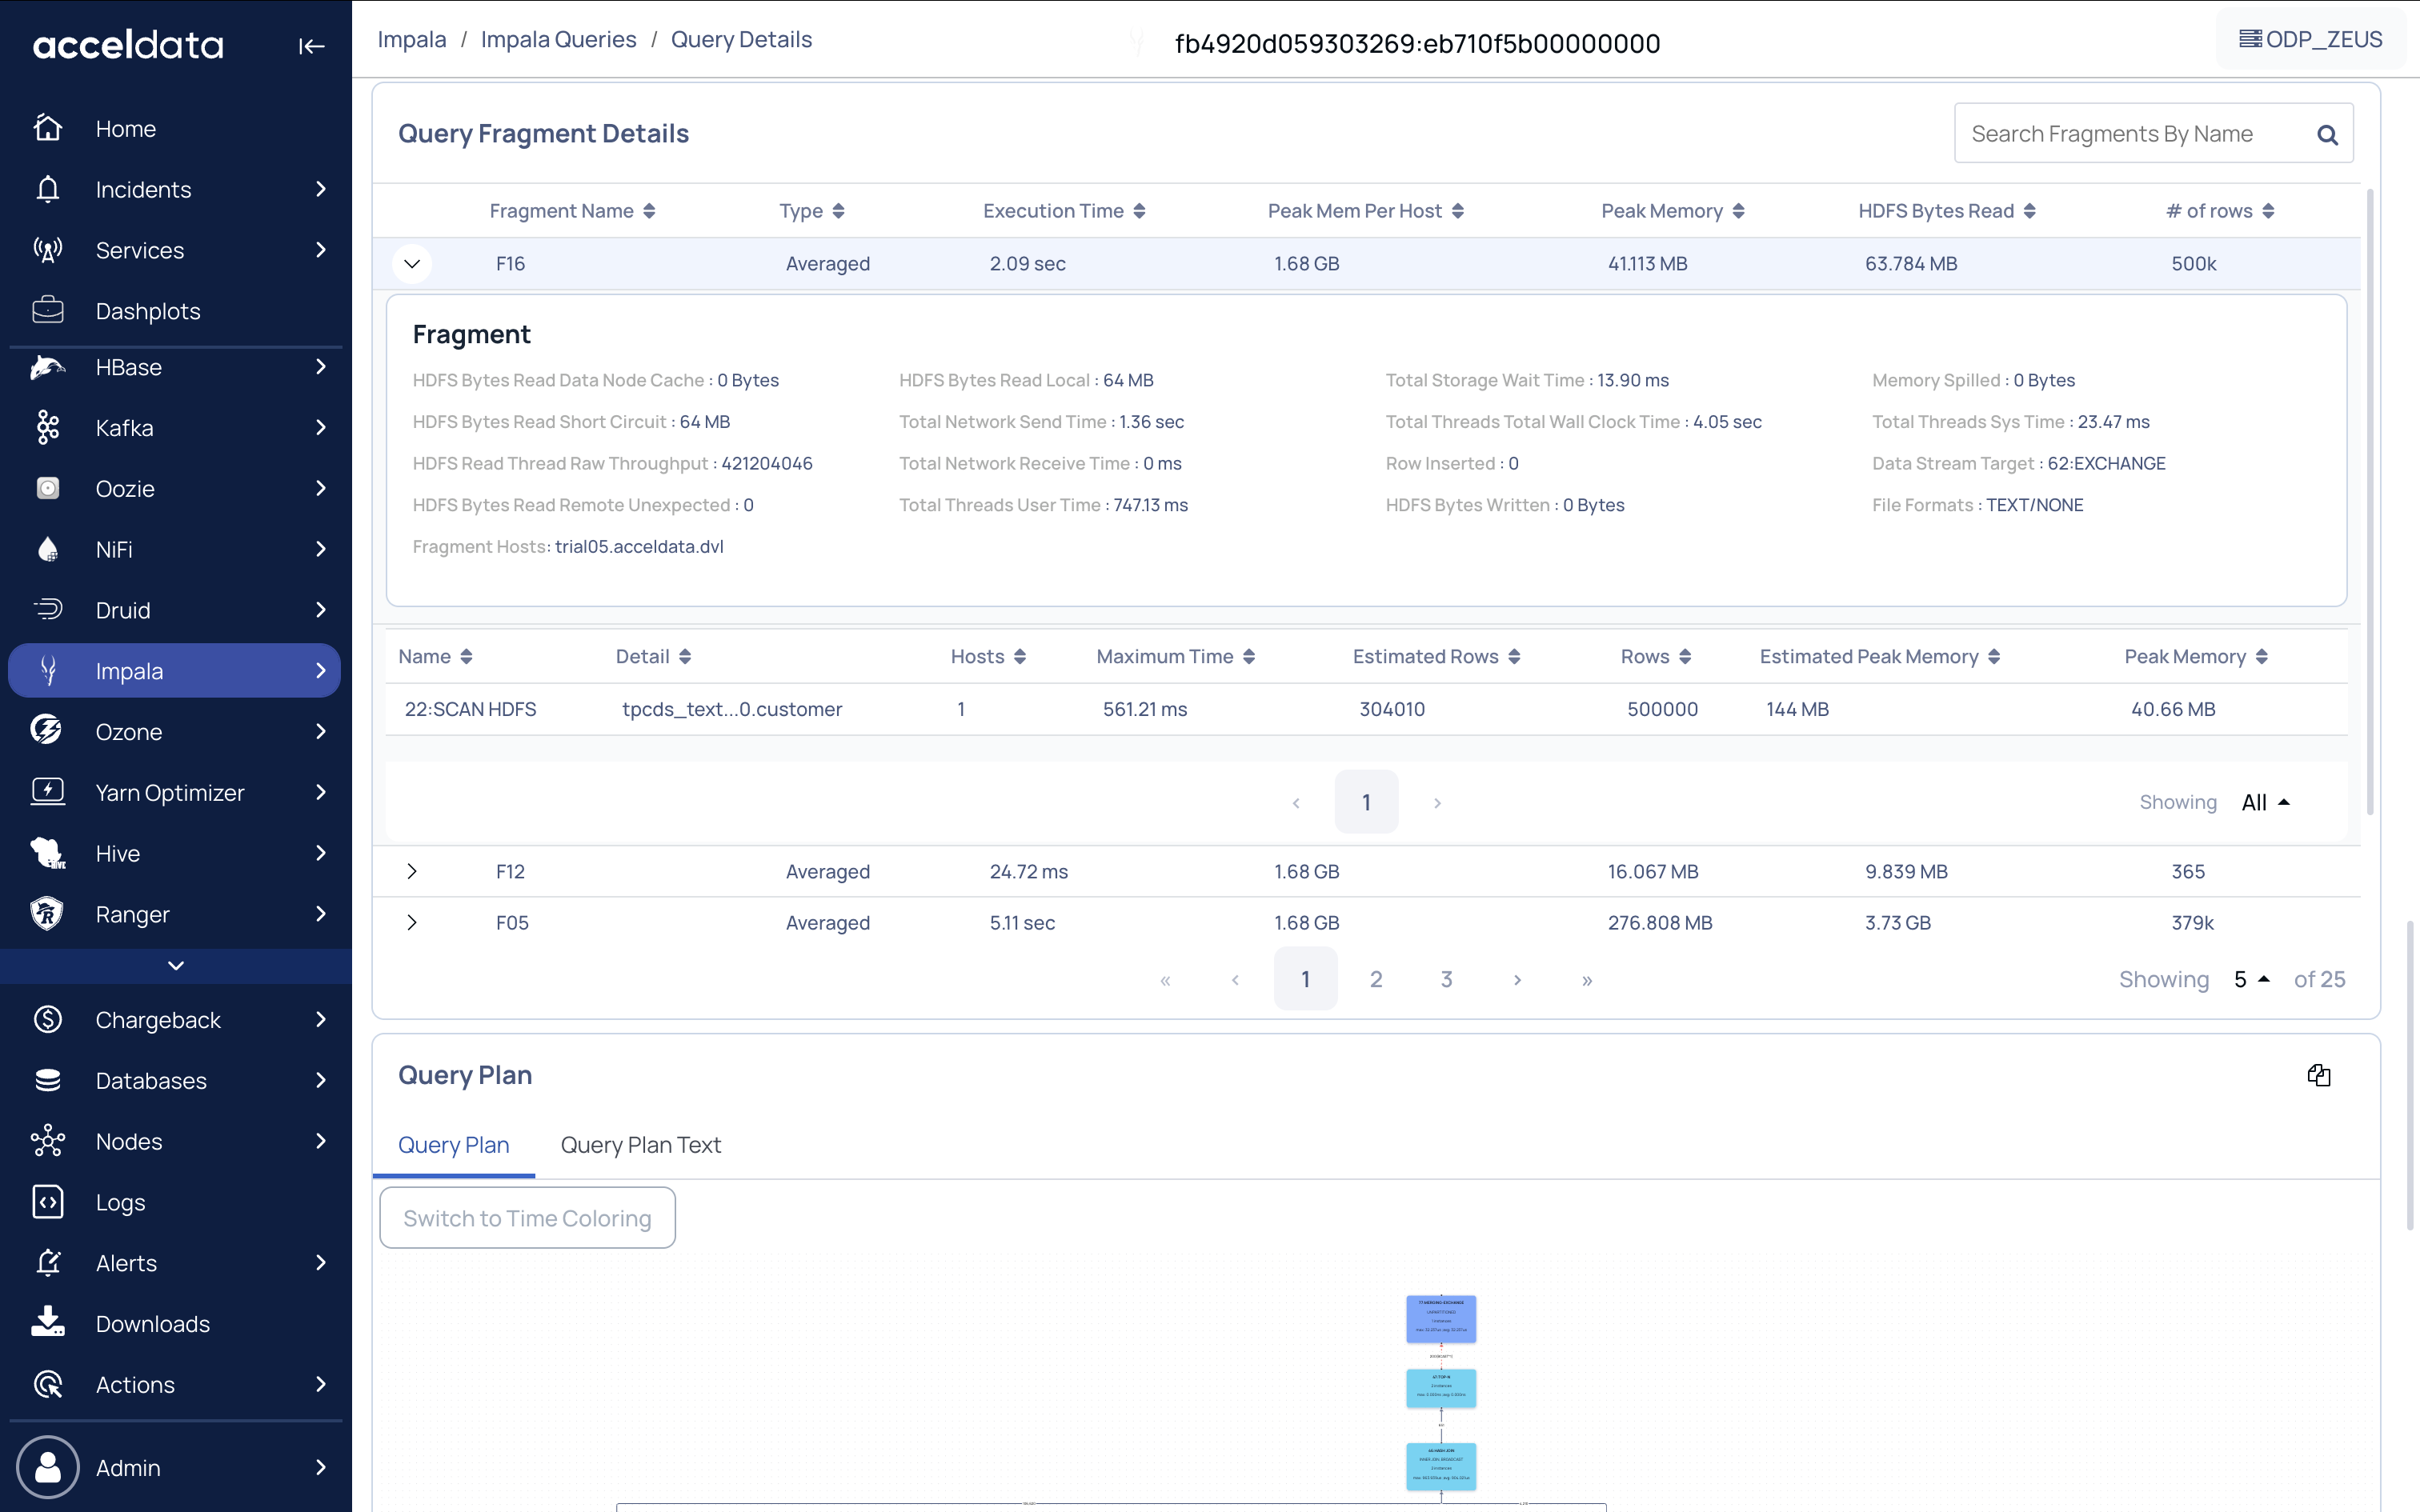
The Query Plan displays a pictorial representation of the query. You can also view the text of the fragment or operators of the query in the Query Text tab.
The Impala DAG supports showing more than 100 nested child nodes.
The following actions can be performed:
To copy text, click the icon, A confirmation dialog box appears. Click Ok.
To hide the Query Plan panel click the hide icon, to show the panel, click .
To zoom in click and to zoom out click . Click Reset to return to the default view.
To view nodes according to the time spent, uncheck the Shaded according to plan fragment checkbox,