The YARN Optimizer Dashboard provides a comprehensive view of resource utilization before and after optimization. It helps you monitor cluster performance, track resource allocation improvements, and identify potential areas for further tuning.
You can use the dashboards to understand how the YARN Optimizer improves memory, CPU, and container efficiency across the cluster.
Access the Dashboard
- In the Pulse UI, select YARN Optimizer from the navigation menu.
The dashboard provides an overview of YARN resource optimization and cluster utilization.
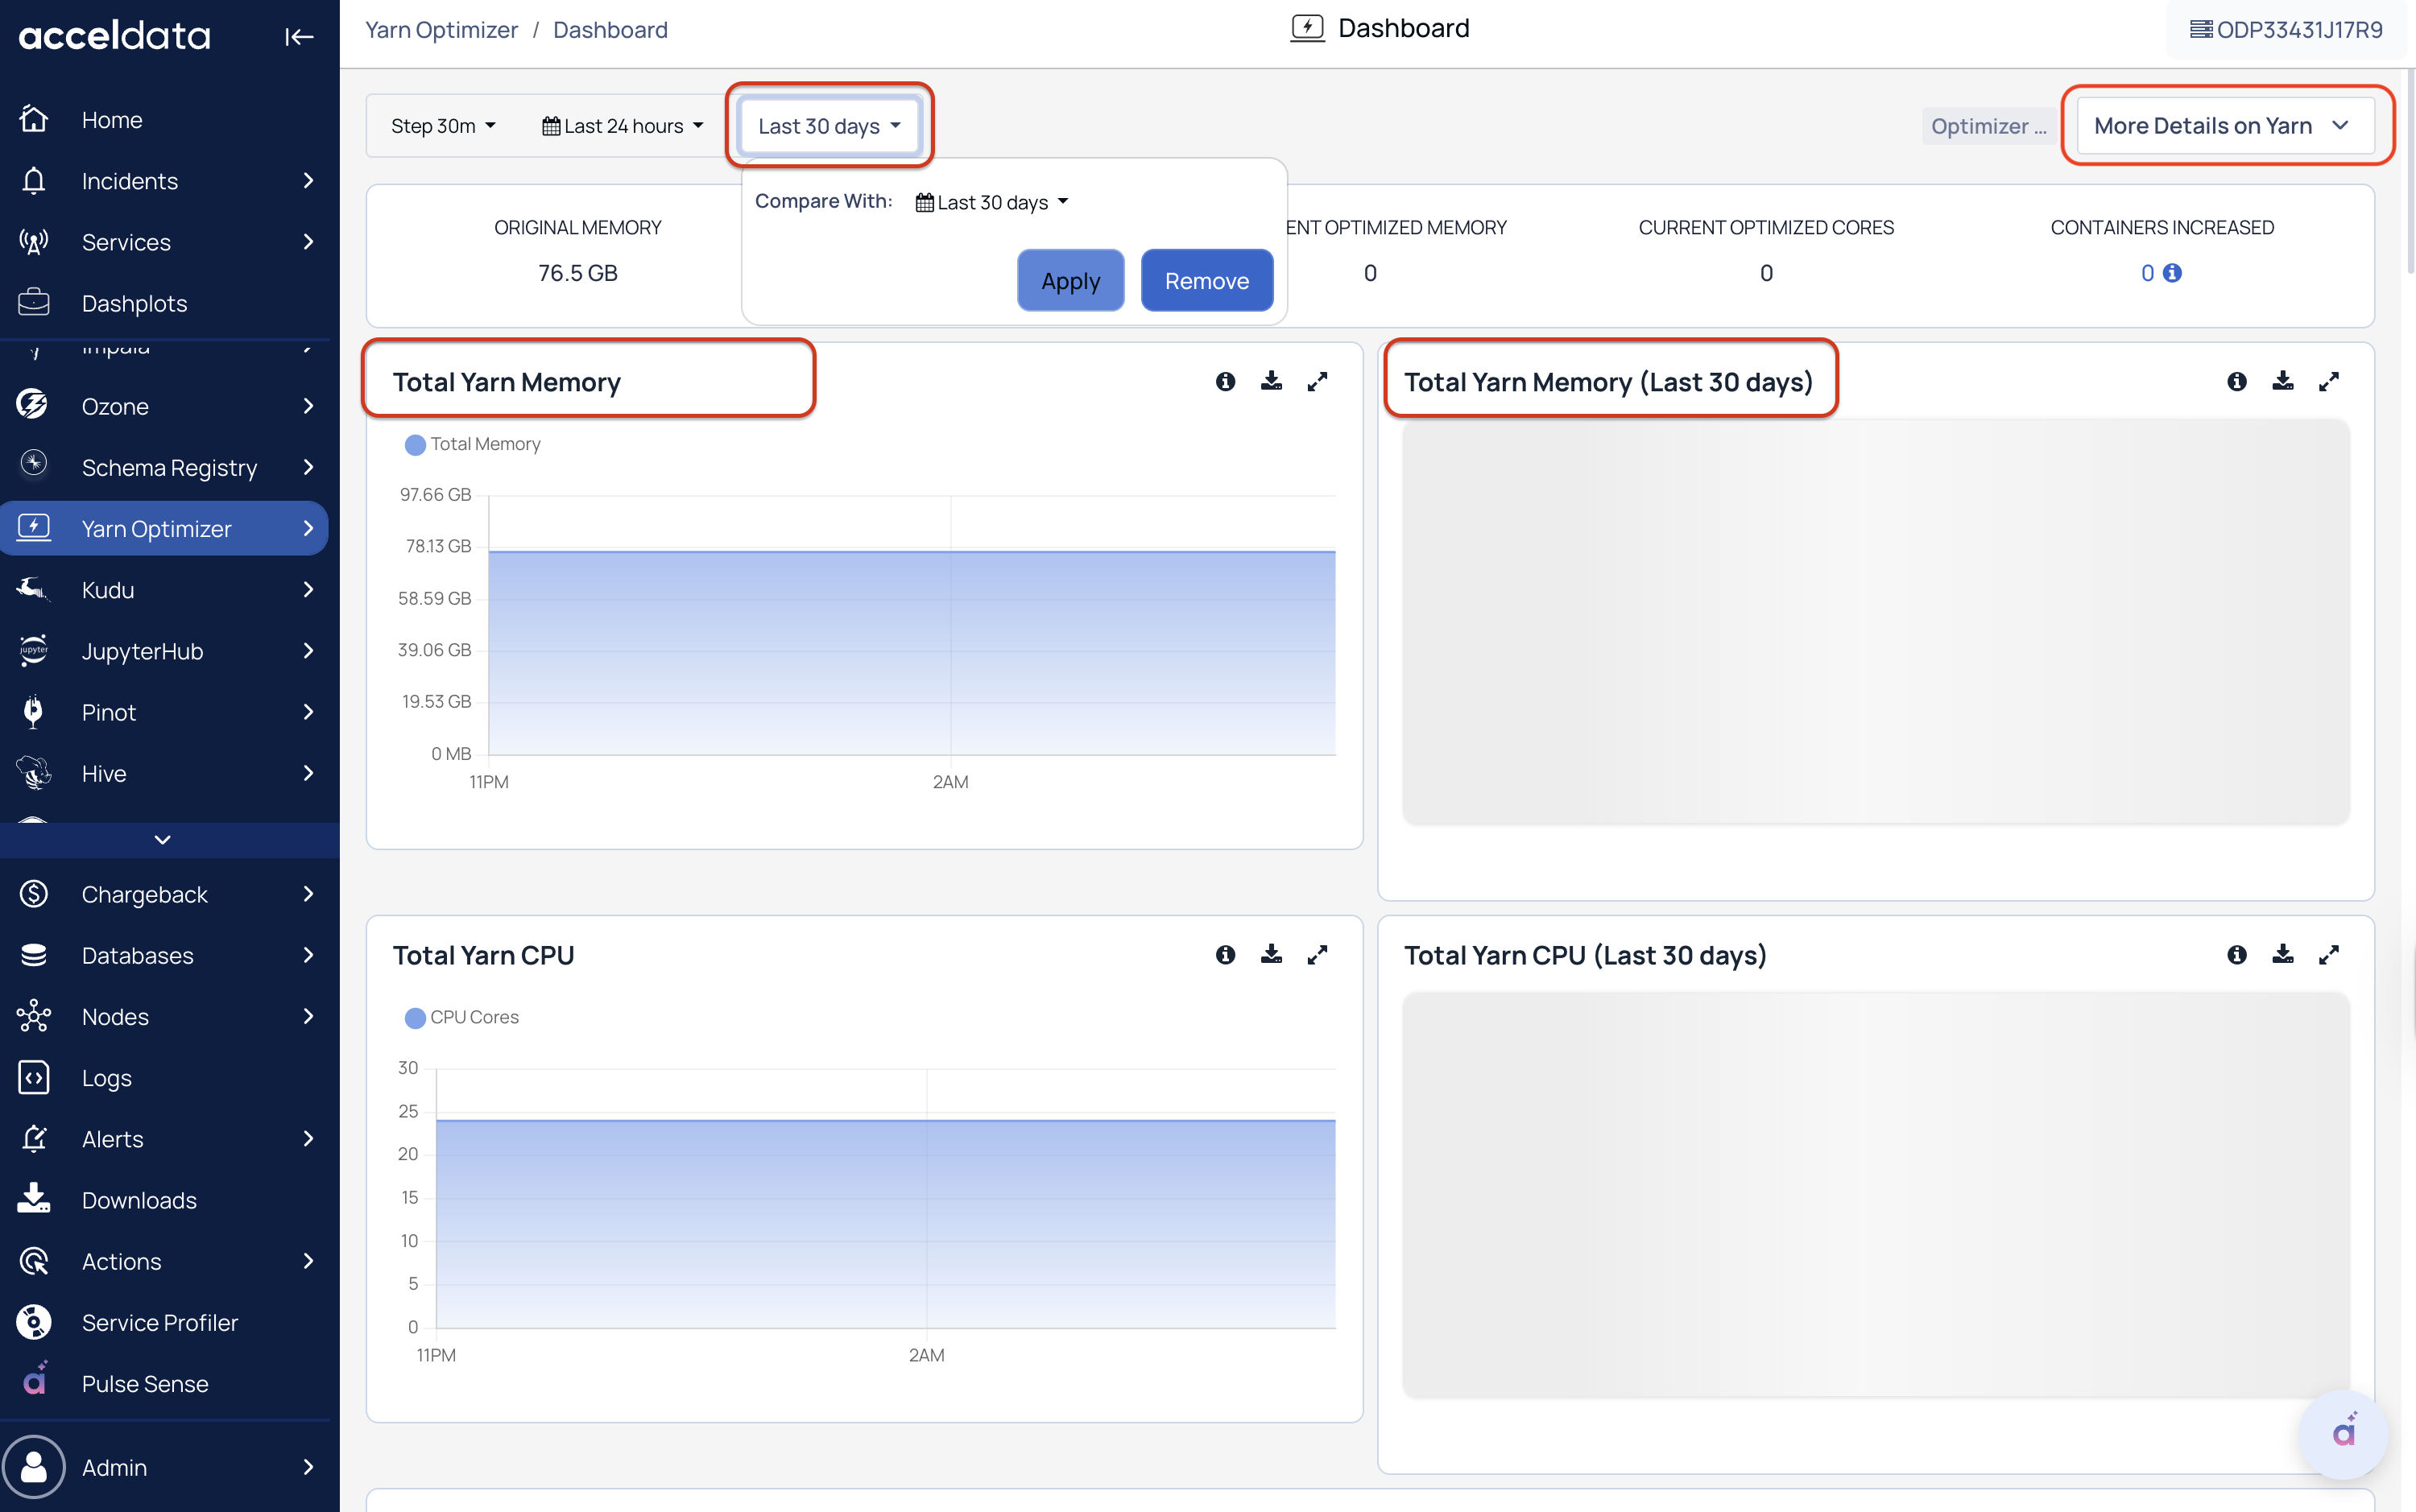
Update the Dashboard View
Use the following controls to customize the displayed data:
- Time Range – Select the period for which data is displayed.
- Step Interval – Adjust the data aggregation interval used in charts.
- Compare – Display current and historical resource utilization trends side by side.
View Additional YARN Details
Use the links on the dashboard to access related YARN views:
- Queue Summary – Opens the Queue Utilization Summary view on the YARN Capacity page. For details, see Queue Summary.
- YARN Summary – Opens the YARN Summary view and displays an overview of cluster memory and CPU utilization. For details, see Yarn Summary.
- Services – Displays YARN service health, status, and related metrics.
Summary Panel
The Summary Panel gives a quick comparison of cluster resources before and after optimization.
It highlights improvements in memory and core usage, along with container scaling details.
Displayed Metrics:
- Original Memory: Total memory assigned to YARN
- Original Cores: Total vCores assigned to YARN
The Original Memory and vCores (YARN) values shown in the Summary Panel include data only from nodes where the YARN Optimizer Agent is enabled. Nodes without the agent enabled are excluded from these calculations.
- Optimized Memory: Inflated or overcommitted memory beyond physically available memory after optimization
- Optimized Cores: Updated core allocation after optimization
- Containers Increased: Number of additional containers allocated due to optimization.
View Optimized Containers
- The Containers Increased metric displays the number of additional containers allocated as a result of optimization.
- Select the Containers Increased value to view the containers that were overcommitted or optimized.
Container Fingerprinting
- Pulse groups applications with the same configuration into a unique Fingerprint ID.
- If an application runs multiple times using the same configuration, each run receives a different Application ID, but all runs share the same Fingerprint ID.
Navigate to Container Details
- Select the Containers Increased value.
- View the list of fingerprints associated with the optimized containers.
- Select a fingerprint to view the related container activities.
The container details page displays information such as:
- Host name
- Fingerprint ID
- Application ID
- Allocated memory
This view helps identify all application runs that received additional containers due to optimization and groups them by configuration fingerprint.
Use this panel to assess the impact of optimization at a glance.
Charts
The Charts section provides detailed visualizations of how YARN resources are allocated, utilized, and optimized over time.
The Original Memory and vCores (YARN) values considered for calculation in these charts represent the totals for all nodes in the cluster, regardless of whether the YARN Optimizer Agent is enabled on those nodes.
Total YARN Memory
- Shows the total available YARN memory across the cluster.
- Calculation: Total YARN Memory = Original Memory + Optimized Memory
This helps you visualize memory scaling and utilization trends after optimization.
Total YARN CPU
- Displays the total number of YARN vCores in use.
- Calculation: Total YARN vCores = Original vCores + Optimized vCores
This chart shows how CPU capacity improves over time through optimization.
YARN Memory and CPU Overview
This chart provides a detailed visualization of how memory and CPU resources are distributed and allocated across the cluster.
The Original Memory and vCores (YARN) values shown in these charts include data only from nodes where the YARN Optimizer Agent is enabled. Nodes without the agent enabled are excluded from these calculations.
Memory Metrics
The Memory view shows how memory is utilized before and after optimization. It helps compare total capacity, YARN allocation, and actual usage to evaluate optimization efficiency.
Displayed Metrics:
| Chart | Description |
|---|---|
| Physical Memory | Total physical (hardware) memory available across all nodes. Example: 5 nodes × 100 GB each = 500 GB total. |
| Original YARN Memory | Total memory assigned to YARN before optimization. Example: 80 GB per node × 5 nodes = 400 GB. |
| Allocated Memory | Portion of YARN memory assigned to running containers or workloads. Example: 5 containers × 1 GB = 5 GB allocated. |
| Memory Used | Actual memory consumed by active containers. Example: 5 containers use 200 MB each → 1 GB total used. |
| New Memory (Total Memory): | Combined total of Original YARN Memory and additional optimized (overcommitted) memory available after optimization. |
This view helps identify how much of the allocated YARN memory is truly utilized and how optimization increases the effective memory pool through overcommitment.
CPU Metrics
To view CPU resource distribution, click the CPU tab on the right side of the chart.
Displayed Metrics:
| Chart | Description |
|---|---|
| Physical CPU Cores | Total number of physical CPU cores available across all nodes. Example: 5 nodes × 16 cores each = 80 cores total. |
| Original Cores | Total CPU cores allocated to YARN before optimization. Example: 12 cores per node × 5 nodes = 60 cores. |
| Allocated Cores | Number of CPU cores currently assigned by YARN to active jobs or containers. Example: 5 running containers × 1 core = 5 cores allocated. |
| CPU Used | Actual CPU utilization by running workloads in real time. Example: Out of 5 allocated cores, only 2 cores are actively used = 40% CPU usage. |
| New Cores (Total Cores) | Combined total of Original Cores and any optimized (overcommitted) cores available after optimization. |
This view helps identify how much of the allocated YARN memory is truly utilized and how optimization increases the effective memory pool through overcommitment.
Cluster Application Details
Shows the overall health and state of cluster workloads over time.
Categories Displayed:
- Running
- Pending
- Completed
- Failed
- Killed
This view helps you monitor workload stability and performance trends post-optimization.
CPU Utilization
Displays cluster CPU utilization over time.
- Peak CPU Utilization – Highest percentage of vCores used during the selected interval.
- Avg CPU Utilization – Average percentage of vCores used during the selected interval.
- CPU Limit – Configured CPU capacity available to the cluster.
- Max CPU Limit – Maximum CPU capacity configured for the cluster.
Memory Utilization
Displays cluster memory utilization over time.
- Peak Memory Utilization – Highest amount of memory used during the selected interval.
- Avg Memory Utilization – Average amount of memory used during the selected interval.
- Min Capacity – Configured memory capacity available to the cluster.
- Max Capacity – Maximum memory capacity configured for the cluster.
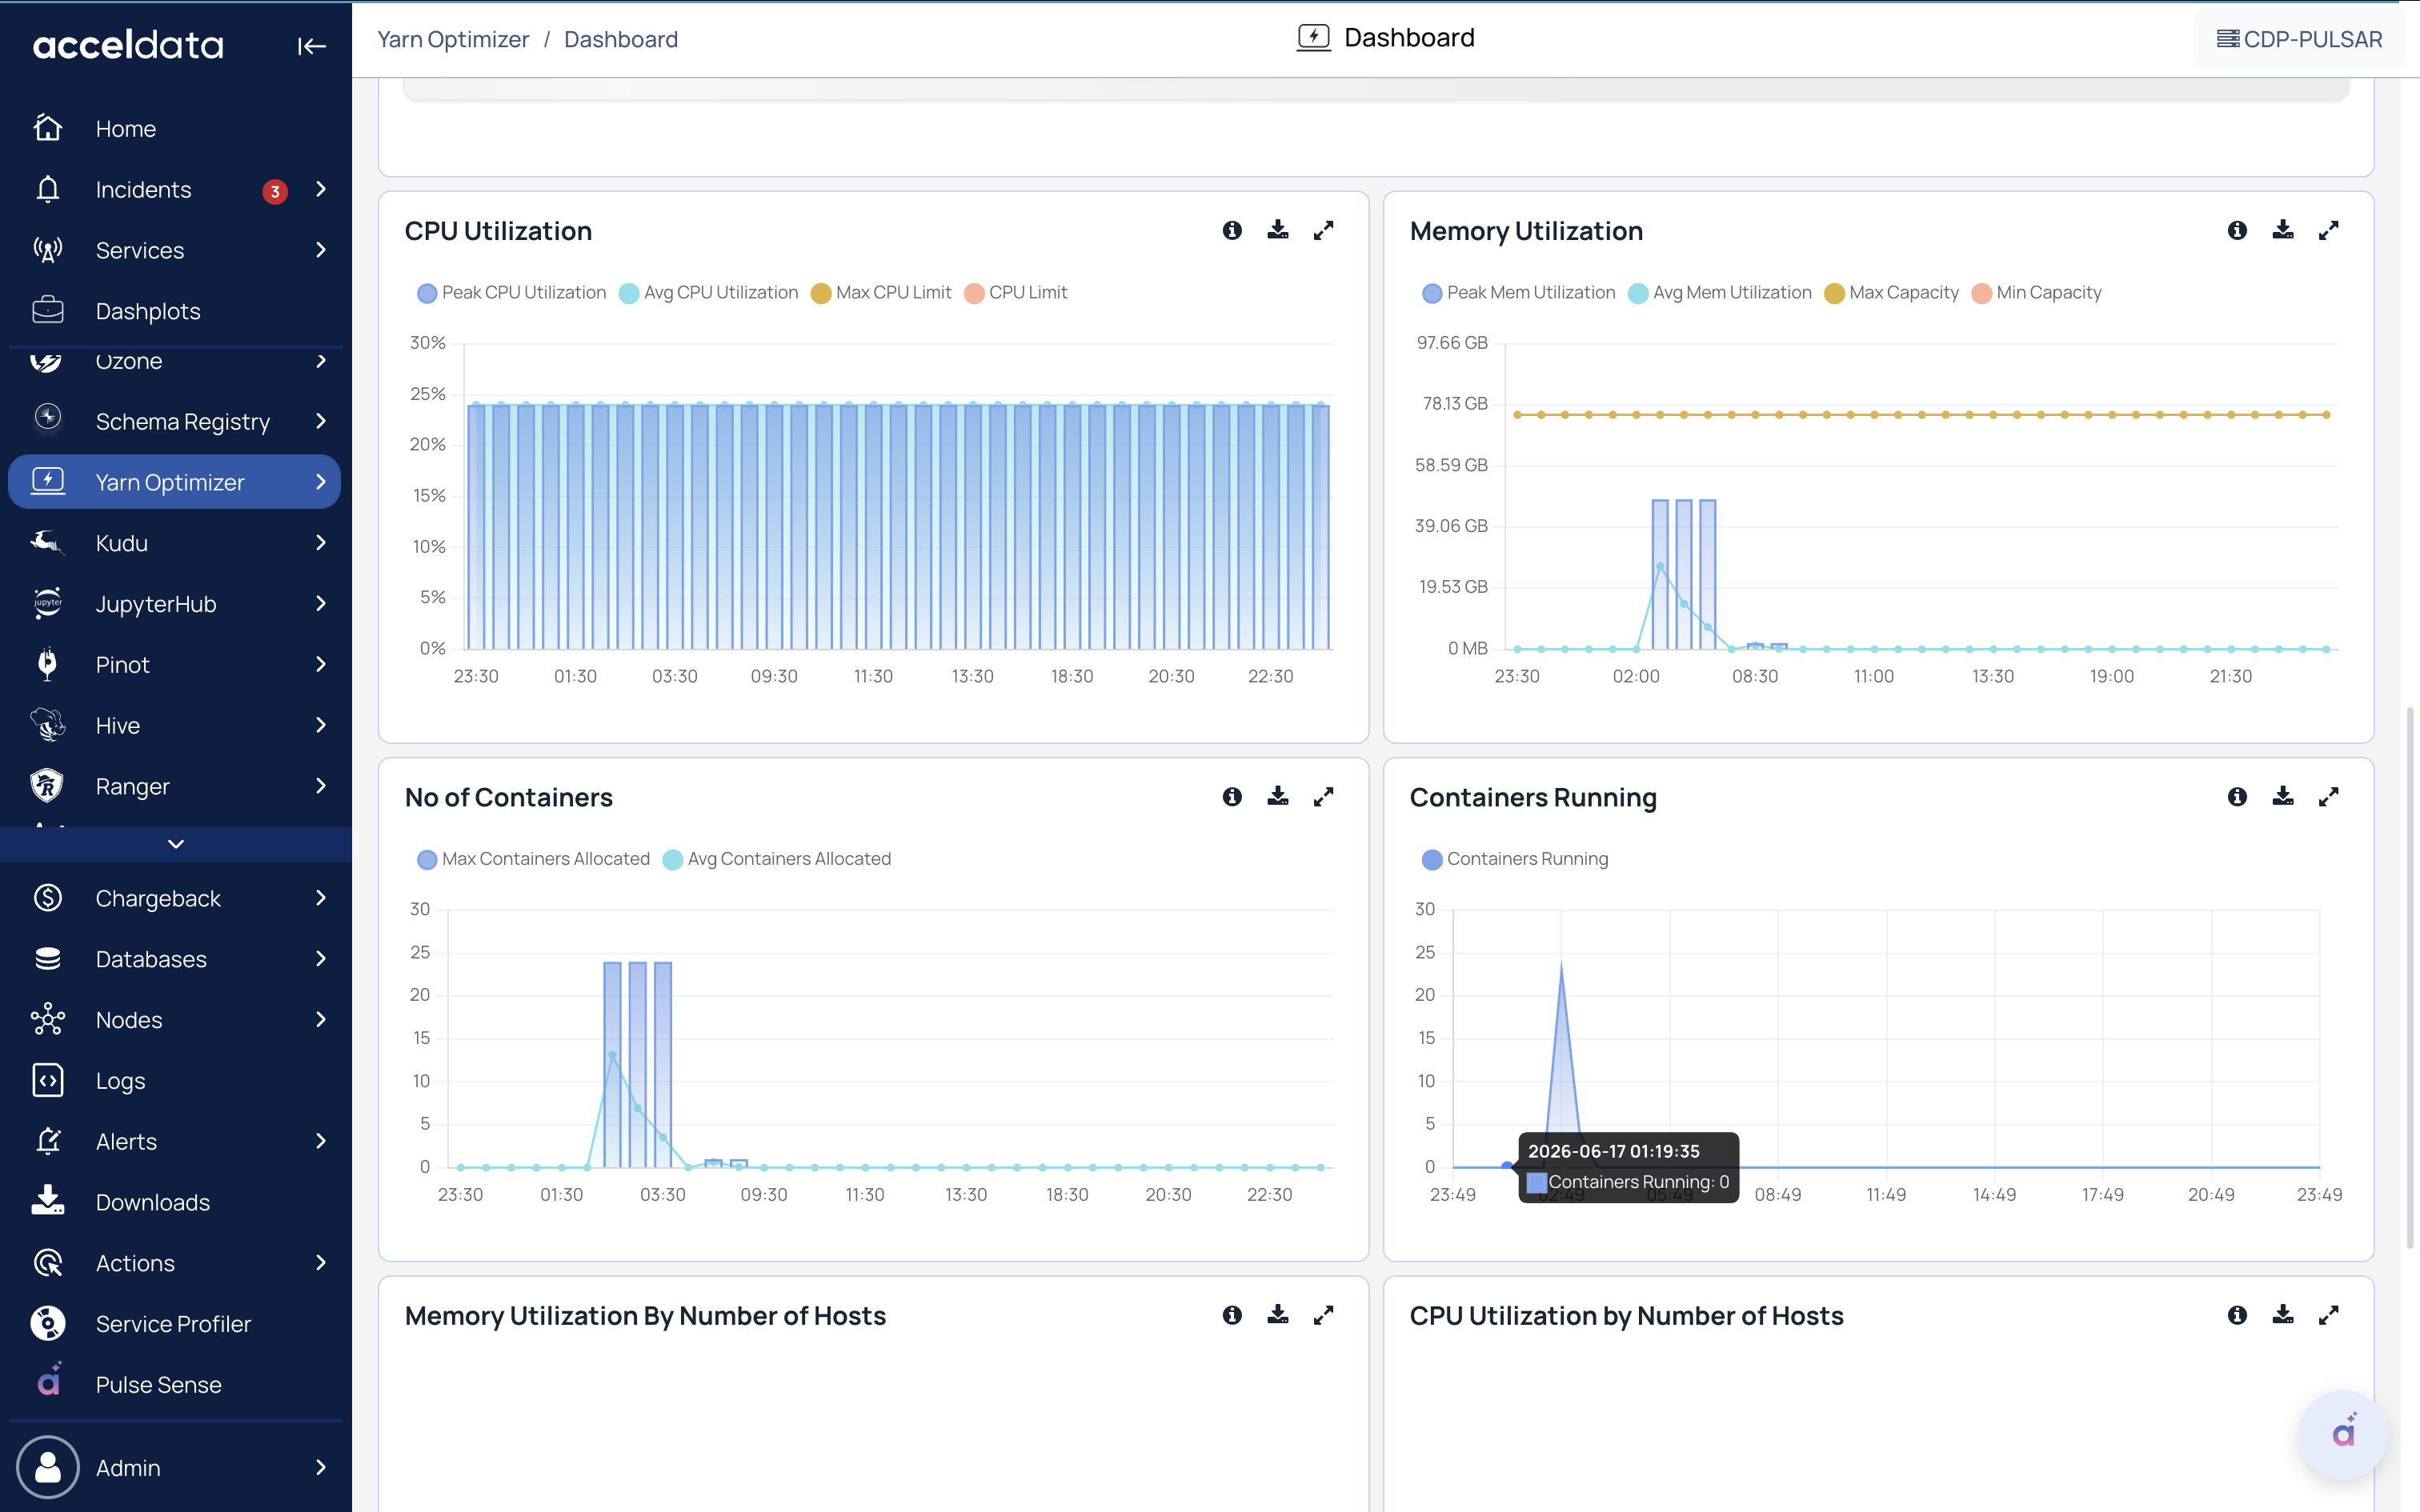
Number of Containers
Displays the number of YARN containers allocated over time.
- Max Containers Allocated – Highest number of containers allocated during the selected interval.
- Avg Containers Allocated – Average number of containers allocated during the selected interval.
Containers Running
Displays the number of running YARN containers over time.
- Max Containers Running – Highest number of running containers during the selected interval.
- Avg Containers Running – Average number of running containers during the selected interval.
Memory Utilization by Number of Hosts
Displays memory usage across all hosts in the cluster.
- Click any section of the pie chart to view detailed memory metrics for individual hosts.
- The visualization shows an increase in CPU utilization, memory usage, and container count after optimization.
- Click Expand › to view detailed node-level resource usage.
CPU Utilization by Number of Hosts
Displays CPU utilization across all hosts in the cluster.
- Click any section of the pie chart to view per-host CPU usage details.
- The visualization shows an increase in CPU utilization, memory usage, and container count after optimization.
- Click Expand › to view detailed node-level resource usage.
Host Details
The Host Details section provides host-level resource utilization and optimization information.
You can use the following filters to refine the displayed hosts:
- Utilization Type – Filter hosts based on resource type, such as CPU or Memory.
- Utilization Bucket – Filter hosts by utilization range:
- 0–45%
- 45–85%
- 85–100%
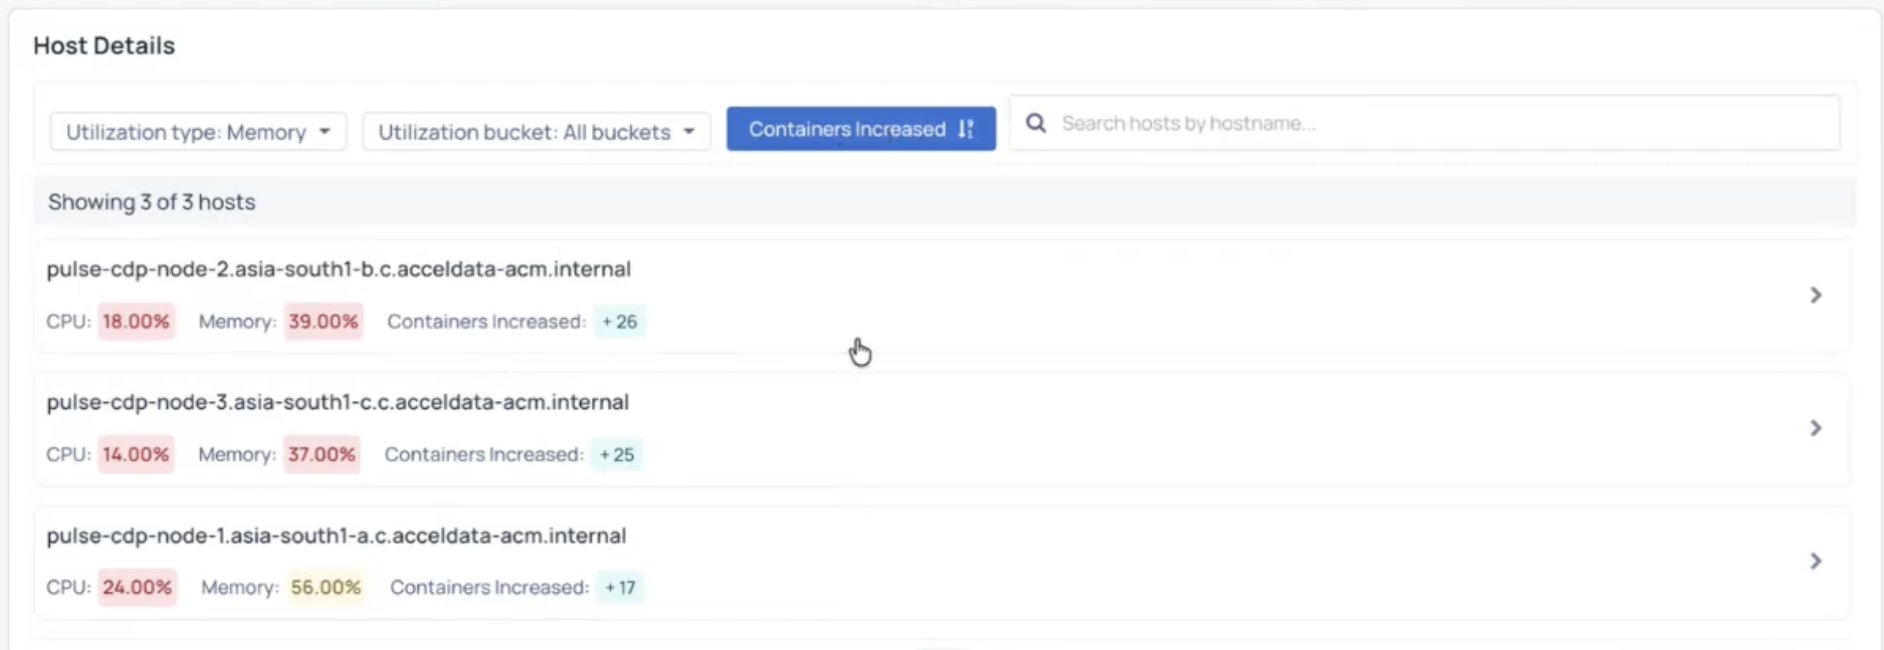
You can also:
- Select Containers Increased to sort hosts by the number of additional containers allocated through optimization. Hosts with the highest number of container increases appear first.
- Search for a specific host by entering the hostname in the search field.
View Host Details
Select a host to view detailed resource utilization and optimization information.
The host details page displays the following information:
- CPU – Current CPU utilization for the selected host.
- Memory – Current memory utilization for the selected host.
- Containers Increased – Number of additional containers allocated through optimization.
The page also includes the following charts:
- YARN Overview – Displays YARN resource allocation and utilization for the selected host. You can switch between Memory and CPU views.
- Optimized Memory – Displays memory optimization recommendations and potential memory savings for the selected host. You can switch between Memory and CPU views.
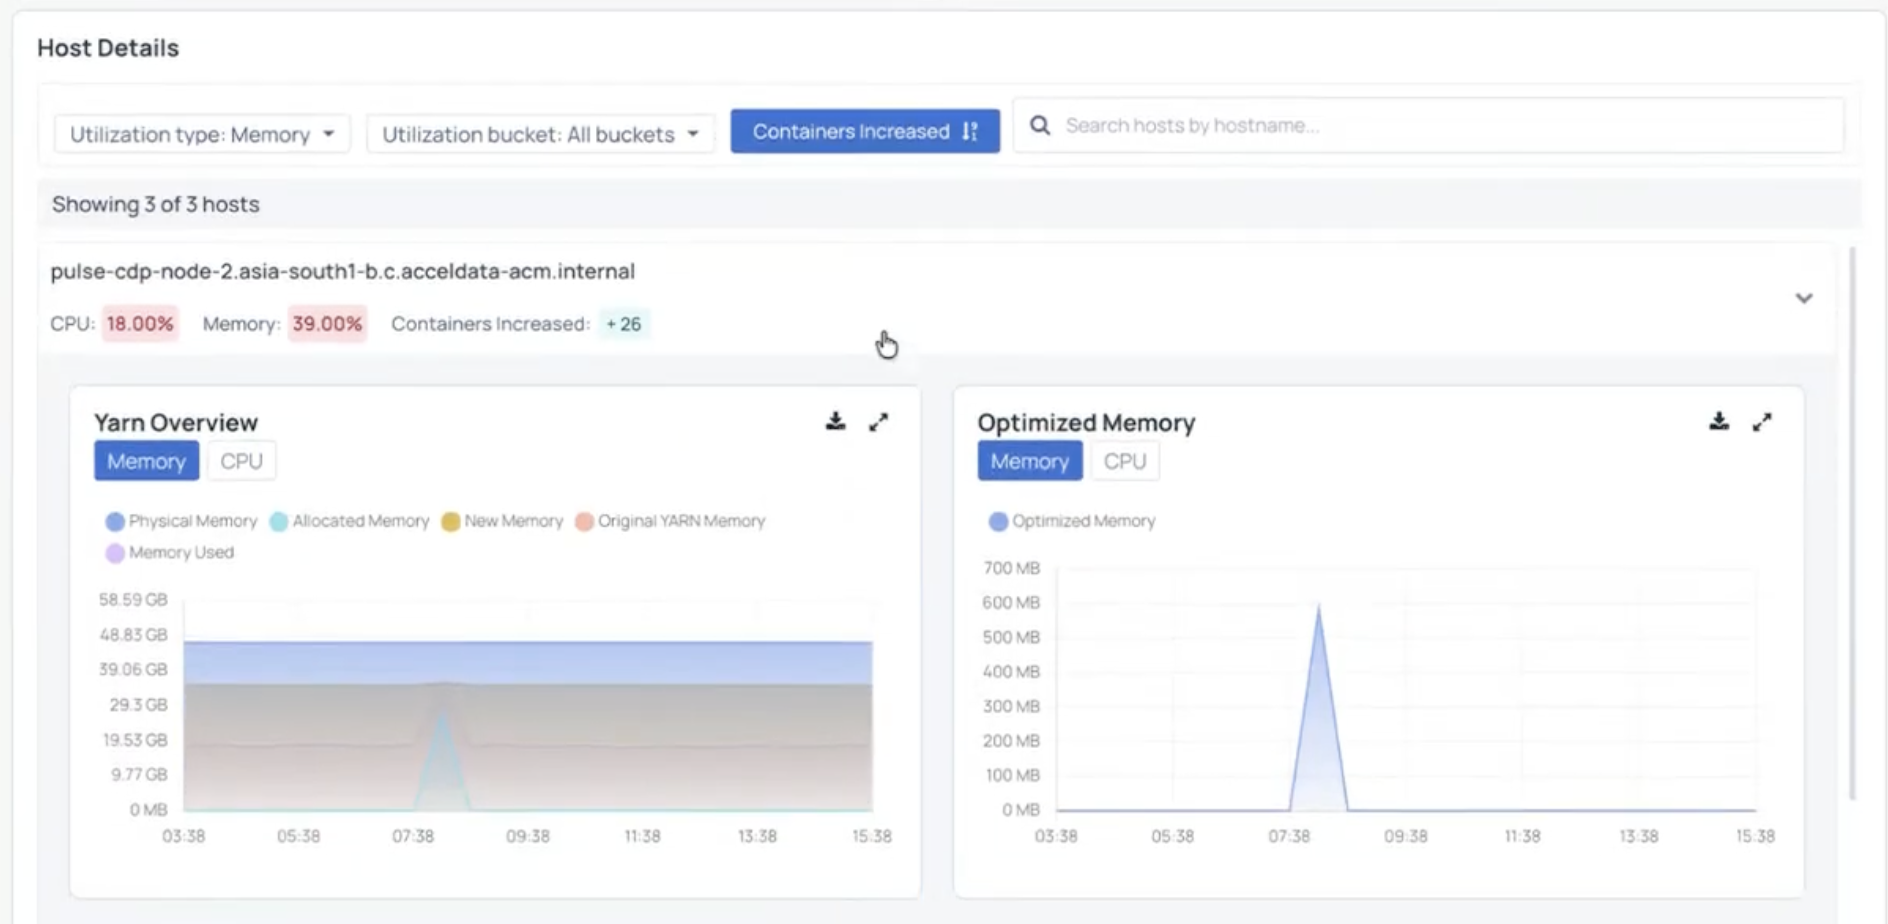
Use these charts to analyze host-level resource consumption and evaluate the impact of optimization recommendations.
Summary
The YARN Optimizer Dashboard provides a unified, visual view of how cluster resources are utilized and optimized.