Create Custom Monitors
The Monitors page displays a list of all the monitors you have created and imported from the store. The following table displays the details of the monitors list page:
To access the Monitors list page, navigate to Compute in the left pane and select Monitors.
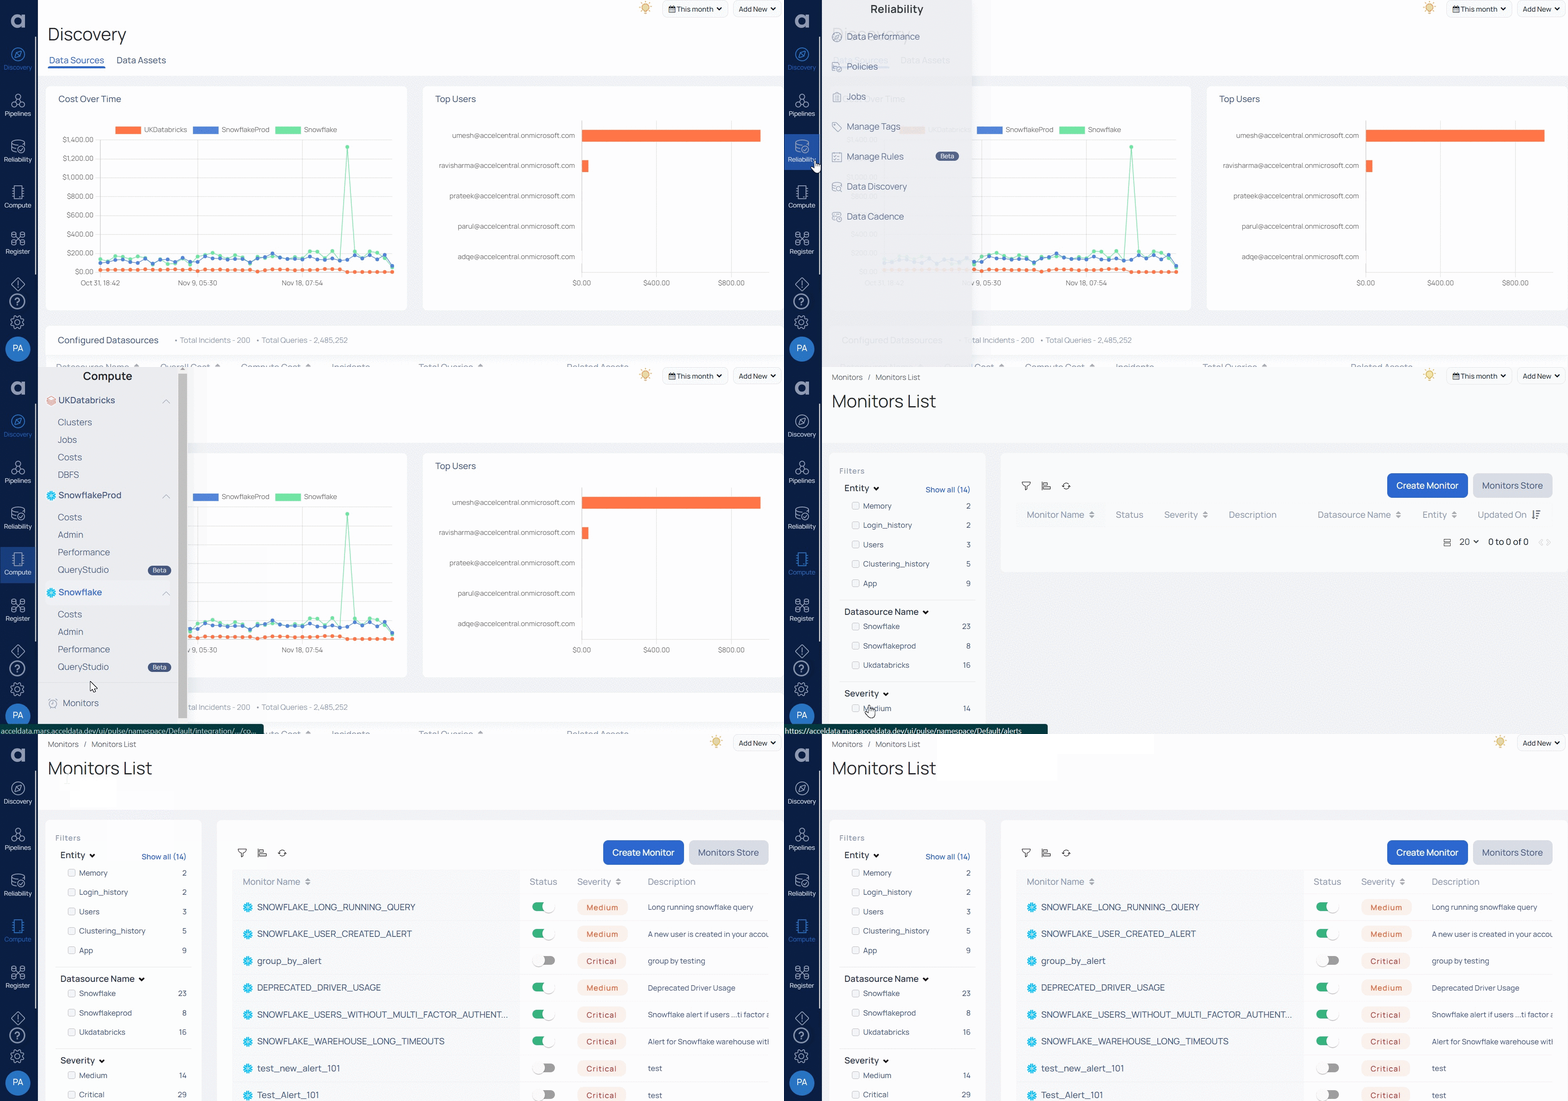
The Monitors List page has a table. The table displays the following columns.
| Details | Description |
|---|---|
| Monitor Name | Displays the name of the monitor. This column is frozen. When you scroll to the right, you can still view this column. |
| Enabled | Displays the status of monitor whether it is enable or disabled. |
| Severity | Displays the severity of the monitor i.e., Critical, High, Medium or Low. |
| Description | Displays the description of the monitor. The description content is the same as provided by you while creating the monitor. |
| Data source Name | The Data source to which the monitor belongs to. If you have created multiple instances in a single data source, data source instance name is displayed. |
| Entity | The entity within the data source, for which the monitor was created. |
| Updated On | The last date and time when the monitor was updated. |
| Updated By | The user who has updated the monitor. |
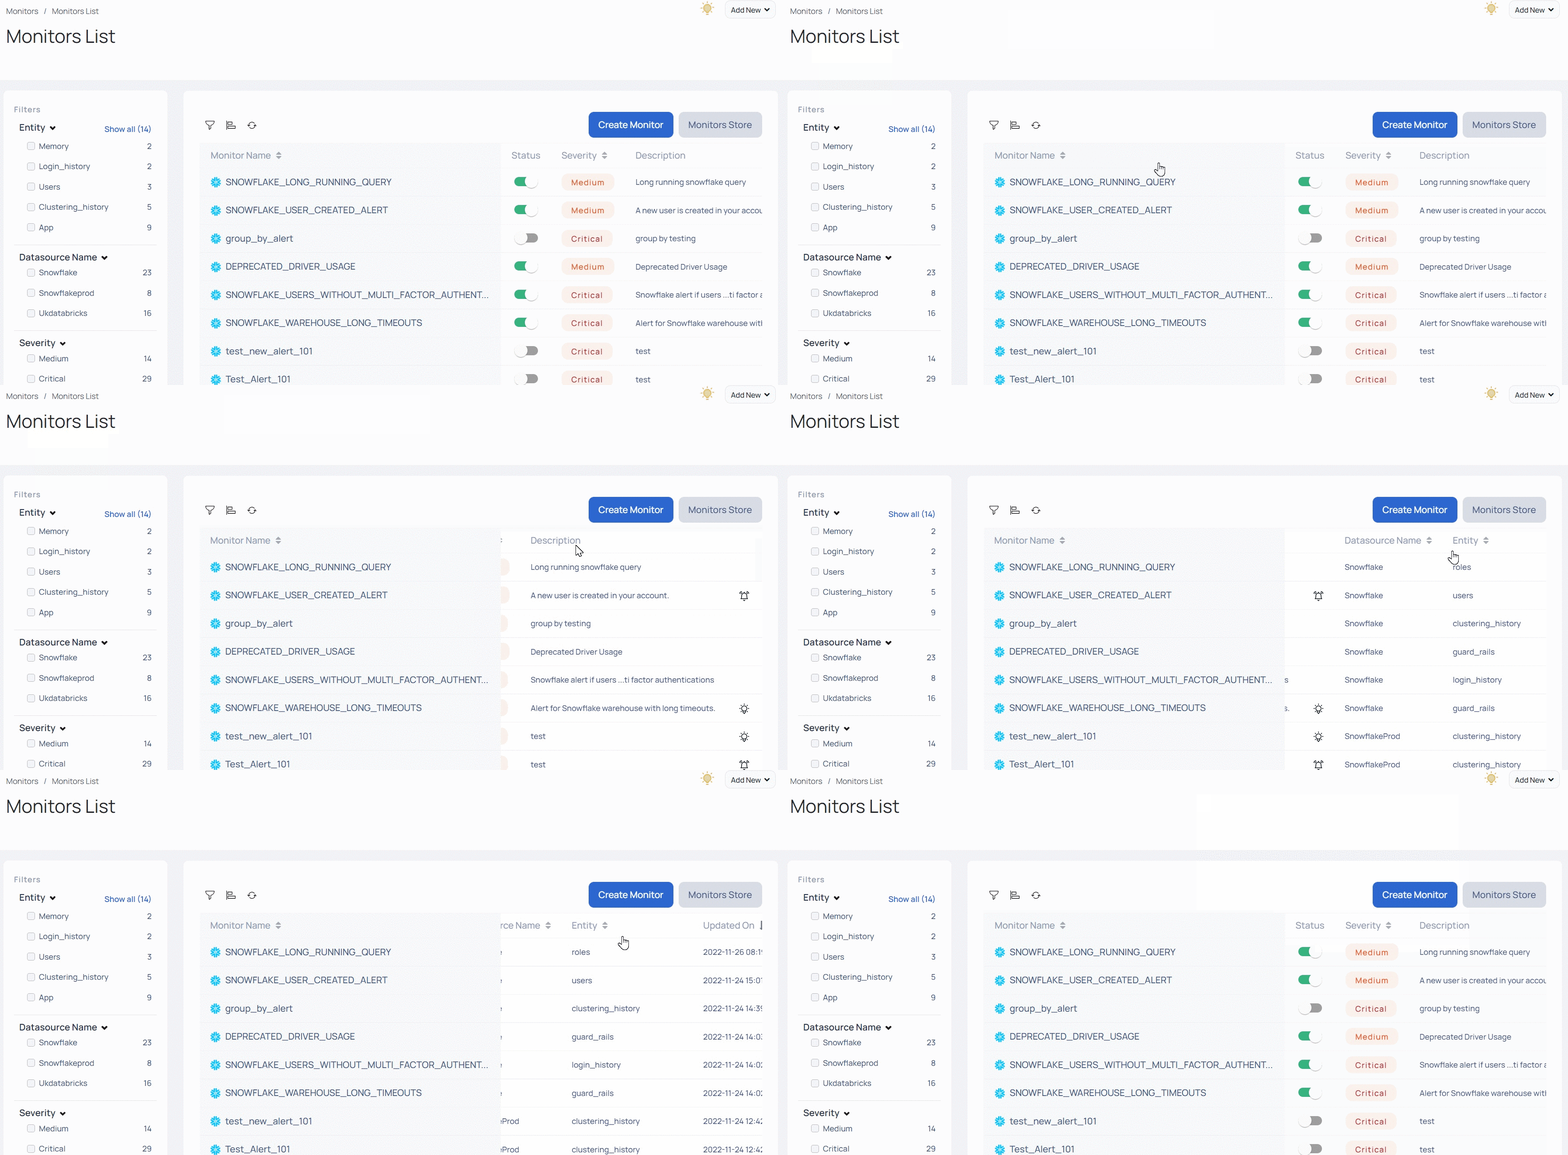
While scrolling on the Monitor columns you can view the details like help text (if mentioned) on a monitor, and number of notification channels set on a monitor.
What other operations can I perform on Monitors?
The various operations that you can perform on monitors are as follows.
- Sorting Monitors
- Filtering Monitors
- Refreshing Monitors
- Activation and Deactivation of Monitors
- Editing and Deleting Monitors
- Cloning a Monitor
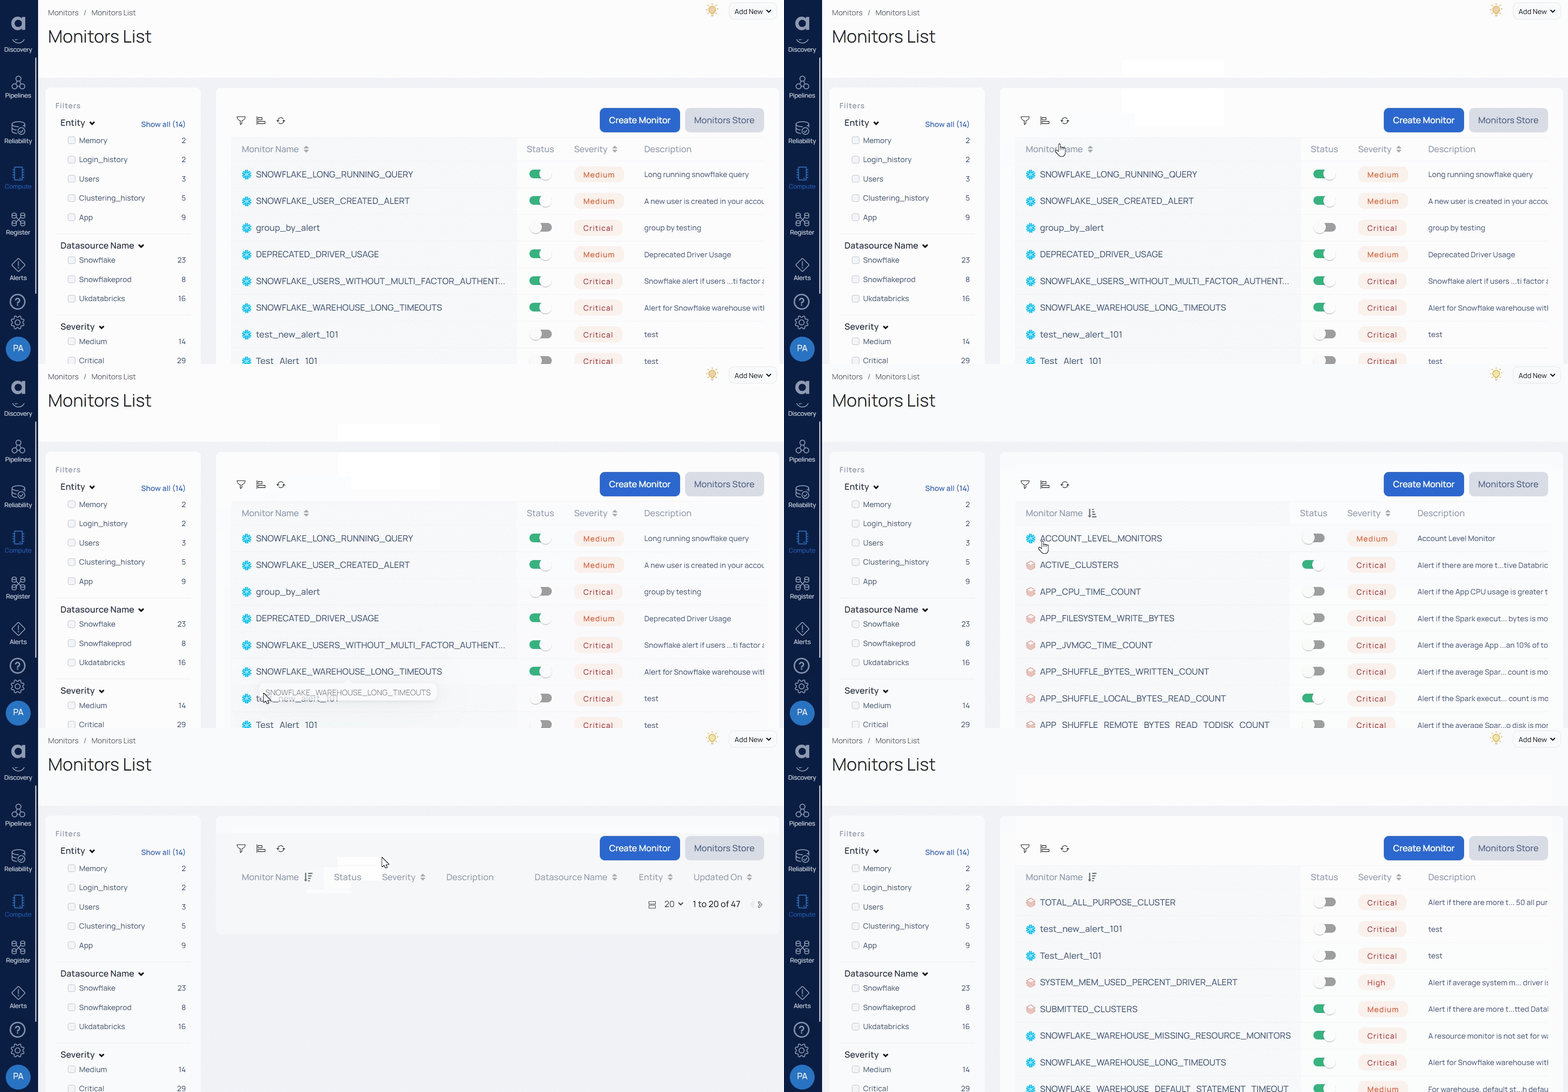
Sorting Monitors
Click the icon
Filtering Monitors
ADOC provides you two filter options to filter the list of monitors.
Filtering using the Filter Icon
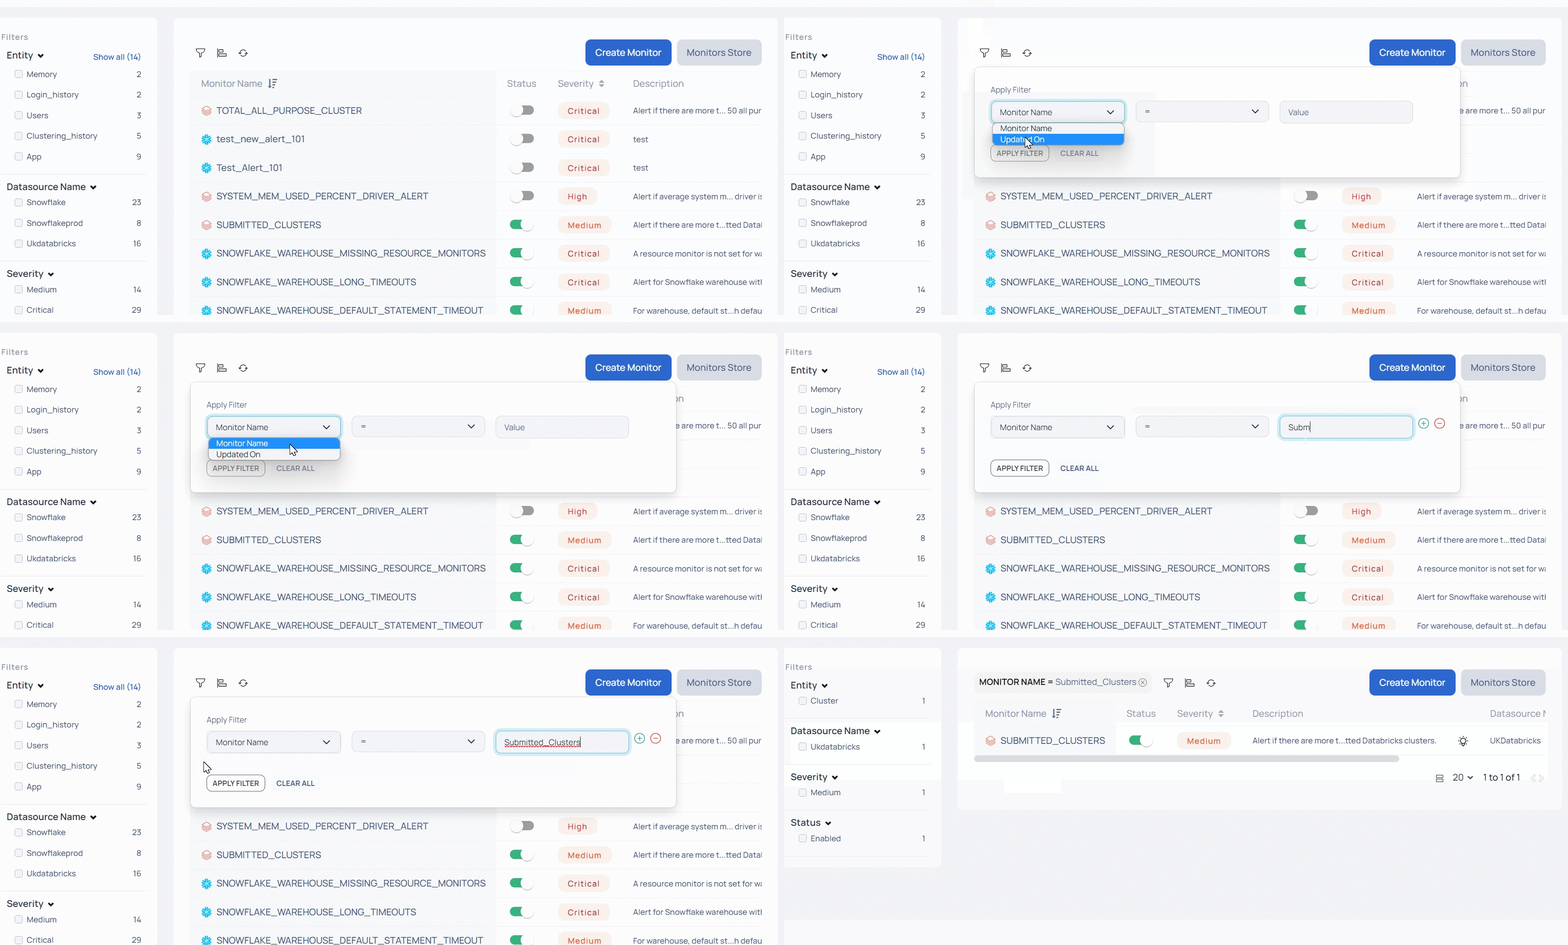
The filter option provides you five metrics to filter the monitors. The metrics are Monitor Name and Updated On. You can use the Monitor name filter to filter monitors by name and Updated On filter to filter monitors by their last updated date and time.
To filter monitors using the filter icon, perform the following steps:
- Click the
filter icon in the top right corner of the table. Apply filter dialog box is displayed. - Select the metric for which you want to apply the filter from the drop-down list of the Apply filter dialog box.
- Select the = expression from the drop down list.
- Enter the value in the value box.
- Click the Apply Filter button.
Filtering using the Left Pane Metrics
You can also use the metrics provided in the left pane to filter the data. The filter metrics provided by left pane are Entity, Data source Name, Severity, and Status.
To apply left pane filters, select the check box for the required filters. If you select multiple filters, the AND logical operation is performed between the filters.
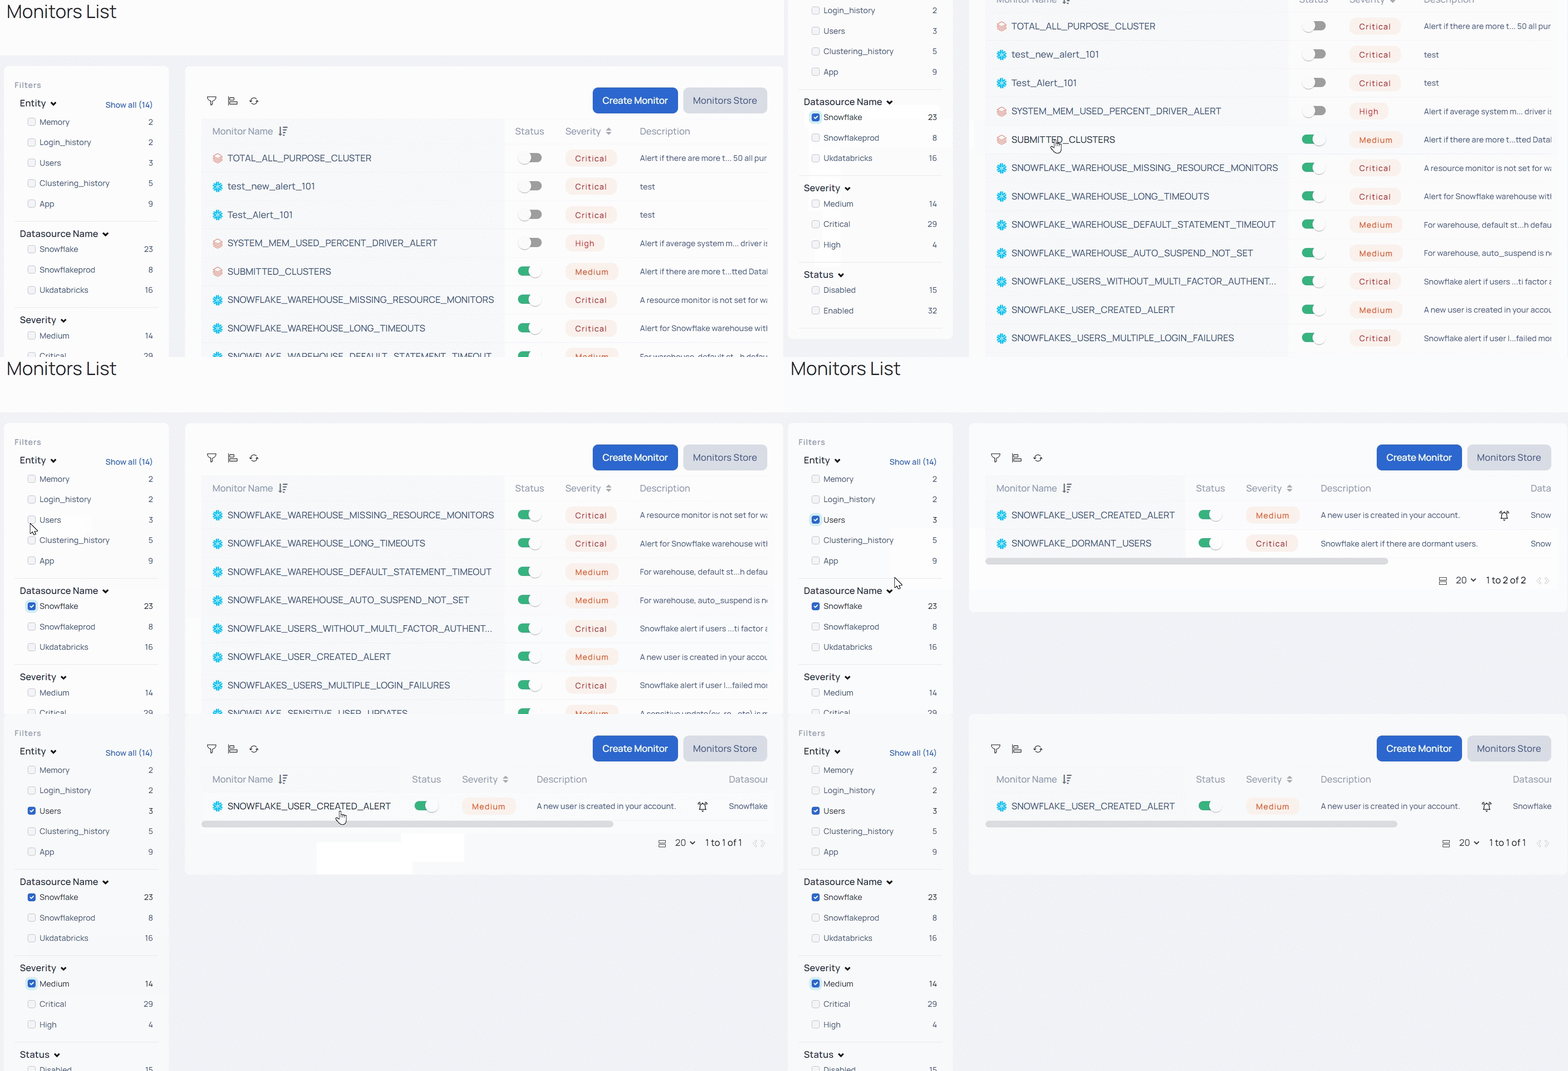
If you have applied filters using the filter icon, it is applicable to the left pane filters as well.
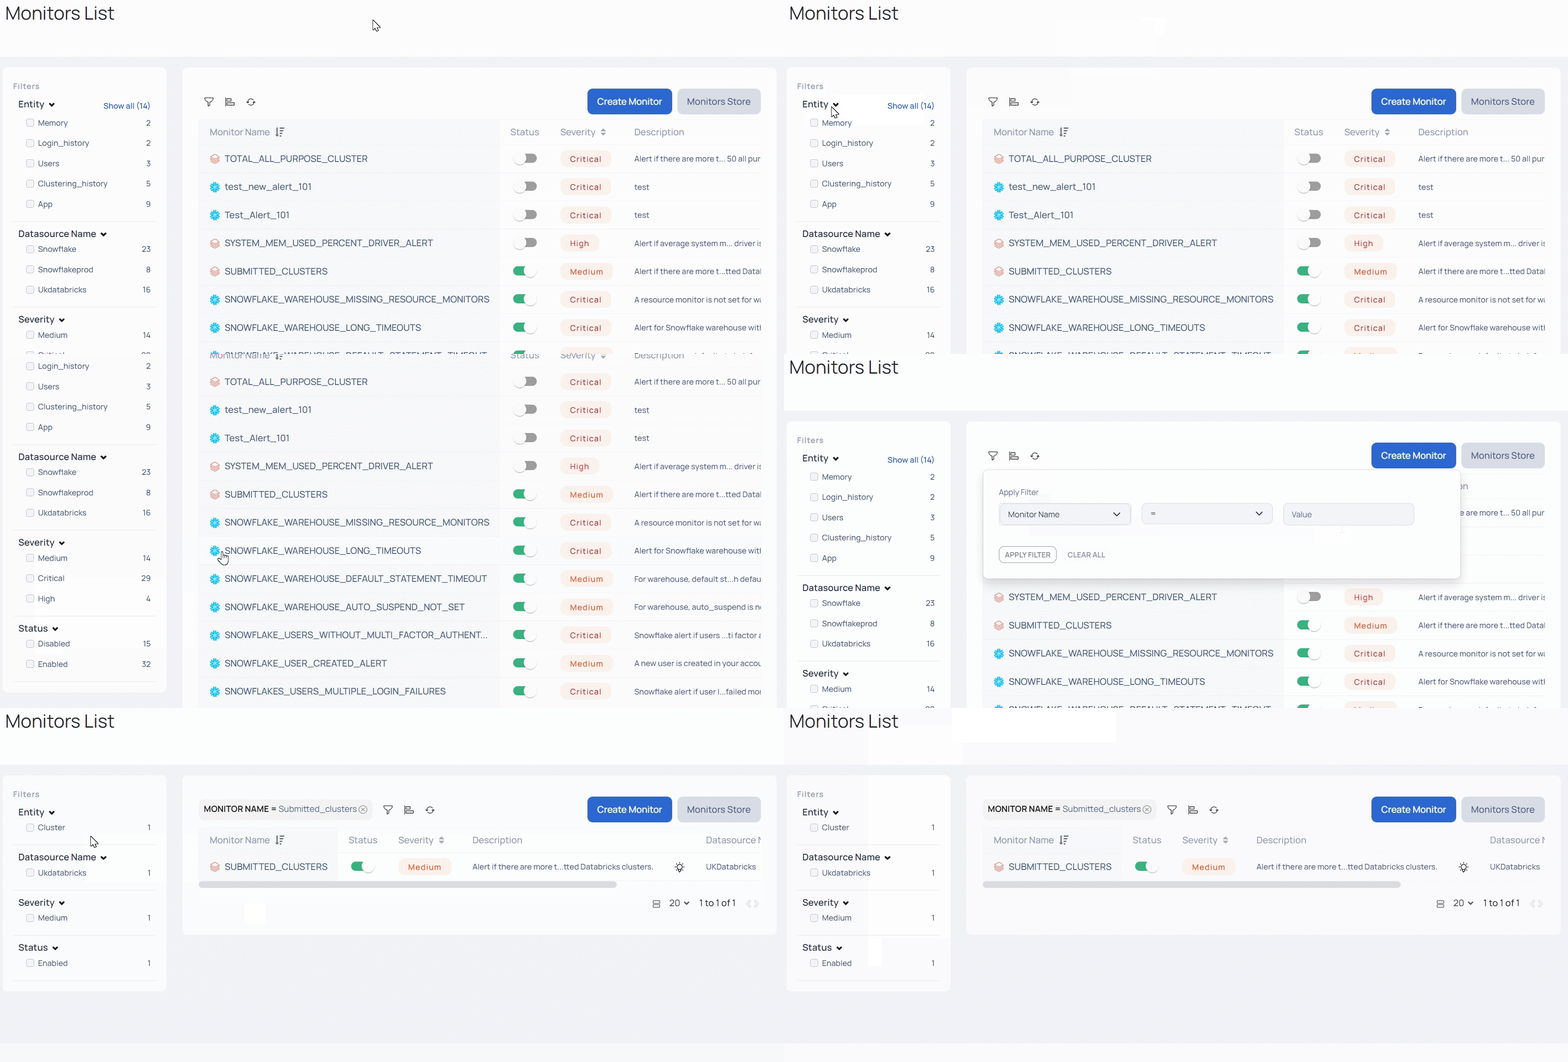
Refreshing Monitors
To see the most recent monitors, click
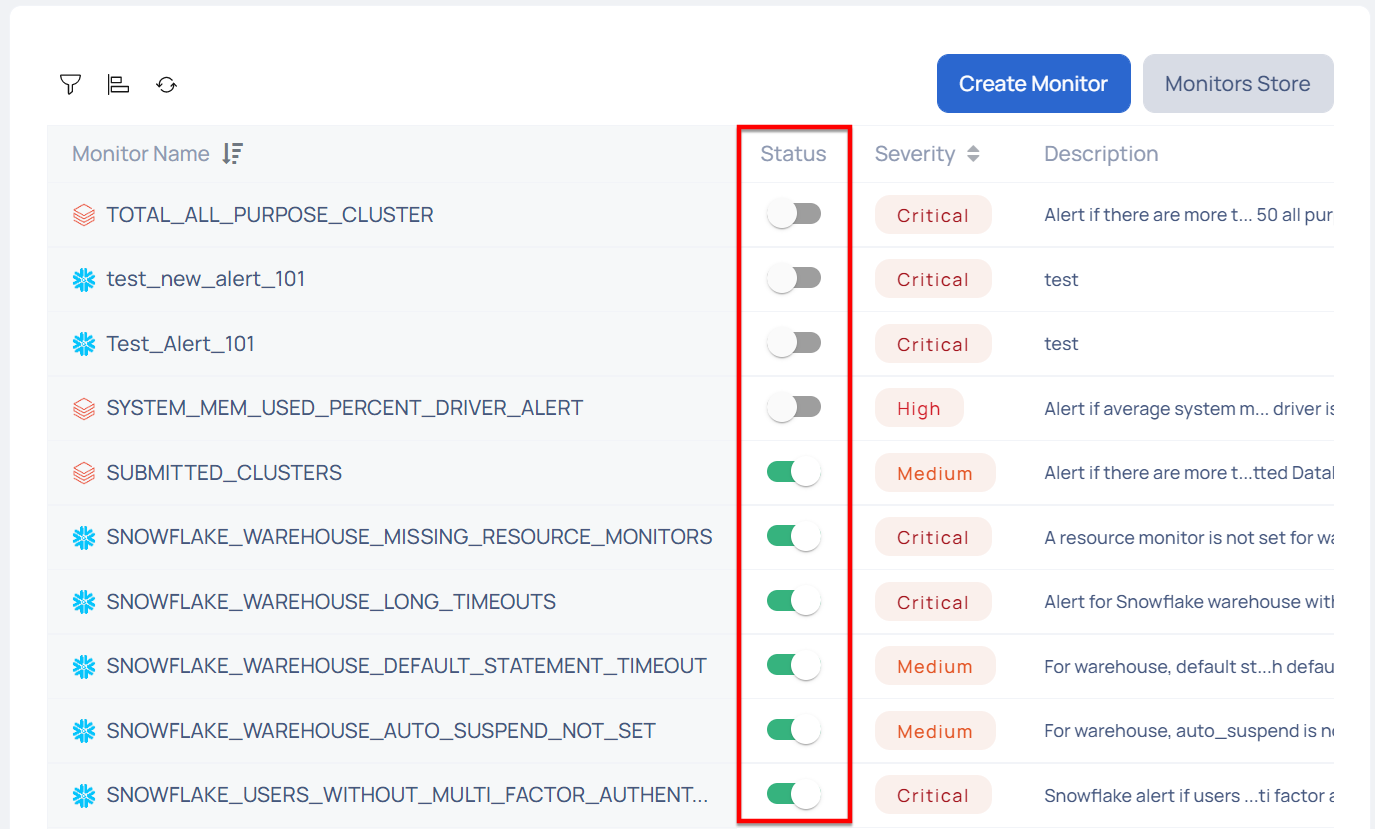
Activation and Deactivation of Monitors
You can activate and deactivate monitors by clicking the
Editing and Deleting Monitors
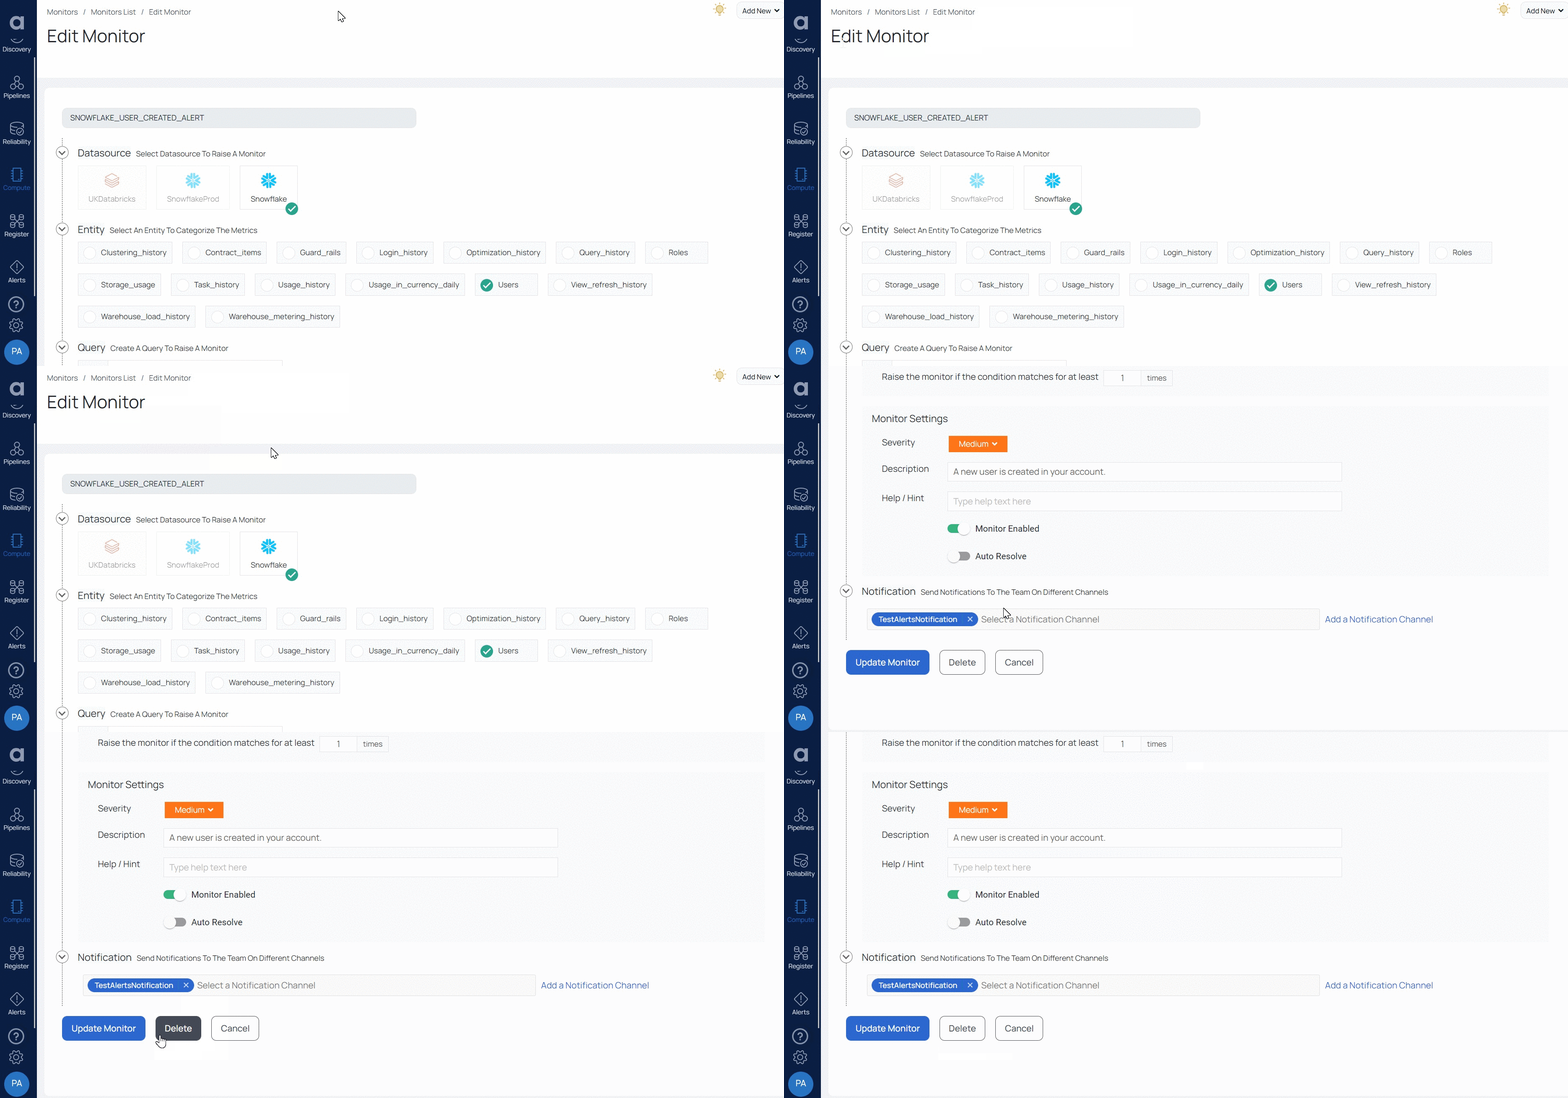
To edit a monitor, perform the following:
- Click the name of a monitor that you want to edit. The Edit Monitor page is displayed.
- Edit the parameters.
- Click Update Monitor.
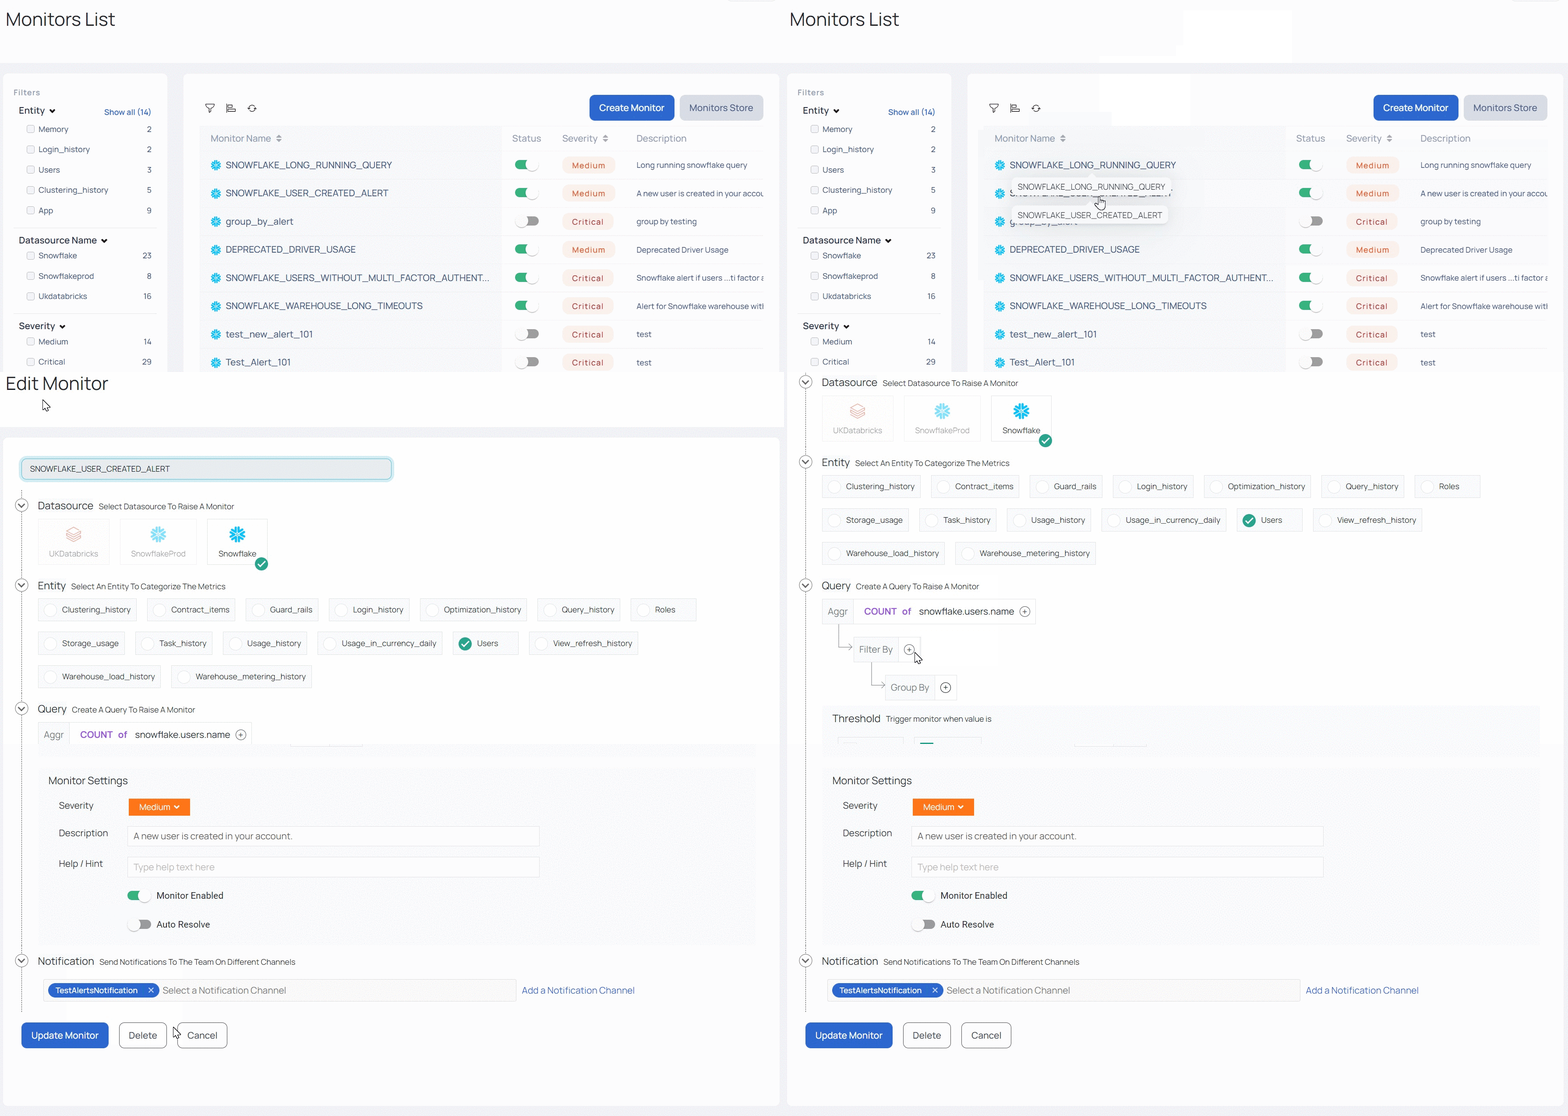
- If you edit a monitor and it does not appear on the Monitors List page, refresh the page to see it.
- From v2.7.0 onwards, you can enable or disable recommendations by clicking the toggle button. Recommendations automatically expire when they are no longer relevant.

Enable or Disable Recommendations
To delete an monitor, perform the following:
- Click the name of the monitor that you want to edit. The Edit Monitor page is displayed.
- Click Delete.
Cloning a Monitor
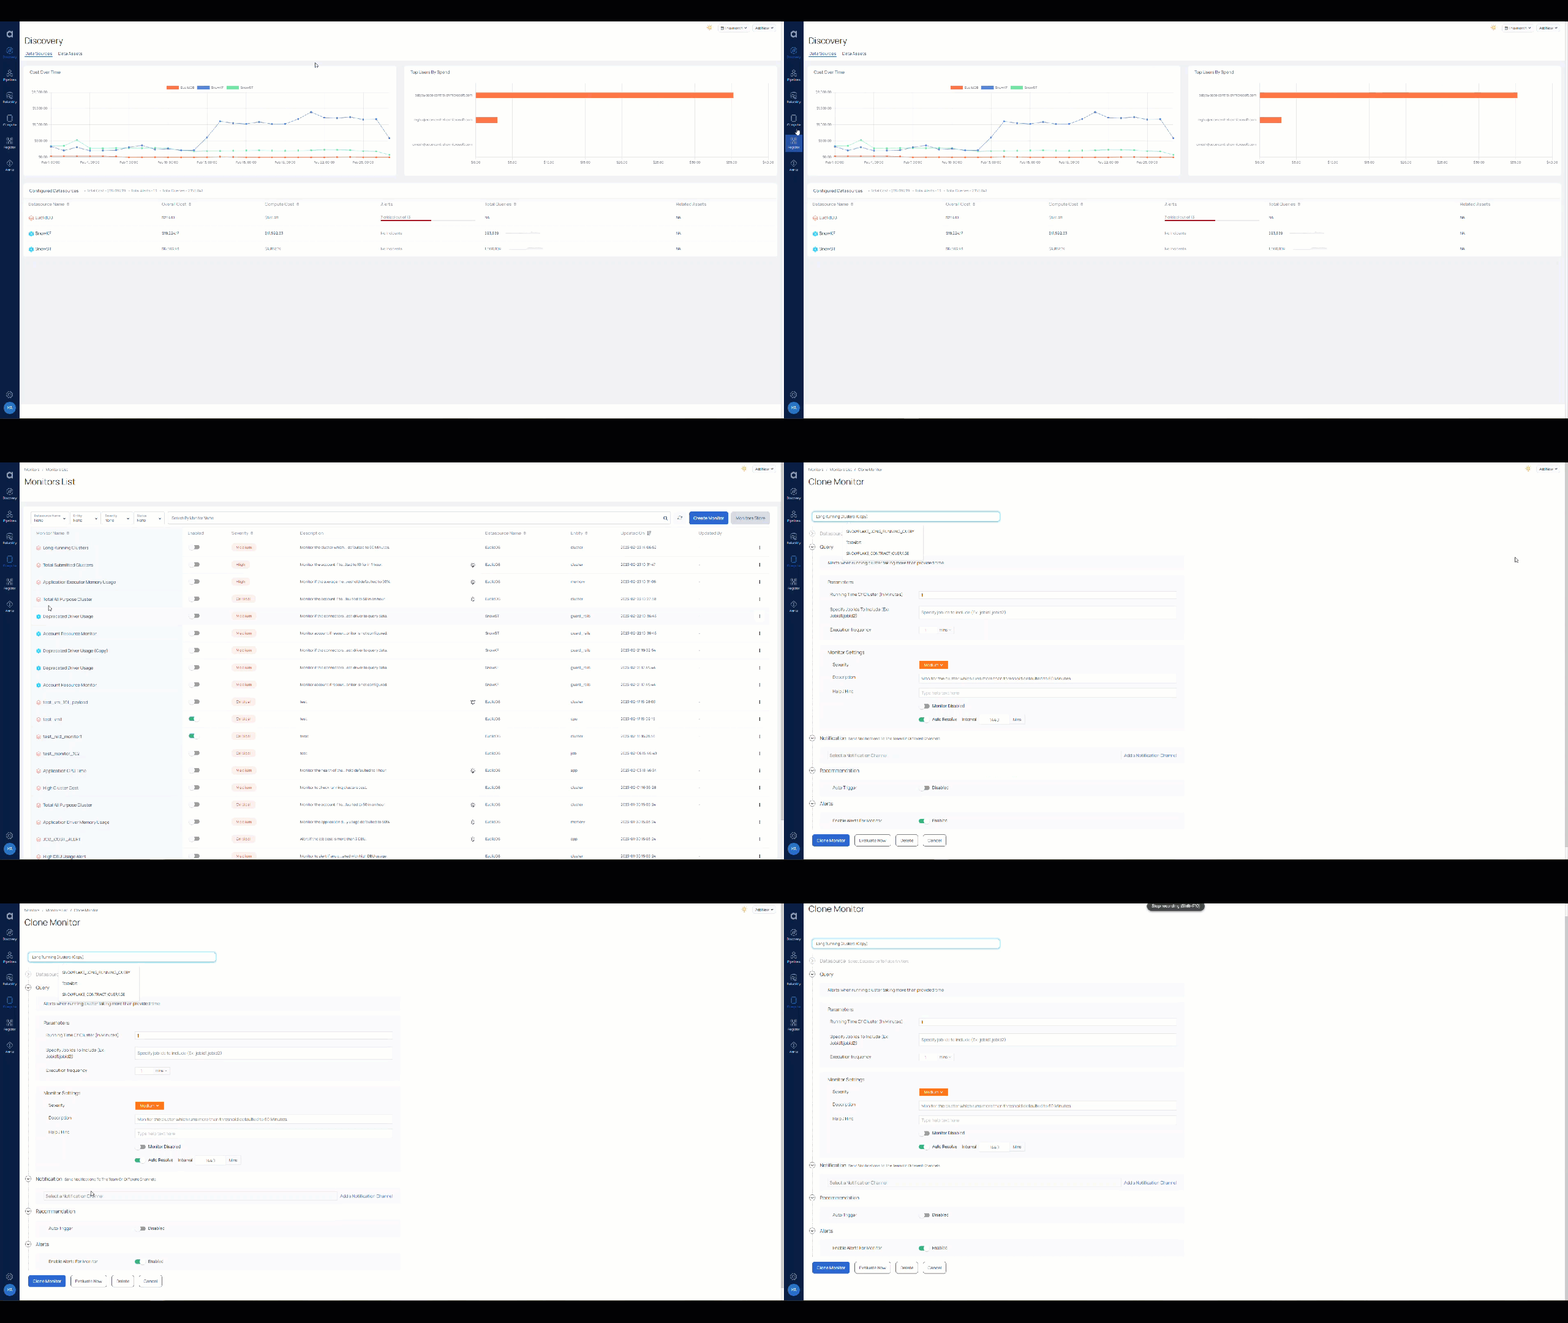
- Click the
button on the right-hand side of the page. - Select the Clone option. The name of the parent monitor shows on the cloned monitor.
- Change the Name and other specifications as necessary
- Click on the Clone Monitor button
Cloning a Monitor
Creating a Monitor
You can create monitors to notify people and groups when a certain metric exceeds its threshold value. Every monitor has a query (condition) that you can configure. The monitor query is evaluated periodically based on the evaluation frequency set. If the monitor query result exceeds the set threshold values, an Alert is raised.
To create a monitor, perform the following steps:
- Navigate to Compute from the side panel and click Monitors.
- Click the Create Monitor button. The Create Monitor wizard is displayed.
The Create Monitor wizard has the following five stages:
1. Monitor Name
Provide a name for the monitor that you want to create. The name you give the monitor helps in its identification. You cannot use blank spaces in a monitor name.
2. Data Source
Select the Data source for which you wish to create the monitor. If you have created multiple instances of single data source, you can view all the instances of the integration and can create a monitor for a specific instance or all the instances (In the following image, you can see that two instances of the Snowflake data source are created and one instance of Databricks is created).
3. Entity
The Entity defines the target for monitoring an application. Based on the type of Data Source selected, a number of entities are displayed. These entities vary for every Data Source. When you select a Data Source, its corresponding entities are displayed.
4. Query
The Query is structure to allow the user to define a set of conditions, schedule and actions for a monitor. Based on the selected entity, different Query metrics are displayed and it varies for each entity. Under Query you must define the following:
Aggregation
You must define the arithmetic combination of metrics. To define aggregation perform the following steps:
- Go to Aggr box under the query and select the operation you want to perform on the metric.
- Select the metrics from the drop-down menu. To add another metric, click on
icon, and select the metric from the drop-down menu. - To apply a filter, go to Filter by and click the
icon. Select the metric from the drop-down menu, and enter the value. To add multiple filters, click the icon, and to remove the filter click on the icon. - To group the queries, go to Group By and click on
icon, then select the metric from the drop-down menu. To add multiple metrics, click on the icon, and to remove the filter, click the icon.
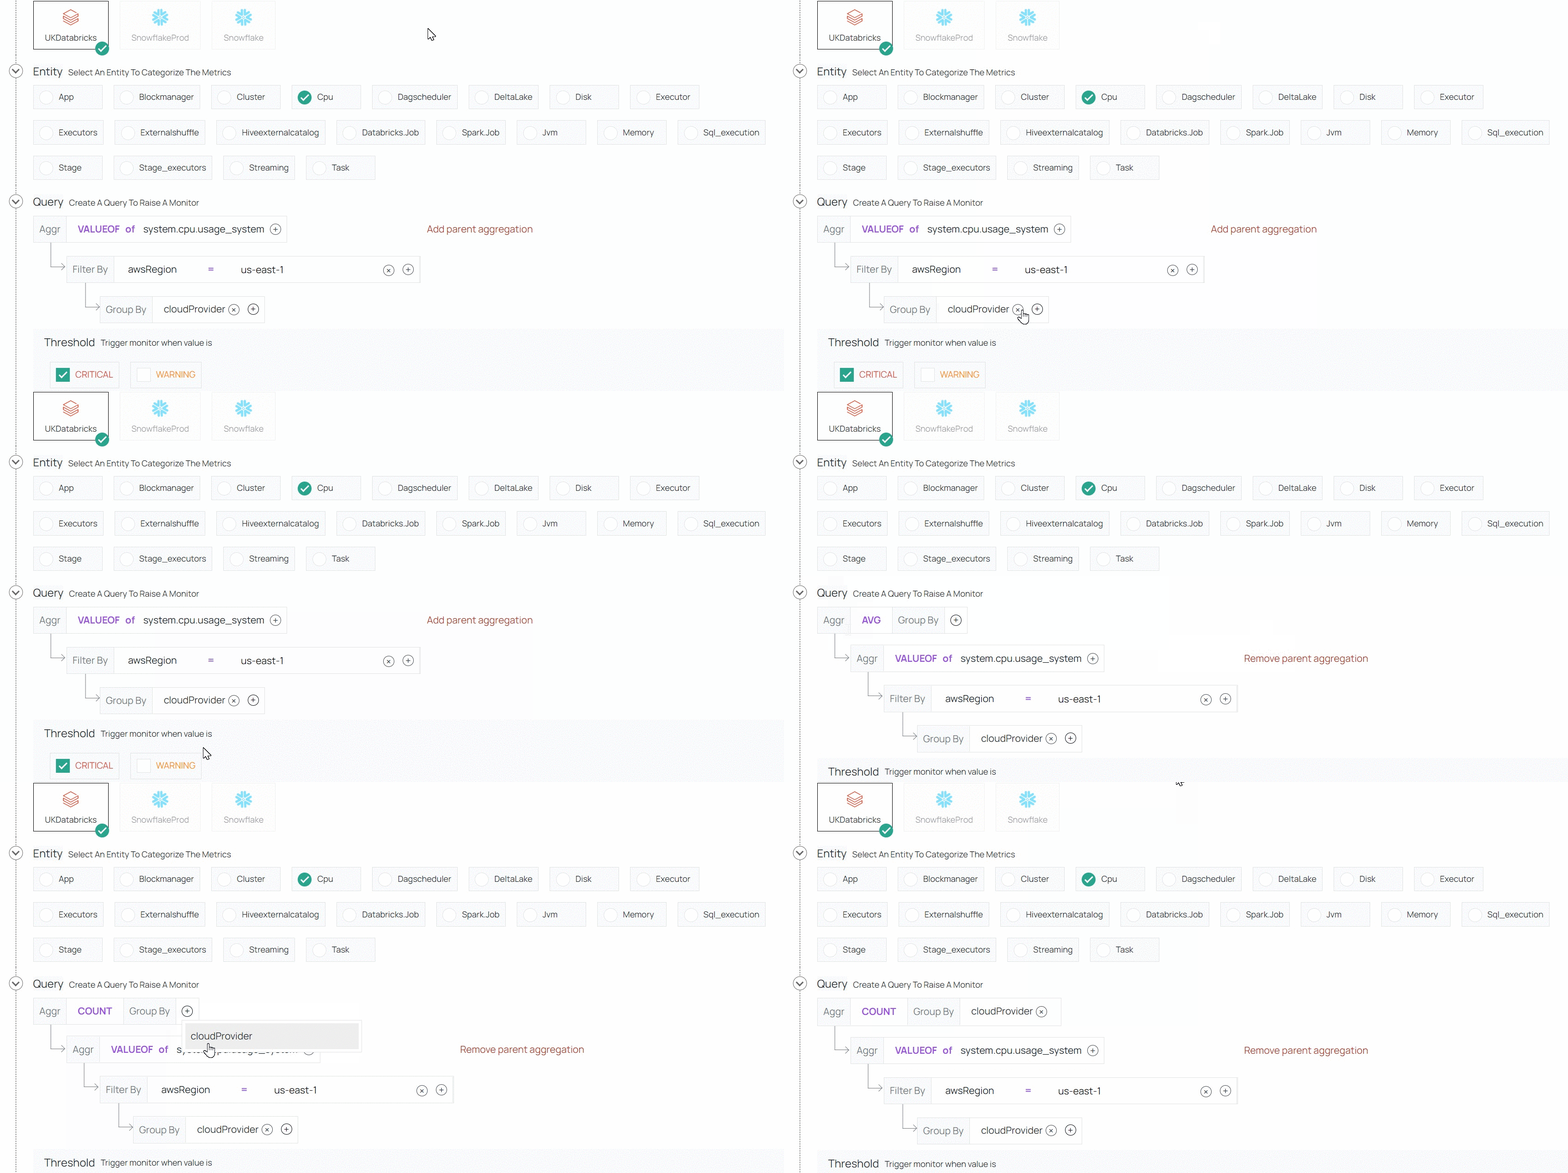
In the following image, the Query is created to monitor the system CPU usage time. A filter is applied to monitor only those devices that are located in the us-east-1 AWS zone. The devices are grouped according to their respective cloud service providers.
- Group By allows users to add a parent aggregation. To add a parent aggregation to the query, click Add Parent Aggregation, and to remove a parent aggregation, click Remove Parent Aggregation.
The following table describes each of the Databricks entities.
| Entity Name | Description |
|---|---|
| App | This entity holds the data associated with App submitted on Databricks for execution. This includes stats about execution time, data processed, efficiency, cores, memory, and the lifecycle |
| Blockmanager | The BlockManager entity provides the details for memory and disk consumed by a App's blockmanager |
| Cluster | The entity contains information about the cluster information, credit used, and start/end time. |
| CPU | This entity holds the data related to the CPU about IO wait time, usage, and idle CPU time |
| Dagscheduler | The Dagscheduler entity holds the data about stages and jobs that failed or active in the execution |
| Disk | This holds the system information about disk utilization |
| Executors | This entity holds information for all the executor's lifecycle - start/end time and cores used |
| Externalshuffle | This entity contains the information about the externalshuffle service and if enabled it holds information about the direct heap and memory used |
| Jvm | This entity contains the information related to JVM about heap and pools |
| Memory | This entity contain the memory utilisation by the system |
| Spark.job | This entity represents the information associated with job start/end time |
| Sql_executions | This entity contains the information for SQL execution at the job and workspace level |
| Stage | This entity holds the data associated with each state in the job. This includes stats about execution time, task processed, efficiency, and memory usage |
The following table describes each of the Snowflake entities.
| Entity Name | Description |
|---|---|
| Contract_items | This entity refers to the Snowflake contract for your organization. |
| Warehouse_load_history | You can use this entity to analyze the workload on your warehouses within a specified time range. This is represented as the average number of queries in 5-minute intervals. |
| Storage_usage | This entity represents the average daily data storage usage, in bytes, including data in database tables & files in all internal stages. |
| Task_history | This entity represents the history of task usage and contains one entry for each run of a task. |
| Usage_in_currency_daily | This entity contains the daily credit usage and usage in currency for your organization. |
| Roles | This entity contains a list of all roles defined in the account. |
| Clustering_history | This entity represents the automatic clustering history, which includes the credits consumed, bytes updated and rows updated each time a table is reclustered. |
| Optimization_history | This entity contains a history of the search optimization service name along with the credits consumed by the service. |
| Guard_rails | This entity contains the resource monitor information at the warehouse and account level, along with the statement timeout and statement queued timeout. |
| Warehouse_metering_history | This entity contains the hourly credit usage for all active warehouses in your account. |
| Users | This entity represents a list of all users in your account. |
| View__refresh__history | This entity represents the materialized view refresh history, which includes the view name and the credits consumed each time a materialized view is refreshed. |
| Query_history | This entity contains the history of all snowflake queries executed on your snowflake account. |
| Data_transfer_history | This entity contains the history of data transferred from Snowflake tables into a different cloud storage provider's network and/or geographical region. |
| Login_history | This entity represents the login attempts by users on your account. |
| Usage_history | This entity contains the history of data loaded into Snowflake tables using Snowpipe, along with the credits billed for your entire Snowflake account. |
For example, in the following parent aggregation, all the unique cloud service providers are counted as well, apart from grouping the data by cloud service providers.