Databricks SQL Warehouses
The SQL Warehouses section provides an in-depth analysis of compute resource usage and associated costs in Databricks SQL Warehouse. This feature allows administrators to monitor warehouse performance, track query execution efficiency, and optimize costs. With newly introduced dashboards and enhanced reporting, users can gain actionable insights into warehouse resource consumption.
Why Monitor SQL Warehouses?
Effective monitoring of SQL Warehouses is crucial for optimizing compute resources, reducing costs, and maintaining query performance. By centralizing warehouse insights, admins can identify high-cost operations, manage warehouse efficiency, and ensure seamless workload execution.
Navigating to SQL Warehouses
- Go to the Compute section.
- Click on the SQL Warehouses tab.
- Use the filter options (Organization Unit, Cost Center, Warehouse Type) to refine your view.
- Select a warehouse to explore detailed cost and performance metrics.
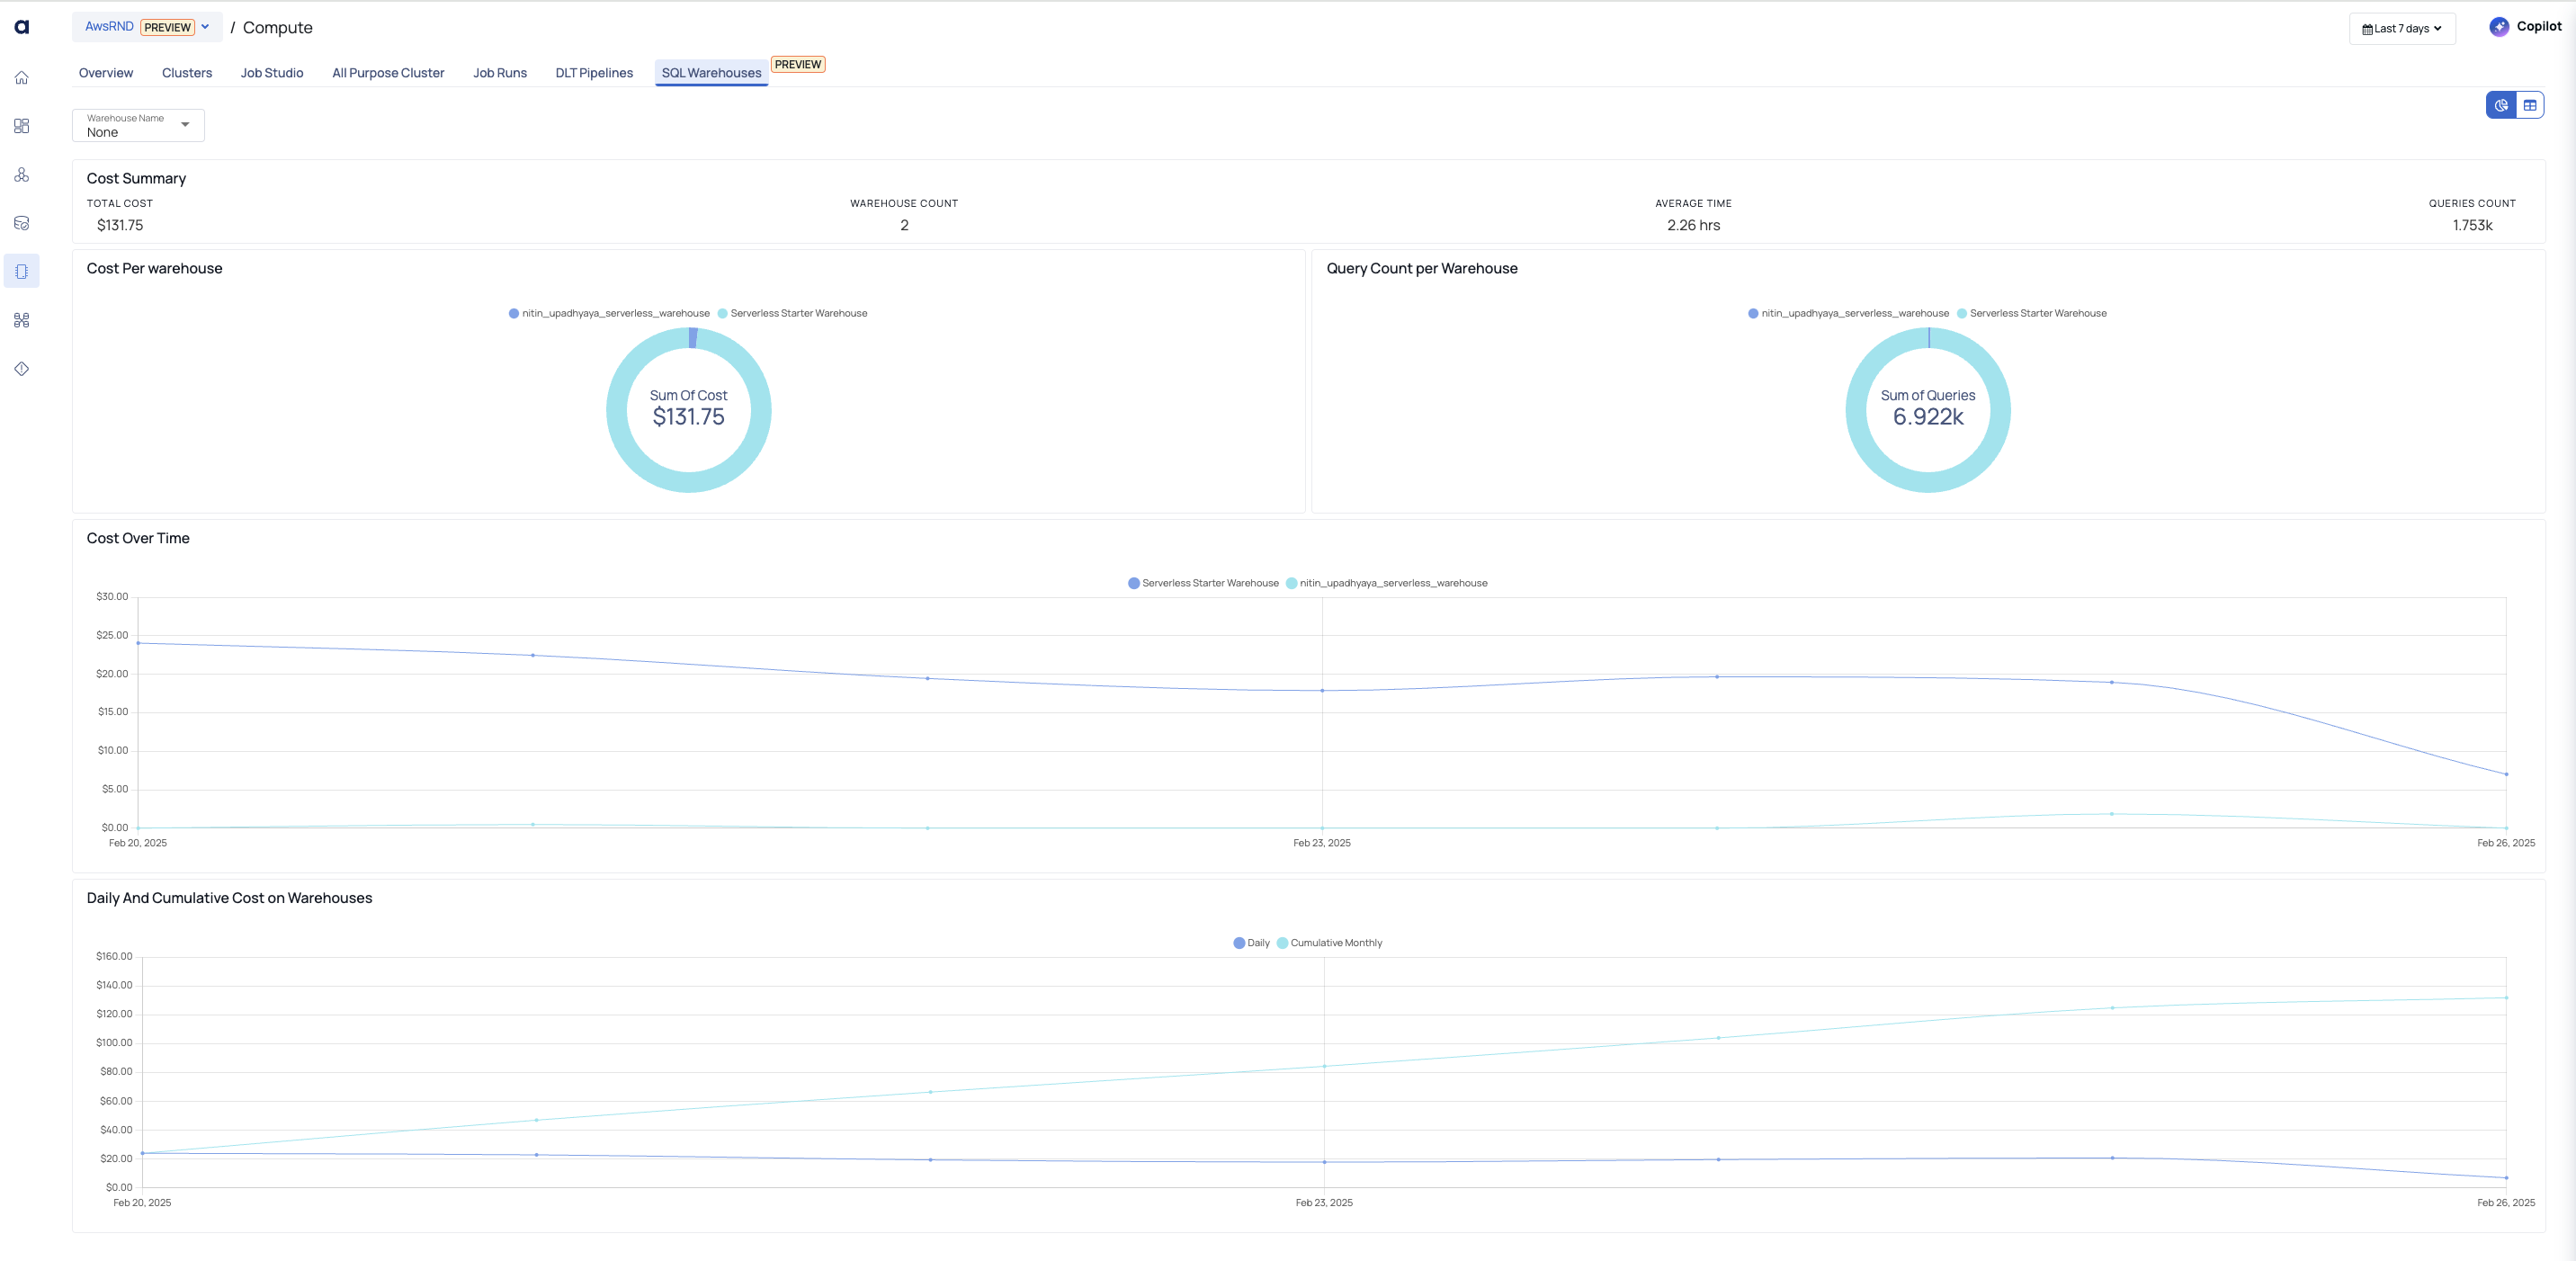
SQL Warehouses
Overview Metrics
Provides a high-level summary of SQL Warehouse activity.
| Component | Description |
|---|---|
| Total Cost | Displays the total compute cost for all warehouses. |
| Warehouse Count | Shows the total number of warehouses in use. |
| Average Execution Time | Indicates the average runtime for queries. |
| Total Queries Executed | Represents the total number of queries processed across warehouses. |
Cost Analytics
Breaks down compute expenses and provides insights into cost trends.
| Component | Description |
|---|---|
| Cost Per Warehouse | Visualizes cost distribution across different warehouses. |
| Query Cost Distribution | Highlights how query execution contributes to overall costs. |
| Cost Over Time | Tracks warehouse cost trends over selected time periods. |
Warehouse Performance
Analyzes execution efficiency and resource utilization.
| Component | Description |
|---|---|
| Top Warehouses by Cost | Lists the most expensive warehouses based on compute consumption. |
| Query Execution Performance | Displays query count and execution efficiency per warehouse. |
| Average Queue Load | Shows warehouse queue load trends to help identify performance bottlenecks. |
| Cluster Size Analysis | Provides insights into warehouse sizes and associated costs. |
Table View of SQL Warehouses
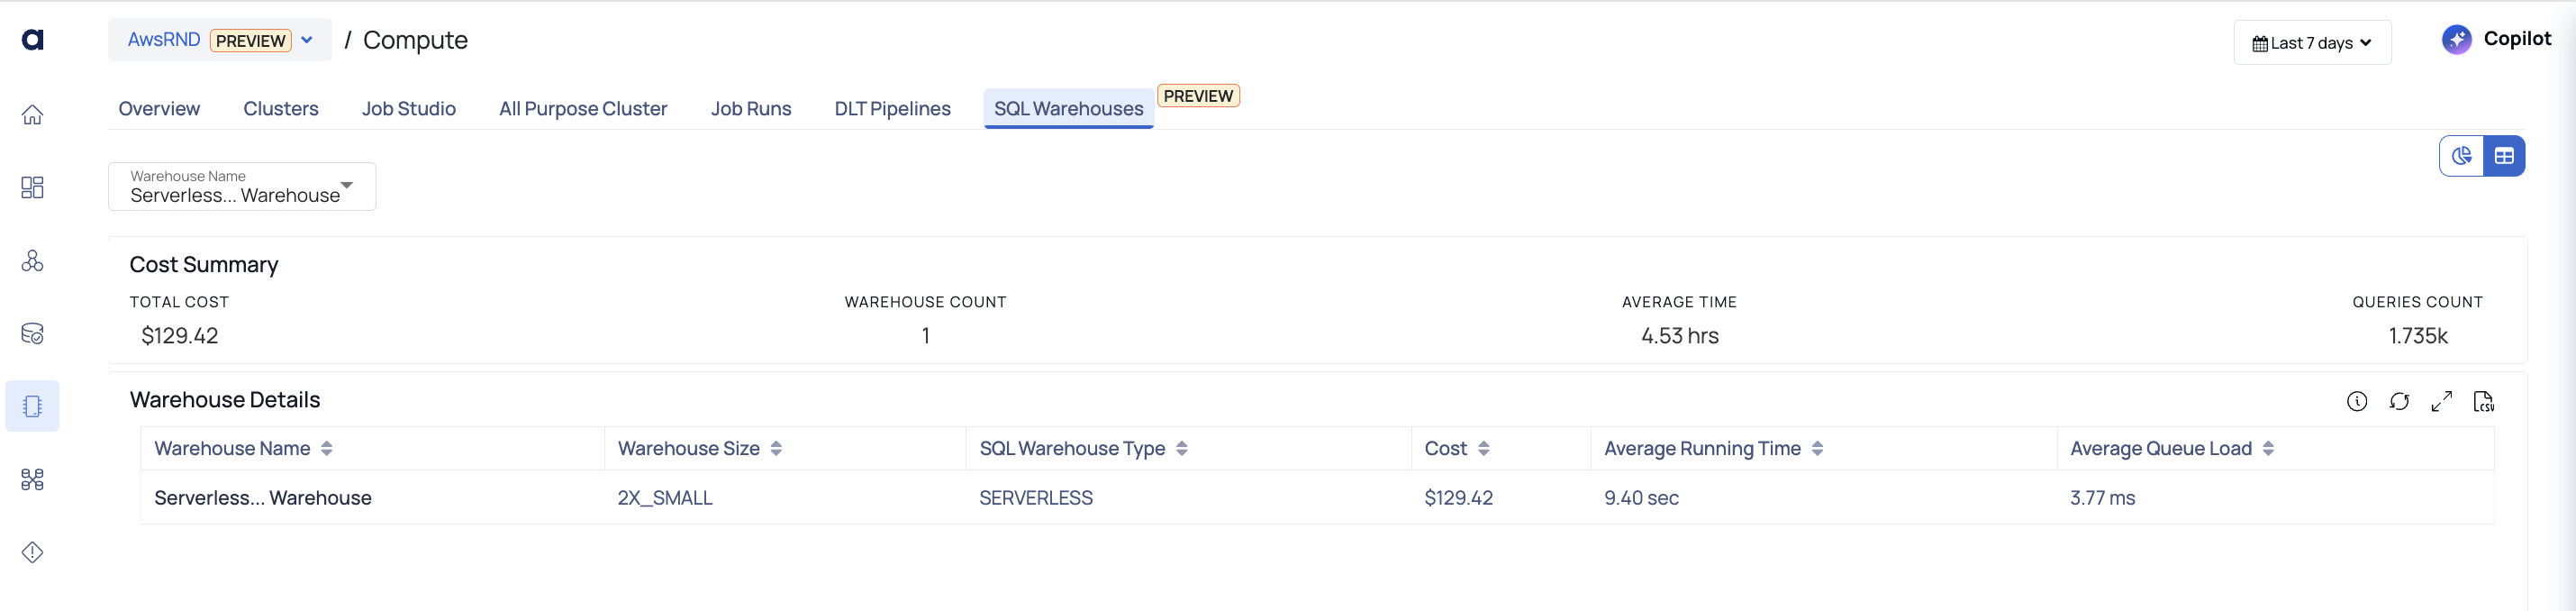
The Table View of SQL Warehouses provides a structured tabular format to analyze and compare different warehouses efficiently. It displays key cost, performance, and utilization metrics for each warehouse within the selected time frame.
Warehouse Details Table
The table consists of the following columns:
| Field | Description |
|---|---|
| Warehouse Name | Displays the name of the SQL warehouse. |
| Warehouse Size | Indicates the size of the warehouse (e.g., 2X_SMALL). |
| SQL Warehouse Type | Specifies whether the warehouse is Serverless or Classic. |
| Cost | Shows the total cost incurred by the warehouse over the selected period. |
| Average Running Time | Represents the average execution time of queries run in the warehouse. |
| Average Queue Load | Indicates the average time a query spends in the queue before execution. |
Additional Features
- Sorting and Filtering: You can sort columns to analyze warehouse performance based on cost, size, or runtime.
- Export Option: The table view provides an option to export the data as a CSV file for external analysis.
- Refresh: Click the refresh button to update the table with the latest metrics.